• Skip to primary navigation
  • Skip to main content
  • Skip to primary sidebar
  • Skip to footer
Jennifer Marohasy

Jennifer Marohasy

a forum for the discussion of issues concerning the natural environment

  • Home
  • About
  • Publications
  • Speaker
  • Blog
  • Temperatures
  • Coral Reefs
  • Contact
  • Subscribe

Temperatures

Myth and the Bureau of Meteorology

March 5, 2014 By jennifer

WE know that the Australian Bureau of Meteorology can’t forecast weather more than a few days out. So why should we believe a climate forecast to 2030?

According to Sara Phillips, writing for the Australian Broadcasting Corporation, the Bureau’s new State of the Climate 2014 report is a reliable source of information because it distils hundreds of experiments into three consistent reports.BOM

In fact there are few if any experiments that have been distilled in the writing of the reports. Rather Bureau staff have ran some computer simulations designed to produce a particular output, and combined this with homogenised and adjusted historical records again designed to produce a particular result. Conclusions include:

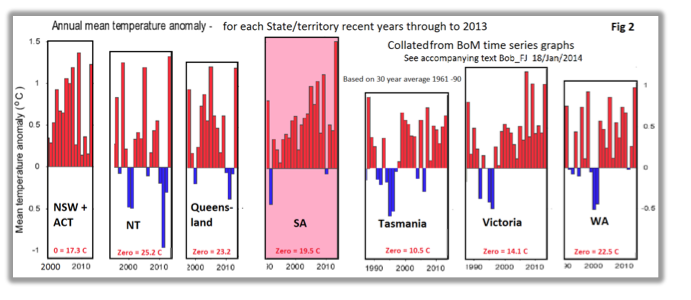
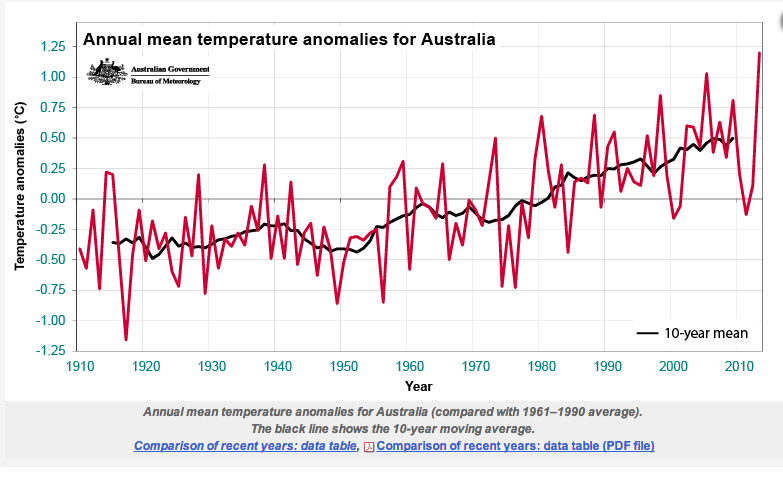
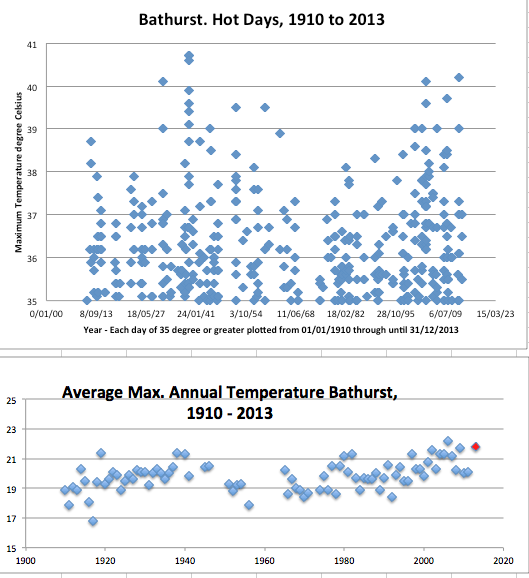
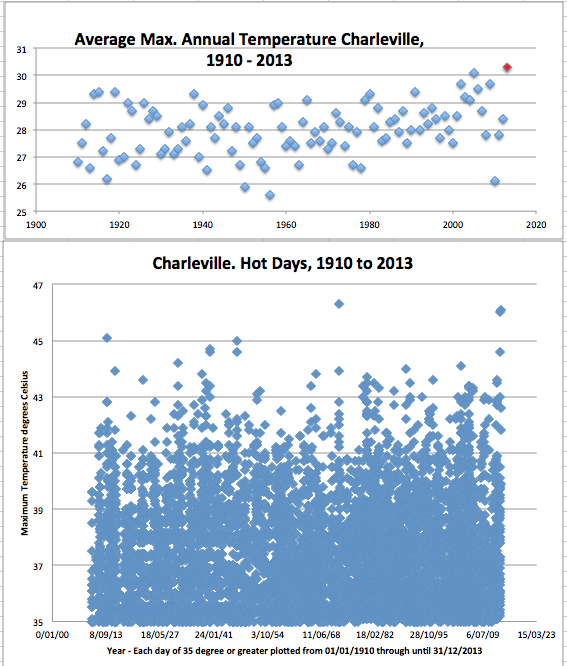
1. Australia’s climate has warmed by 0.9°C since 1910, and the frequency of extreme weather has changed, with more extreme heat and fewer cool extremes.

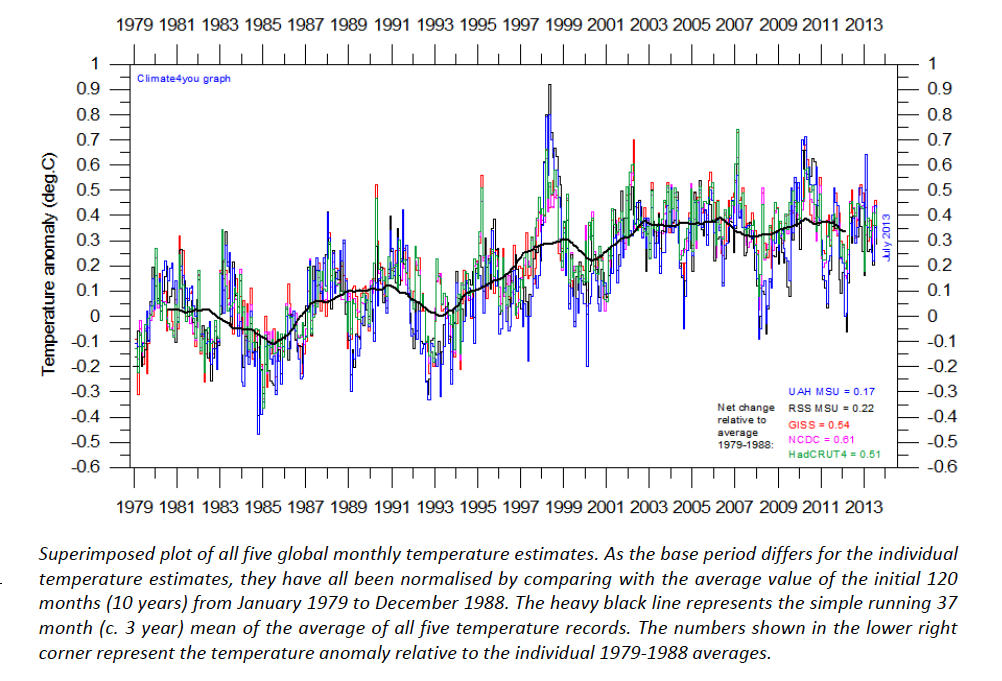
2. Global mean temperature has risen by 0.85°C from 1880 to 2012.

When I wrote to the Bureau in January asking why the national average is only calculated back to 1910, I received a reply explaining that data prior to 1910 “is often fragmented and of uncertain or low quality”. If this were the case, it begs the question how a global mean temperature can be calculated back to 1880?

This is one of seven questions I’ve put to Greg Hunt, Minister for the Environment, in a letter dated 4th March 2014. Minister Hunt is ultimately responsible for the operations of the Bureau and I’m of the opinion their operations deserve close scrutiny.

There is this myth that the Bureau is comprised of hard working scientists providing, like the Australian Broadcasting Corporation, information without bias or agenda. More likely the Bureau, like the mainstream climate science community more generally, has become somewhat compromised.

Of particular concern to me, is the Bureau’s decision of last June, to discard the statistical models that had been used to generate seasonal rainfall forecasts in favour of a general circulation model that has no predictive skill at all. I have documented the absence of skill in the general circulation model in a peer-reviewed paper recently published in the journal Atmospheric Research (Volume 138, Pages 166-178).

I conclude my letter to Minster Hunt with comment that:

If the temperature record for Australia can be extended back to 1860, providing an additional 50 years of data, then this should be a priority. This information is more important than the calculation of a national average temperature. If data is to be adjusted and homogenized then the methodology applied needs to be clearly stated. Indeed having access to all the available records as far back as possible is important because it helps unravel the true features of the natural climate cycle, a goal that meteorologists and astronomers were working towards well before the establishment of the Bureau in 1908.

In arriving at theories that explain the natural world, the best scientists always use all the available data, not just the data that happens to fit a particular viewpoint. Furthermore, long historical data series are critical for statistical methods of rainfall forecasts, including the application of artificial neural networks that can currently provide more skillful forecasts than POAMA, the general circulation model currently used by the Bureau to produce the official forecasts. That the Bureau persists with POAMA, while failing to disclose to the Australian public the absence of any measurable skill in its monthly and seasonal forecasts, should be of grave concern to the Australian parliament.

My letter to the Minister can be read in its entirety here: https://jennifermarohasy.com.dev.internet-thinking.com.au/questions-for-the-australian-bureau-of-meteorology/

Filed Under: Information, News, Opinion Tagged With: Climate & Climate Change, Rainfall forecasting, Temperatures

Temperature Variability by State and Over Recent Years: Comment from Bob F-J on 2013 Record

February 3, 2014 By jennifer

I HAVE already detailed my concerns with the claim by the Bureau of Meteorology that 2013 was the hottest year on record. Thank you for your many comments in the threads that followed the two blog posts. I am taking many of these comments into consideration in the development of a further set of questions.

In the meantime Bob Fernley-Jones, a retired engineer based in Melbourne, suggests that even if one accepts the truncating and adjusting that the Bureau has undertaken to arrive at the 2013 record annaul average temperature, given the actual temperature statistics published by the Bureau, David Jones was not justified in making the headline-grabbing statements that he did on January 3, in particular that there is a general warming trend and that it is Australia-wide.
Mr Fernley-Jones makes the following points, with the charts and supporting references available for download here:

1. One data point does not make a trend. There has been considerable variability over recent years in both the annual mean temperature anomaly and also the annual maximum temperature anomaly, Chart 1.

2. When regional variability is considered it is evident that only one state, South Australia, was signficiantly warmer in 2013, Chart 2.

3. The seasonal distribution of temperature is important, for instance warmer winters might arguably be a good thing for South Australia, while hotter summer are generally not. When the season mean temperatures for South Australia are considered for the period 1990 to 2013, the summer of 2013 was not particularly hot, Chart 3. In fact not a single season was hotter in 2013.

4. While much has been made of January 2013 being exceptionally hot, when the mean January temperature anomaly is plotted for South Australia back to 1910, Chart 4, it is apparent that 2013 was not an exceptionally hot January with hotter January’ occuring in the 1930s.

5. According the Bureau’s own time series data based on truncated and adjusted data series, mean January maximum temperatures have been flat since 1934 for the Northern Territory, and since 1947 for Queensland. New South Wales and the Australian Capital Territory have hotter January’s going back to 1938. South Australia, the hottest region for 2013, has eight hotter January’s going back to 1933. Tasmania has about 25 hotter January’s going back to 1917. Victoria has about 20 hotter January’s going back to 1939.

Mr Fernley-Jones’ critic can be read in more detail by downloading this document BobF-J_BlogVer2.

SA Hottest

Filed Under: Information Tagged With: Temperatures

Bureau Confirms Calculating Australia’s ‘Average’ Temperature Involves Some Hocus-pocus

January 28, 2014 By jennifer

THE Australian Bureau of Meteorology, BOM, doesn’t have a set of temperature thermometers regularly positioned across the landmass of Australia from which it might derive an average annual temperature. Rather many more of it’s approximately 750 temperature recording stations are in south eastern Australia, some have records that date back to the 1850s, while others only started recording last year.
How do you derive an average annual temperature for Australia from such a mix of measurements? Screen Shot 2014-01-28 at 3.52.51 PM

The Bureau’s solution is to select a subset of about 112 stations from the 750. Some of the stations in the subset started recording temperatures in the 1850s, others not until the 1960s. Then the bureau truncates the longer temperature records, in some cases by discarding over 50 years of data, indeed everything before the somewhat arbitrary date of 1910. Data before this date is not considered reliable, but then the Bureau applies corrections to some of the rest of the data even though it should be reliable. Then the adjusted and truncated values from the subset are fitted to a grid to generate an area-weighted average of the data.

There is no single document that describes this methodology. Rather in a letter from the Bureau dated 24th January, responding to my request for information, I was directed to a mix of Bureau reports, peer-reviewed papers and also a PhD thesis by way of justification, methodology and for a list of stations.

In short, there is no straightforward way to verify the claim that last year, 2013, was the hottest calendar year on record. This is the claim the Bureau made in a media release on 3rd January 2014.

When individual stations with long temperature records are examined the late 1890 and 1930s appear to be as hot as recent years.

Ever since Climategate, deeply disturbing questions have been asked about the way climate science is conducted and also the state of the climate data. The Australian Bureau of Meteorology’s own databases feature in the leaked emails with the infamous ‘Harry Read Me’ file complaining about jumbled values and incorrect start dates for particular stations.

The mainstream climate science community has a vested interest in the average temperature for Australia increasing year-on-year because it has embraced the theory of anthropogenic global warming and invested heavily in research that assumes this theory.

It is time that the Bureau was more transparent in how it calculated its average annual values, and that it developed a method for benchmarking these annual average values. The benchmarking could be against satellite data and also against individual stations in Australia for which there are long temperature records.

**************

Click here to download the Bureau’s reply to my letter of 9th January requesting information to enable verification of the claim that 2013 was the hottest year on record.

Click on the image to see a chart of the Bureau’s annual mean temperature anomaly for Australia, this value is derived from the annual mean.

Filed Under: Information Tagged With: Temperatures

Open Letter Requesting Verification of 2013 Temperature Record

January 9, 2014 By jennifer

Dr David JonesSunset Neil Hewitt
Manager of Climate Monitoring and Predictions
Australian Bureau of Meteorology

Dear Dr Jones

Re: Request Verification of 2013 Temperature Record

I am writing to request information be made publicly available to myself and others so we may have the opportunity to verify the claim made by you on behalf of the Australian Bureau of Meteorology that 2013 was the hottest year on record in Australia. In particular it is claimed that the average temperature was 1.20°C above the long-term average of 21.8°C, breaking the previous record set in 2005 by 0.17°C.

This claim is being extensively quoted, including in a report authored by Professor Will Steffen of the Climate Council, where he calls for the Australian government to commit to further deep reductions in greenhouse gas emissions because of this “record-breaking year”. Accurate climate records are not only of political interest, but are also of importance to those of us who rely on historical temperature data for research purposes. For example, the skill of the medium-term rainfall forecasts detailed in my recent peer-reviewed publications with John Abbot, have been influenced by the reliability of the historical temperature data that we inputted. From a very practical perspective, businesses will adjust their plans and operations based on climate data, and ordinary Australians worry and plan for the future based on anticipated climate trends.

Further, I note that you said in a radio interview on January 3, 2014, following your “hottest year on record” press release that, “We know every place across Australia is getting hotter, and very similarly almost every place on this planet. So, you know, we know it is getting hotter and we know it will continue to get hotter. It’s a reality, and something we will be living with for the rest of this century.”

The Australian Bureau of Meteorology is the custodian of an extensive data network and over a long period now, questions have been asked about the legitimacy of the methodology used to make adjustments to the raw data in the development of the Australian Climate Observations Reference Network – Surface Air Temperatures (ACORN-SAT). Furthermore, questions have been asked about why particular stations that are subject to bias through the Urban Heat Island (UHI) effect continue to be included in ACORN-SAT. In particular why is ‘Melbourne Regional Office’, a station at the corner of Victoria Parade and Latrobe Street (Melbourne CBD) still included in the ACORN-SAT network when this station is known to have become sheltered from previously cooling southerly winds following construction of office towers.

I understand ACORN-SAT was used to calculate the statistics indicating 2013 was the hottest year on record, but it is unclear specifically which stations from this network were used and how data may have been further adjusted in the development of the record breaking temperature anomaly.

Rockhampton-based blogger Ken Stewart, for example, has suggested that in the calculation of the annual average temperature for Australia, the eight sites acknowledged as having anomalous warming due to the UHI would not have been included. Is this the case? I had assumed that the Bureau used all 112 ACORN-SAT locations, and thus that the record hot temperature anomaly announced by you, actually includes a UHI bias.

Radio presenter Michael Smith has given some publicity to claims made by blogger Samuel Gordon-Stewart that the Bureau has overestimated the average Australian temperature by about 4 degrees. Mr Gordon-Stewart calculated average temperatures and temperature anomalies from data from all the weather stations listed by Weatherzone.

Furthermore, given many ACORN-SAT stations have continuous temperature records extending back to the mid-late 1800s and many stations were fitted with Stevenson screens by 1900, why does the Bureau only use data after 1909, all the while claiming that 2013 is the hottest year on record? Indeed it is well documented that the 1890s and early 1900s, years corresponding to the Federation drought, were exceptionally hot.

In summary, given the importance of the historical temperature record, and the claim that 2013 is the hottest year on record, could you please provide details concerning:
1. The specific stations used to calculate this statistic;
2. The specific databases and time intervals used for each of these stations;
3. The history of the use of Stevenson screens at each of these station;
4. How the yearly average temperature is defined; and
5. Clarify what if any interpolation, area weighting, and/or adjustments for UHI bias, may have been applied to the data in the calculation of the annual mean values.

Kind regards

Dr Jennifer Marohasy
Scientist, Blogger, Columnist
PO Box 692
NOOSA HEADS Q. 4567
Tel Mobile: 041 887 32 22

***
The above text was sent as an email to Dr David Jones earlier this evening. The photograph is of a sunset taken in northern Australia by Neil Hewitt of Cooper Creek Wilderness.

Filed Under: Information Tagged With: Temperatures

Last Year, 2013: A Hot Year for Australia

January 7, 2014 By jennifer

ANOTHER year, and another announcement from the Australian Bureau of Meteorology that it is getting hotter. Indeed on January 3, 2014, David Jones, Manager of Climate Monitoring and Predictions at the Bureau, explained in a radio interview that: “We know every place across Australia is getting hotter, and very similarly almost every place on this planet. So, you know, we know it is getting hotter and we know it will continue to get hotter. It’s a reality, and something we will be living with for the rest of this century.”

I’m not sure that its going to continue to get hotter, but last year was hot.

According to Dr Jones, the hottest place in 2013 was Moomba in South Australia where a temperature of 49.6°C was recorded in January. What Dr Jones didn’t explain, however, is that temperatures have only been recorded at Moomba since 1995. So we don’t actually know how hot it was at Moomba during the federation drought or in 1939.

I’ve been following trends at Bathurst where temperatures have been recorded at the jail since 1858 and at the agricultural college since 1908. In October, after plotting days when maximum temperatures exceeded 35 degree Celsius, I indicated that there has been no increase in hot days at Bathurst, http://www.mythandthemurray.org/no-increase-in-hot-days-at-bathurst-or-the-misguided-politics-of-attributing-bushfires-to-global-warming/ .

But after plotting the really hot days through until the end of 2013, I’m happy to concede that it’s virtually as hot now as it was back in 1939, Chart 1. On 11th January 1939 temperatures climbed to 40.7 degrees at the Bathurst agricultural station. In January last year it reached 40.2 degrees. Furthermore, when averages maximum temperatures are combined for each year, there appears to be a slight warming trend, Chart 2.

Charts 1 n 2

Unfortunately, the average for the year 1939 is not shown in Chart 2 as maximum daily temperatures are not available in the digitized record for May through to September of that year for this site. The hottest year at the Bathurst agricultural college according to this statistic (whereby maximum daily temperatures are averaged for the year) was 2006 with an annual average maximum daily temperature of 22.2 degrees compared to an average maximum for 2013 of 21.8 degrees.

If we go further north to western Queensland and consider the long temperature trend for Charleville, then last year appears to be a record hot year, Chart 3. All years are shown from 1910 based on my averaging of the available daily maximum values from the Bureau’s homogenized ACORN* data set to the end of 2012. I’ve relied on the raw daily values for 2013. I’ve made no adjustments for missing values in this record and have not compared the raw data to the end of 2012 with the ACORN-SAT adjusted data.*

When individual hot days are plotted for Charleville, the hottest day at 46.3 degree Celsius shows as 4th January 1973, Chart 4. This is closely followed by 46.0 degrees recorded just last year on 29th December 2013. And just a few days ago, on 3rd January 2014, it was 46.1 degrees at Charleville.

Charts 3 and 4 revised

The hotter than average conditions in Australia for 2013 show up in the satellite record as published by the University of Alabama in Huntsville, Chart 5. According to this record, globally 2013 was the fourth warmest year since measurements began in 1978, http://wattsupwiththat.com/2014/01/03/global-temperature-report-december-2013/ .

Satellite Temps 2013

*****

ACORN-SAT is the Australian Climate Observations Reference Network – Surface Air Temperature. Data can be downloaded here http://www.bom.gov.au/climate/change/acorn-sat/ .

Ken Stewart, John Sayers, Jo Nova and others have shown up many issues with this database, for example, http://joannenova.com.au/2012/06/threat-of-anao-audit-means-australias-bom-throws-out-temperature-set-starts-again-gets-same-results/ . It nevertheless remains a useful source of information. For the Bathurst agricultural station the long unadjusted data set (recently purchased by me from the Bureau) accords well with the publically available ACORN dataset. I have no particular opinion on the reliability of the Charleville ACORN data as I do not have access to the unadjusted Charleville data before 1948.

Filed Under: Information, News Tagged With: Climate & Climate Change, Temperatures

Global Warming Stalls, Climate Scientists Fiddle Temperature Record

September 22, 2013 By jennifer

WHEN Tim Flannery was sacked last week as Australia’s Climate Commissioner he claimed that this last year has been the hottest on record. I don’t believe him because the raw data doesn’t support that claim, only the metadata for Australia, which has been adjusted, shows recent warming. Willis Eschenbach explains how they ‘fix the data’ in an article published back in 2009 titled ‘The Smoking Gun at Darwin Zero’ [1].

Mr Eschenbach showed how, from the hundreds of available weather recording stations in Australia, the IPCC used only three stations to cover the period 1897 to 1992 [1]. Not only were the IPCC selective in the stations used, they ‘homogenized’ the raw data from these stations before using it. Homogenization had the effect of causing a 0.7C per century falling temperature trend to show a 1.2C per century increase with the adjustments made involving a change of over 2C per century.

Mr Eschenbach made the comment that, “when those guys ‘adust’, they don’t mess around. And the adjustment is an odd shape, with the adjustment first going stepwise, then climbing roughly to stop at 2.4C.”

All five global temperature estimates show no increase, at least since 2002, fig. 1 [click on the image for a larger and clearer view]. There has been no increase in global air temperature since 1998, which was affected by the oceanographic El Nino event of that time [2]. Global Temps August 2013

[Read more…] about Global Warming Stalls, Climate Scientists Fiddle Temperature Record

Filed Under: Information, News, Opinion Tagged With: Climate & Climate Change, Temperatures

  • « Go to Previous Page
  • Go to page 1
  • Interim pages omitted …
  • Go to page 10
  • Go to page 11
  • Go to page 12
  • Go to page 13
  • Go to Next Page »

Primary Sidebar

Recent Comments

  • Ian Thomson on Vax-ed as Sick as Unvax-ed, Amongst My Friends
  • Dave Ross on Vax-ed as Sick as Unvax-ed, Amongst My Friends
  • Dave Ross on Vax-ed as Sick as Unvax-ed, Amongst My Friends
  • Alex on Incarceration Nation: Frightened of Ivermectin, and Dihydrogen monoxide
  • Wilhelm Grimm III on Incarceration Nation: Frightened of Ivermectin, and Dihydrogen monoxide

Subscribe For News Updates

  • This field is for validation purposes and should be left unchanged.

November 2025
M T W T F S S
 12
3456789
10111213141516
17181920212223
24252627282930
« Jan    

Archives

Footer

About Me

Jennifer Marohasy Jennifer Marohasy BSc PhD has worked in industry and government. She is currently researching a novel technique for long-range weather forecasting funded by the B. Macfie Family Foundation. Read more

Subscribe For News Updates

Subscribe Me

Contact Me

To get in touch with Jennifer call 0418873222 or international call +61418873222.

Email: jennifermarohasy at gmail.com

Connect With Me

  • Facebook
  • LinkedIn
  • RSS
  • Twitter
  • YouTube

Copyright © 2014 - 2018 Jennifer Marohasy. All rights reserved. | Legal

Website by 46digital