• Skip to primary navigation
  • Skip to main content
  • Skip to primary sidebar
  • Skip to footer
Jennifer Marohasy

Jennifer Marohasy

a forum for the discussion of issues concerning the natural environment

  • Home
  • About
  • Publications
  • Speaker
  • Blog
  • Temperatures
  • Coral Reefs
  • Contact
  • Subscribe

Blog

Temperature Variability by State and Over Recent Years: Comment from Bob F-J on 2013 Record

February 3, 2014 By jennifer

I HAVE already detailed my concerns with the claim by the Bureau of Meteorology that 2013 was the hottest year on record. Thank you for your many comments in the threads that followed the two blog posts. I am taking many of these comments into consideration in the development of a further set of questions.

In the meantime Bob Fernley-Jones, a retired engineer based in Melbourne, suggests that even if one accepts the truncating and adjusting that the Bureau has undertaken to arrive at the 2013 record annaul average temperature, given the actual temperature statistics published by the Bureau, David Jones was not justified in making the headline-grabbing statements that he did on January 3, in particular that there is a general warming trend and that it is Australia-wide.
Mr Fernley-Jones makes the following points, with the charts and supporting references available for download here:

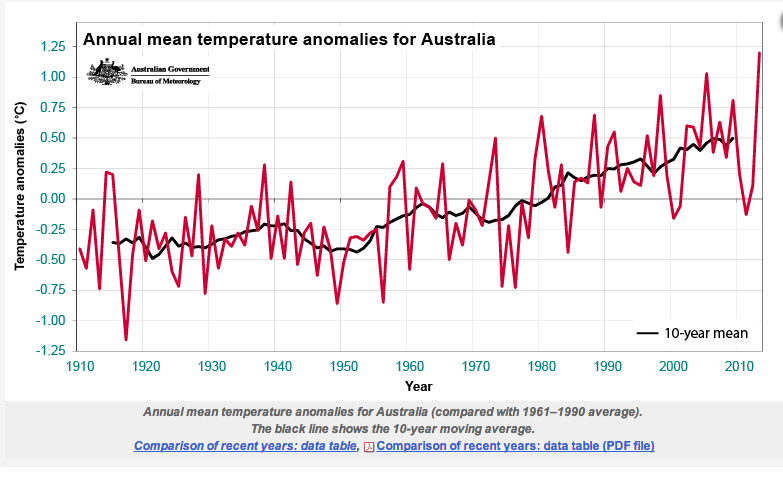
1. One data point does not make a trend. There has been considerable variability over recent years in both the annual mean temperature anomaly and also the annual maximum temperature anomaly, Chart 1.

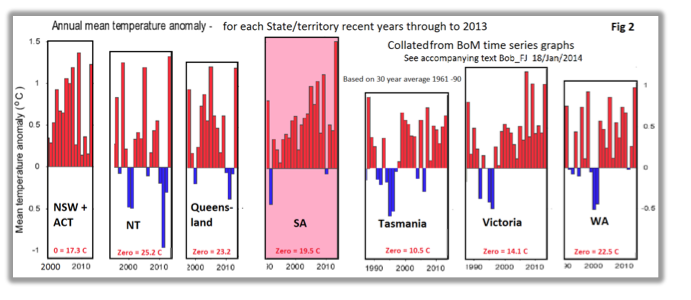
2. When regional variability is considered it is evident that only one state, South Australia, was signficiantly warmer in 2013, Chart 2.

3. The seasonal distribution of temperature is important, for instance warmer winters might arguably be a good thing for South Australia, while hotter summer are generally not. When the season mean temperatures for South Australia are considered for the period 1990 to 2013, the summer of 2013 was not particularly hot, Chart 3. In fact not a single season was hotter in 2013.

4. While much has been made of January 2013 being exceptionally hot, when the mean January temperature anomaly is plotted for South Australia back to 1910, Chart 4, it is apparent that 2013 was not an exceptionally hot January with hotter January’ occuring in the 1930s.

5. According the Bureau’s own time series data based on truncated and adjusted data series, mean January maximum temperatures have been flat since 1934 for the Northern Territory, and since 1947 for Queensland. New South Wales and the Australian Capital Territory have hotter January’s going back to 1938. South Australia, the hottest region for 2013, has eight hotter January’s going back to 1933. Tasmania has about 25 hotter January’s going back to 1917. Victoria has about 20 hotter January’s going back to 1939.

Mr Fernley-Jones’ critic can be read in more detail by downloading this document BobF-J_BlogVer2.

SA Hottest

Filed Under: Information Tagged With: Temperatures

Save Lady Elliot, Set AirCon to 25 Degrees

February 1, 2014 By jennifer

Dear Jennifer, I had a holiday on Lady Elliot Island in October 2013 and while there took the attached photos with the idea that I might send the one of the climate change sign to an Australian blog as an example of Federal Government alarmist propaganda.

Lately the tide seems to be turning against the CO2 global warming scam with the Akademik Shokalskiy debacle in the Antarctic, record polar sea ice totals, the circumpolar vortex in the northern hemisphere and Tom Switzer’s article in the Sydney Morning Herald. However with the heat waves lately in Australia the warmists are fighting back with the usual dodgy forecast heat records which are very seldom reached but most people don’t question them. I commend you for your open letter to the BOM requesting verification of the 2013 temperature record.Lady Elliot

I had another look at this photo of the sign today to work out again how much sea level rise they showed in the graph from 1990 to 2013 and it scaled about 300mm or 13.04mm/year. As another check I scaled the 600mm rise over 57.5 years and only got 10.43mm/year which seemed extremely odd, (I’m a retired land surveyor used to working with graphs).

On further inspection I finally noticed that the 5 year intervals on the x axis read 2010, 2015 then jumped 15 years to 2030 and back to 5 year intervals from 2035 to 2055 which explained the yearly rise difference. The sign writer obviously made a booboo or the original information he was given was wrong. Either way the error should have been corrected before the sign was released for public viewing. The nearest National Tide Centre Gauge at Rosslyn Bay shows a rise of about 2.8mm/year and has only operated since 1993 so the 13mm/year rise on the graph is ridiculous.

As the Great Barrier Reef is in your bailiwick I thought you might be interested in publicising the gross errors on this “way over the top” sign and I assume that a similar one is also on most of the other islands controlled by the GBR Marine Park Authority but you will probably be able to find this out easier than I can. The 03 in the top left corner may be its sign number.

Regards
Sel Hopley

Click on the image for a larger and better view of the entire photograph including the how to save the Island by setting your air con at 25 degrees celsius.

Filed Under: Information Tagged With: sea level change

Japanese Whale Harvest Halted by Activists Operating ‘Small Navy’?

January 31, 2014 By jennifer

I HAVE no problems with the sustainable harvest of whales in the Southern Ocean using a grenade tipped harpoon to facilitate a quick death. This is the method used by the Japanese. Usually the Australian Broadcasting Corporation reports extensively on the activists attempts to stop this harvest, and from their righteous perspective. I’ve just received the following media release from the Sea Shepherd. They must be desperate to get some news out if they are now sending me their media releases…

SEA SHEPHERD SECURES THE SLIPWAY OF THE NISSHIN MARU: WHALING HALTED

Friday January 31, 2014 – Melbourne, Australia — As of 1700 AEDT today, the Sea Shepherd Fleet has shut down the operations of the Japanese whaling fleet for seven consecutive days. The Sea Shepherd ships now guard the slipway of the Nisshin Maru, rendering the factory vessel unable to butcher and process whale meat. [Read more…] about Japanese Whale Harvest Halted by Activists Operating ‘Small Navy’?

Filed Under: News Tagged With: Whales

Open Thread

January 29, 2014 By jennifer

I’ve been asked to open a new thread. So, why not introduce a new topic? I really like goat’s cheese, and especially Meredith Dairy goat cheese. Meredith Dairy Goat Cheese
This is an unsolicited advertisement for one of my favourite foods.

Filed Under: Information

Bureau Confirms Calculating Australia’s ‘Average’ Temperature Involves Some Hocus-pocus

January 28, 2014 By jennifer

THE Australian Bureau of Meteorology, BOM, doesn’t have a set of temperature thermometers regularly positioned across the landmass of Australia from which it might derive an average annual temperature. Rather many more of it’s approximately 750 temperature recording stations are in south eastern Australia, some have records that date back to the 1850s, while others only started recording last year.
How do you derive an average annual temperature for Australia from such a mix of measurements? Screen Shot 2014-01-28 at 3.52.51 PM

The Bureau’s solution is to select a subset of about 112 stations from the 750. Some of the stations in the subset started recording temperatures in the 1850s, others not until the 1960s. Then the bureau truncates the longer temperature records, in some cases by discarding over 50 years of data, indeed everything before the somewhat arbitrary date of 1910. Data before this date is not considered reliable, but then the Bureau applies corrections to some of the rest of the data even though it should be reliable. Then the adjusted and truncated values from the subset are fitted to a grid to generate an area-weighted average of the data.

There is no single document that describes this methodology. Rather in a letter from the Bureau dated 24th January, responding to my request for information, I was directed to a mix of Bureau reports, peer-reviewed papers and also a PhD thesis by way of justification, methodology and for a list of stations.

In short, there is no straightforward way to verify the claim that last year, 2013, was the hottest calendar year on record. This is the claim the Bureau made in a media release on 3rd January 2014.

When individual stations with long temperature records are examined the late 1890 and 1930s appear to be as hot as recent years.

Ever since Climategate, deeply disturbing questions have been asked about the way climate science is conducted and also the state of the climate data. The Australian Bureau of Meteorology’s own databases feature in the leaked emails with the infamous ‘Harry Read Me’ file complaining about jumbled values and incorrect start dates for particular stations.

The mainstream climate science community has a vested interest in the average temperature for Australia increasing year-on-year because it has embraced the theory of anthropogenic global warming and invested heavily in research that assumes this theory.

It is time that the Bureau was more transparent in how it calculated its average annual values, and that it developed a method for benchmarking these annual average values. The benchmarking could be against satellite data and also against individual stations in Australia for which there are long temperature records.

**************

Click here to download the Bureau’s reply to my letter of 9th January requesting information to enable verification of the claim that 2013 was the hottest year on record.

Click on the image to see a chart of the Bureau’s annual mean temperature anomaly for Australia, this value is derived from the annual mean.

Filed Under: Information Tagged With: Temperatures

Shark Baiting Already a Reality in Queensland

January 25, 2014 By jennifer

THERE has been much commotion in the Australian media about the Western Australian government’s plans to introduce drum lines to cull an increasing shark population.

While the ABC has been interviewing experts from around the world about the potential impact of this program on shark populations, I’m yet to hear any mention of the current program that has been in place for decades now off the east coast of Australia.

Indeed just off Lammermoor Beach, near where I live some of the time in central Queensland, you can see yellow plastic floats. They are attached to chains with large hooks and fresh meat designed to lure and kill sharks. yellow float with text

The local paper proudly announces the kill at the end of each year. A total of 111 sharks were caught off the combined Capricorn Coast beaches of central Queensland in 2013. The breakdown is as follows:
43 bull whalers
23 long-nose whalers
18 tiger sharks
12 blacktip reef whalers
9 spot-tail whalers
3 great hammerheads
2 sandbar whalers
1 bronze whaler

I often walk along Lammermoor Beach but I don’t much swim there. I find the yellow plastic floats off-putting, along with the stingers, stingrays, and I worry about encountering a wandering crocodile. In fact very few people swim at Lammermoor beach so I wonder why they even bother with the baiting program?

The history of the Queensland program is detailed here:

“The Queensland (QLD) Shark Control Program was introduced to the Gold Coast, Sunshine Coast and Cairns in 1962 and was extended to include Townsville and Mackay in 1963. Since then, the Program has been extended to include Rockhampton (Capricorn Coast) (1969), Bundaberg (1973), Rainbow Beach (1974), Tannum Sands (1983) and Point Lookout (1984) (QLD DPI, 2003). There have been frequent changes to the location and configuration of shark control equipment (mesh nets and drum lines) within each of these areas since the Queensland Shark Control Program was implemented in 1962 (Anon, 1998). The most recent major change to the configuration of shark control equipment occurred in 1992 and 1993, following a review of the operation and maintenance of shark meshing equipment in Queensland (Anon, 1992). In 1992 and 1993, mesh nets were replaced with drum lines in many areas, in order to reduce the catch of non-target marine species, such as dugongs, dolphins and whales.

In Queensland, mesh nets and/or drum lines are currently used on 84 beaches, within 10 districts (known as contract areas). The Queensland Government reports that a total of 338 drum lines are deployed across the 10 contract areas and a total of 37 mesh nets are deployed across 5 contract areas (Cairns, Mackay, Rainbow Beach, Sunshine Coast and Gold Coast). Nets are replaced with drum lines during whale migration and turtle seasons in some areas (Anon, 1998). In Queensland, shark control equipment remains in the water the entire year round, except in Cairns and Rockhampton (Capricorn Coast) where equipment is seasonally removed (Anon,1998; Queensland Shark Control Program). Each piece of equipment used in the Shark Control Program is serviced every second day, weather permitting (QLD DPI, 2003). Regular servicing of equipment means that non-target marine species caught on shark control equipment are more likely to be released alive.”

***
Picture of Lammermoor beach with yellow float taken sometime over the last year.

Filed Under: Information Tagged With: Fishing

  • « Go to Previous Page
  • Go to page 1
  • Interim pages omitted …
  • Go to page 44
  • Go to page 45
  • Go to page 46
  • Go to page 47
  • Go to page 48
  • Interim pages omitted …
  • Go to page 607
  • Go to Next Page »

Primary Sidebar

Recent Comments

  • Ian Thomson on Vax-ed as Sick as Unvax-ed, Amongst My Friends
  • Dave Ross on Vax-ed as Sick as Unvax-ed, Amongst My Friends
  • Dave Ross on Vax-ed as Sick as Unvax-ed, Amongst My Friends
  • Alex on Incarceration Nation: Frightened of Ivermectin, and Dihydrogen monoxide
  • Wilhelm Grimm III on Incarceration Nation: Frightened of Ivermectin, and Dihydrogen monoxide

Subscribe For News Updates

  • This field is for validation purposes and should be left unchanged.

January 2026
M T W T F S S
 1234
567891011
12131415161718
19202122232425
262728293031  
« Jan    

Archives

Footer

About Me

Jennifer Marohasy Jennifer Marohasy BSc PhD has worked in industry and government. She is currently researching a novel technique for long-range weather forecasting funded by the B. Macfie Family Foundation. Read more

Subscribe For News Updates

Subscribe Me

Contact Me

To get in touch with Jennifer call 0418873222 or international call +61418873222.

Email: jennifermarohasy at gmail.com

Connect With Me

  • Facebook
  • LinkedIn
  • RSS
  • Twitter
  • YouTube

Copyright © 2014 - 2018 Jennifer Marohasy. All rights reserved. | Legal

Website by 46digital