• Skip to primary navigation
  • Skip to main content
  • Skip to primary sidebar
  • Skip to footer
Jennifer Marohasy

Jennifer Marohasy

a forum for the discussion of issues concerning the natural environment

  • Home
  • About
  • Publications
  • Speaker
  • Blog
  • Temperatures
  • Coral Reefs
  • Contact
  • Subscribe

Archives for February 2014

Temperature Variability by State and Over Recent Years: Comment from Bob F-J on 2013 Record

February 3, 2014 By jennifer

I HAVE already detailed my concerns with the claim by the Bureau of Meteorology that 2013 was the hottest year on record. Thank you for your many comments in the threads that followed the two blog posts. I am taking many of these comments into consideration in the development of a further set of questions.

In the meantime Bob Fernley-Jones, a retired engineer based in Melbourne, suggests that even if one accepts the truncating and adjusting that the Bureau has undertaken to arrive at the 2013 record annaul average temperature, given the actual temperature statistics published by the Bureau, David Jones was not justified in making the headline-grabbing statements that he did on January 3, in particular that there is a general warming trend and that it is Australia-wide.
Mr Fernley-Jones makes the following points, with the charts and supporting references available for download here:

1. One data point does not make a trend. There has been considerable variability over recent years in both the annual mean temperature anomaly and also the annual maximum temperature anomaly, Chart 1.

2. When regional variability is considered it is evident that only one state, South Australia, was signficiantly warmer in 2013, Chart 2.

3. The seasonal distribution of temperature is important, for instance warmer winters might arguably be a good thing for South Australia, while hotter summer are generally not. When the season mean temperatures for South Australia are considered for the period 1990 to 2013, the summer of 2013 was not particularly hot, Chart 3. In fact not a single season was hotter in 2013.

4. While much has been made of January 2013 being exceptionally hot, when the mean January temperature anomaly is plotted for South Australia back to 1910, Chart 4, it is apparent that 2013 was not an exceptionally hot January with hotter January’ occuring in the 1930s.

5. According the Bureau’s own time series data based on truncated and adjusted data series, mean January maximum temperatures have been flat since 1934 for the Northern Territory, and since 1947 for Queensland. New South Wales and the Australian Capital Territory have hotter January’s going back to 1938. South Australia, the hottest region for 2013, has eight hotter January’s going back to 1933. Tasmania has about 25 hotter January’s going back to 1917. Victoria has about 20 hotter January’s going back to 1939.

Mr Fernley-Jones’ critic can be read in more detail by downloading this document BobF-J_BlogVer2.

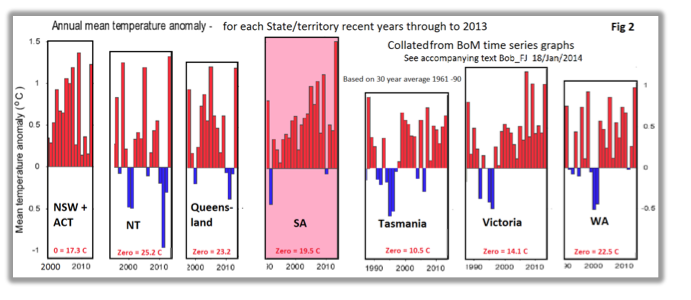
SA Hottest

Filed Under: Information Tagged With: Temperatures

Save Lady Elliot, Set AirCon to 25 Degrees

February 1, 2014 By jennifer

Dear Jennifer, I had a holiday on Lady Elliot Island in October 2013 and while there took the attached photos with the idea that I might send the one of the climate change sign to an Australian blog as an example of Federal Government alarmist propaganda.

Lately the tide seems to be turning against the CO2 global warming scam with the Akademik Shokalskiy debacle in the Antarctic, record polar sea ice totals, the circumpolar vortex in the northern hemisphere and Tom Switzer’s article in the Sydney Morning Herald. However with the heat waves lately in Australia the warmists are fighting back with the usual dodgy forecast heat records which are very seldom reached but most people don’t question them. I commend you for your open letter to the BOM requesting verification of the 2013 temperature record.Lady Elliot

I had another look at this photo of the sign today to work out again how much sea level rise they showed in the graph from 1990 to 2013 and it scaled about 300mm or 13.04mm/year. As another check I scaled the 600mm rise over 57.5 years and only got 10.43mm/year which seemed extremely odd, (I’m a retired land surveyor used to working with graphs).

On further inspection I finally noticed that the 5 year intervals on the x axis read 2010, 2015 then jumped 15 years to 2030 and back to 5 year intervals from 2035 to 2055 which explained the yearly rise difference. The sign writer obviously made a booboo or the original information he was given was wrong. Either way the error should have been corrected before the sign was released for public viewing. The nearest National Tide Centre Gauge at Rosslyn Bay shows a rise of about 2.8mm/year and has only operated since 1993 so the 13mm/year rise on the graph is ridiculous.

As the Great Barrier Reef is in your bailiwick I thought you might be interested in publicising the gross errors on this “way over the top” sign and I assume that a similar one is also on most of the other islands controlled by the GBR Marine Park Authority but you will probably be able to find this out easier than I can. The 03 in the top left corner may be its sign number.

Regards
Sel Hopley

Click on the image for a larger and better view of the entire photograph including the how to save the Island by setting your air con at 25 degrees celsius.

Filed Under: Information Tagged With: sea level change

  • « Go to Previous Page
  • Go to page 1
  • Go to page 2

Primary Sidebar

Recent Comments

  • Ian Thomson on Vax-ed as Sick as Unvax-ed, Amongst My Friends
  • Dave Ross on Vax-ed as Sick as Unvax-ed, Amongst My Friends
  • Dave Ross on Vax-ed as Sick as Unvax-ed, Amongst My Friends
  • Alex on Incarceration Nation: Frightened of Ivermectin, and Dihydrogen monoxide
  • Wilhelm Grimm III on Incarceration Nation: Frightened of Ivermectin, and Dihydrogen monoxide

Subscribe For News Updates

  • This field is for validation purposes and should be left unchanged.

February 2014
M T W T F S S
 12
3456789
10111213141516
17181920212223
2425262728  
« Jan   Mar »

Archives

Footer

About Me

Jennifer Marohasy Jennifer Marohasy BSc PhD has worked in industry and government. She is currently researching a novel technique for long-range weather forecasting funded by the B. Macfie Family Foundation. Read more

Subscribe For News Updates

Subscribe Me

Contact Me

To get in touch with Jennifer call 0418873222 or international call +61418873222.

Email: jennifermarohasy at gmail.com

Connect With Me

  • Facebook
  • LinkedIn
  • RSS
  • Twitter
  • YouTube

Copyright © 2014 - 2018 Jennifer Marohasy. All rights reserved. | Legal

Website by 46digital