• Skip to primary navigation
  • Skip to main content
  • Skip to primary sidebar
  • Skip to footer
Jennifer Marohasy

Jennifer Marohasy

a forum for the discussion of issues concerning the natural environment

  • Home
  • About
  • Publications
  • Speaker
  • Blog
  • Temperatures
  • Coral Reefs
  • Contact
  • Subscribe

Temperatures

Go Boldly and Smash all Preconceptions: Steve Goddard

September 4, 2014 By jennifer

WE all have heroes. British biologist Thomas Henry Huxley (1825-1895) is one of mine. The contemporary of Charles Darwin wrote: “Sit down before facts as a little child, be prepared to give up every conceived notion, follow humbly wherever and whatever abysses nature leads, or you will learn nothing.”

I have done this for many temperature series: especially maximum temperature series and for many different localities around Australia, even the Bathurst jail because it has an exceptionally long record beginning in 1857. I have also trawled through some archives boxes, and wished I had time to examine more.

I have slowly developed a picture in my mind of what an amalgamation of all the records might look like. I like to develop my ideas slowly and from the bottom-up. I like detail and am often convinced, until I double check again, that I might have got something wrong.

Then along comes well-known American cyclist, blogger, geologist and electrical engineer, oh and also sceptic, Steve Goddard aka Tony Heller. He announced on Twitter a couple of days ago: I am bored with US temperatures, and have turned my attention to climate fraud in Oz.

He starts with a few odd charts at his Twitter feed. I provided some feed back and then he posts ‘Australian Afternoons Used to Be Much Hotter’. The title and the chart excited me like only an entomologist can get excited when someone has suddenly completed the collection for them.

The chart is as I imaged the maximum temperature trends for, at least eastern Australia, would look like after all my station data was amalgamated. Steve’s methodology is very straightforward: There are 1,655 Australian stations in the GHCN (Global Historical Climatology Network) database that include temperature data. The database is located here: ftp://ftp.ncdc.noaa.gov/pub/data/ghcn/daily/all/. The station list is at bottom. The database includes maximum temperatures. He averages the daily data for each month at each station over the lifespan of the station to generate a monthly mean, and then calculates anomalies from the monthly mean. The numbers in his charts are the average anomaly across all stations for all records during a year.

Screen Shot 2014-09-04 at 9.40.01 PM

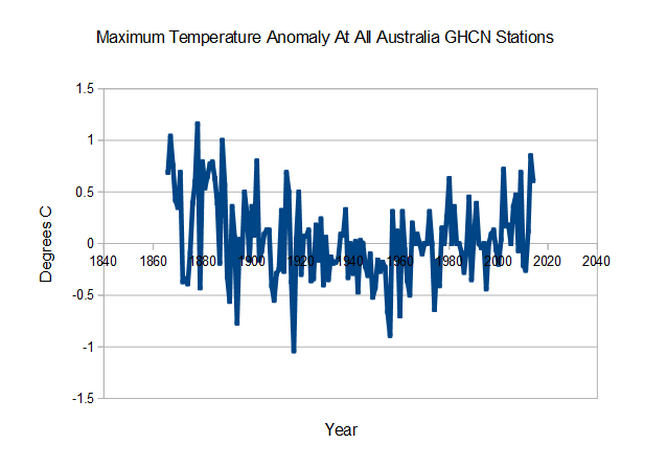
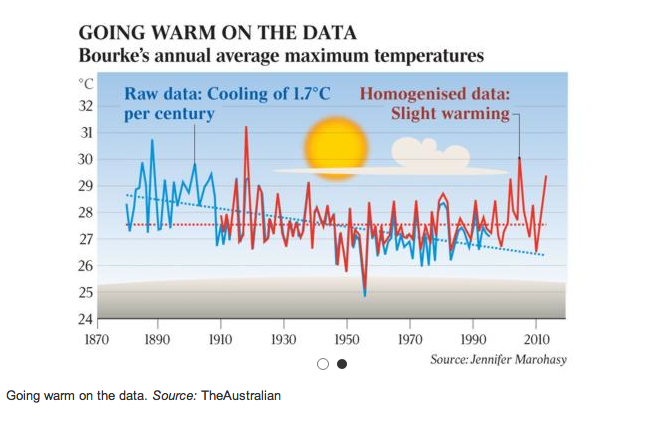
What Steve’s chart shows is that it was much hotter in the late 1800s, than at any time since and by a significant margin. He has suggested that 1878 is the hottest year on record. Coincidentally my scrutiny of data from the Bathurst jail weather station had already turned-up the hottest day in that record as being January 12, 1878.

There is a cooling trend to about 1960, and then temperatures start to warm again. But they never reach the highs of the late 1800s and early 20th Century.

Ten years ago, when I started this blog, my daughter wanted to be the first to leave a comment and she wrote: “Do not go where the path may lead, go instead where there is no path, and leave a trail.” Ralph Waldo Emerson.

Steve Goddard has just done this with the Australian temperature record. He has gone where no-one has dared go before. Thank you, Steve.

Filed Under: Information, Opinion Tagged With: Temperatures

Rutherglen: Still Looking for Answers

September 3, 2014 By jennifer

A CENTRAL thesis of global warming is that temperatures will keep going up, and up. They did from about 1960 to 2002 at many places around Australia, but not at all of them. At Ruthergen, a wine-growing region of north-eastern Victoria, temperatures have been fairly steady since a Stevenson screen was erected and temperatures first recorded back in November 1912.

Dr Bill Johnston asks other climate scientists to consider the evidence for Rutherglen

The Bureau of Meteorology includes Rutherglen in a network of stations that it uses to report on regional and national temperatures. But it doesn’t report on the temperature values as recorded at Rutherglen. It first remodels them. Through this process the mean annual minium temperature trend is changed from cooling of 0.35 degree celsius per century to warming of 1.73 degree celsius per century. That’s a pretty large change in both magnitude and direction.

Since this was first reported in The Australian by Graham Lloyd there have been accusations that people like myself are into conspiracy theories, and more. But we really would just like some answers.

No one is more curious than Bill Johnston. He is disappointed that Andy Pitman and other Australian climate experts seem to be avoiding discussion of the temperature data for Rutherglen. Out of curiosity, and also in an attempt to generate some scientific interest amongst his collegues, Dr Johnston has undertaken the following analysis. It’s a bit technical. But hopefully not too technical for the experts.

Rutherglen – A brief overview by Bill Johnston

I examined the data graphically using a CuSum curve (cumulated deviations from the grand mean). There were 4 turning points, in 1923, 1957, 1964 and 1975. Two of those could have been independently-documented climate shifts (~1923 and ~1975).

I analysed the annual minimum temperature data, down-loaded from BoM using shift-detection software (CPA from variation.com) and sequential t-tests (STARS) (see: http://www.beringclimate.noaa.gov/regimes/rodionov_var.pdf) allowing for autocorrelation; and assuming all data were in-range (Huber’s H = 5).

Rutherglen Bill

CPA, which is based on bootstrapping, is not so good, when there are numerous changepoints. However, it detected shifts in 1924 and 1937 (P = 99% and 82% respectively). I did not follow-through fine-tuning the methodology, as I’d normally do to ensure no additional steps.

STARS detected regime changes in 1924 (P = 0.0007), 1958 (P = 6.07E-06) and 1965 P = 3.85E-06). This was inconsistent with the published metadata. The ACORN catalogue mentions no station moves. The steps were not documented climate-change years.

STARS settings are indicated on the graphic, so anyone can obtain the STARS Excel add-in, and data and re-do the analysis and check my interpretation. (Years indicated are start-years for the new regime.)

Of the step-changes, the 1965 shift was the most influential. Ignoring the intervening ‘hump’ the difference in mean level between 1957 and 1965 was 0.06 degree C.

Because it occurs in the middle of the dataset, such a step change could be trend-determining. If the hump alone was deducted, by shifting the data down by the difference, the 1965 shift may not be detectable. Trend however, would be little altered, and would still be no different to zero-trend.
The hump could have been a data-fill; a temporary move or a change in screen-aspect or instruments; but that is all a guess.

The shift down in 1924 of 0.77 degree C is consistent with a possible station move. However, based on Metadata, no such move happened, which was the point made by Jennifer Marohasy, which in-turn was based on the best information available from the BoM ACORN catalogue.

If we go back to BoM’s climate data on line, there was a post office record (082038; 1903-1925) as well as a viticulture research record (082085; 1903-1927). I’ve not compared these, but at an annual scale, they should behave in parallel (same trend, different intercepts).

(A graphical way of checking is to difference the datasets, and cumulatively sum the result, to see if the CuSum of the difference goes ‘off-line”. (Add a to b, then the answer, to c and so on – it takes 2 calculation columns, one for the difference, the other for the CuSum, and data needs to be closed-up on missing pairs). I think visual comparisons; using line-graphs are difficult to interpret. (Also some people have trouble with discerning colours.) Comparing regression lines may also introduce the possibility of spurious trends in either or both of the datasets being compared.

It so happens that in my research collaboration days, our team met time-about in the historic and interesting viticulture laboratory, which became a meeting room within the Rutherglen Research complex.
It seems likely that, in order to produce the long ACORN record; between 1924 and 1927, the viticulture record was merged with the Rutherglen Research record, and that BoM ignored or did not detect that particular stitch.

It could also have been an inadvertent error; the sort of thing that happens when someplace morphs into something else. (It could have been done locally for example.) (I don’t know when Rutherglen became an agricultural research centre.)

Irrespective of all the argy-bargy, the important points are:

1. The truth is in the data, not necessarily the metadata.

2. Without leaving Excel, small (less than 1 degree C) enduring shifts in the mean level of a data-stream, typical of undocumented changes, can be detected. However, for any time-series iterative testing using contrasting tests, and interpretive skill is required (at the 95% level there is a 5% chance of NOT detecting a shift that is real).

3. Most importantly, in the case of Rutherglen (and Deniliquin; RAAF Amberley; Longreach; Nobbys Head, Moruya PS and elsewhere) when abrupt-shifts are allowed for (deducted sign-intact), it is often the case residual trends are not different to zero-trend. (It can also be the case that the data are useless; Eucla may be in that category!)

In other words, for many places, naïve mean-squares trends may be spurious. They are due to shifts either in the measurements or in the climate.

In Rutherglen’s case, trend between 1924 and 1957 (34 years), and between 1958 and 2013 (49 years) were no different to (bootstrapped) zero trend (P <0.05). (Least squares trends were 0.007 and –0.003 oC/yr.) This further supports the view that we have a non-trending data stream, containing a small step. According to CPA and STARS there were no significant (P <0.05) changes in variability. With all step-changes removed, there was no trend. There are four important lessons. 1. Graphical and statistical evaluation on a site-by-site basis is essential before any inter-station comparisons, or inter-station homogenizations are undertaken. This is formally called exploratory data analysis (EDA). My endless analysis of data leads me to conclude that many series are not fit-for-purpose; or that it is simply not possible to detect valid trends against background noise. (Valid trends are trends ex-steps. For least-squares regression to be valid, data MUST be homogeneous.) 2. There can be changes within data that are undocumented (like Rutherglen and Amberley); likewise there can be documented changes that don’t result in data inhomogeneties (Eucla possibly being a case in point). 3. It is inappropriate for the Bureau having made a mistake in respect of supporting comments made by Professor David Karoly, who has a long history of being biased; to pull in heavy artillery from another, potentially equally-biased UNSW group, in an attempt to reclaim the high-ground. 4. There is an answer. I’ve put forward a transparent approach. Having said that I’m quite willing to be proved wrong at the statistical confidence level of P =0.05. The situation has become a bit absurd.

The Bureau needs to show unambiguously ‘true’ or ‘real’ uncontestable positive trends in minimum temperature data that don’t rely on their homogenisation procedures.

It is really that simple.

If BoM cannot do that, they have lost the statistical debate and need to fess-up or develop yet another trend-setting dataset.

Cheers,
Dr Bill Johnston
Former NSW Natural Resources Research Scientist

Note that I am a data analyst, not an expert mathematical statistician. I would not be regarded as an expert in the sense of arguing a statistical case with BoM, for example. That does not invalidate my analysis; it is simply a disclaimer. And if you want disclaimers, look no further than most BoM reports.

Filed Under: Information Tagged With: Temperatures

So much Conversation, so little evidence

September 2, 2014 By jennifer

I’VE never meet Jo Nova in person. But she can write a good headline, and she cares about the truth. Her blog has never received any government funding, but it includes a lot of interesting facts and evidence on science-related topics.

Jo Nova in conversation.  But not at the public's expense.
Jo Nova in conversation. But not at the public’s expense.

Meanwhile ‘The Conversation’ is a government-funded blog for university researchers that got $6 million dollars just a couple of years ago to employee staff to spout opinion.

Yesterday The Conversation was, as always, short on evidence, but its government-funded scribes could vouch for the Bureau of Meteorology. In particular, Andy Pitman and Lisa Alexander, both part of the global warming industry, authored a long piece about how you should trust them and the Bureau. But the discerning reader might be left wondering why?

Because, as Jo Nova explains at her blog today, they didn’t actually explain how and why it was necessary to change a cooling trend at Rutherglen into a warming trend.

Meanwhile, I’ve been reading a peer-reviewed paper by Blair Trewin, which details how the homogenisation technique employed by the Bureau is meant to work. The only problem is, the methodology as detailed in this paper published in the International Journal of Climatology (Volume 33, Pages 1510-1529) doesn’t actually seem to accord with the methodology as implemented by Dr Trewin at the Bureau of Meteorology. What I mean is, the peer-reviewed paper says one thing, but the output from the homogenisation technique shown in the ACORN-SAT reconstructions suggests something entirely different.

Something that is worth noting in the paper, is comment from Dr Trewin that, “but negative adjustments are somewhat more numerous for minimum temperatures, which is likely to result in ACORN-SAT minimum temperatures showing a stronger warming trend than the raw data do.” What he is saying, in plain English, is that ACORN-SAT may exaggerate the warming trend somewhat as a consequence of artificially dropping down the minimum temperatures. In fact, as I explained with reference to the Rutherglen temperature trends, the Bureau progressively drops down the minimum values from 1973 back through to 1913. For the year 1913 the difference between the raw temperature and the ACORN-SAT temperature is a massive 1.8 degree C.

The apologists, Pitman and Alexander, in their conversation suggest that, “the warming trend across Australia looks bigger when you don’t homogenise the data than when you do”. But this is not what the peer-reviewed literature says. And yet the take home message from their article is believe only this same peer-reviewed literature.

****
More on Rutherglen, Pitman and Alexander in today’s The Australian.

Filed Under: Information, Opinion Tagged With: Temperatures

Weatherman’s records detail heat that ‘didn’t happen’: Graham Lloyd

August 30, 2014 By jennifer

THE famous Australian poet Henry Lawson wrote, “If you know Bourke you know Australia.” For me Henry Lawson was alluding to the vastness of the landscape, the extremes of climate, and also the can-do attitude of its people.

Ian Cole and Jennifer Marohasy, both mentioned in today's story by Graham Lloyd.
Ian Cole and Jennifer Marohasy, both mentioned in today’s story by Graham Lloyd.

But the technocrats would like to change some of this, and pretend that Australia’s climate was once benign.

So, as Graham Lloyd explains on page 5 of today’s Weekend Australian, the Australian Bureau of Meteorology have discarded the first 40 years of the temperature record for Bourke. This includes the hottest ever temperature recorded in a Stevenson screen for, I think, anywhere in Australia. A rather hot 51.7 degree Celsius was recorded in a new Stevenson screen in the yard of the Bourke post office on 3rd January 1909.

Mr Lloyd writes:

THESE Bourke records have assumed a new significance in light of concerns about how historic data is being treated at many sites around the country. The records are also important in an ongoing row that frustrates Mr Cole. The Bourke cotton farmer may be managing director of the local radio station 2WEB but Mr Cole can only broadcast temperature records that date back to 2000 because the Bureau of Meteorology won’t supply historic records to service provider Weatherzone.

As a result “hottest day on record” doesn’t really mean what it seems. “We keep on being told about records that are not actually records and averages that are not quite right,” Mr Cole said.

Worse still there are concerns about what has happened to the precision of those handwritten records in the earlier years. Bourke now forms part of a network of weather stations used to make up the national record known as ACORN-SAT. The raw temperature records are “homogenised”, a method BOM says has been peer-reviewed as world’s best practice and is used by equivalent meteorological organisations across the world.

Independent research, the results of which have not been disputed by BOM, has shown that, after homogenisation, a 0.53C warming in the minimum temperature trend has been increased to a 1.64C warming trend. A 1.7C cooling trend in the maximum temperature series in the raw data for Bourke has been changed to a slight warming.

BOM has rejected any suggestion that it has tampered inappropriately with the numbers. It says the major adjustment to Bourke temperatures relate to “site moves in 1994, 1999 and 1938 as well as 1950s in homogeneities that were detected by neighbour comparison which, based on station photos before and after, may relate to changes in vegetation around the site”.

Queensland researcher Jennifer Marohasy, who has analysed the Bourke records, says BOM’s analysis is all very well but the largest adjustments, both to maximum temperature series, occurred in the period 1911 and 1915 with a step down of about 0.7C, followed by a step-up between 1951 and 1953 of about 0.45C. Of greater concern to Dr Marohasy is that historic high temperatures, such as the record 51.7C recorded on January 3, 1909, were removed from the record on the assumption it was a clerical error. In fact, all the data for Bourke for 40 years before 1910 has been discarded from the official record. If it were there, says Dr Marohasy, the record would show that temperatures were particularly hot during that period.

For Mr Cole it is a simple matter of trusting the care and attention of his father. “Why should you change manually created records?”

Two different temperature records for Bourke!

_____________________

From another great story in The Weekend Australian newspaper, buy the paper and turn to page 5, or get an online subscription.

If you would like to hear about how old weather records are changed at other sites, here’s a 7 minute podcast from Melbourne radio station 3AW. I’m being interviewed by Tom Elliott.

Filed Under: Information Tagged With: Temperatures

The ABC of Rutherglen

August 28, 2014 By jennifer

IF global warming is the greatest moral issue of our time, then the truth really does matter. But this morning, I felt that I had been shut outside, or at least cut-off, without having a chance to tell the whole story.

Jennifer Marohasy feeling left out.

Bronwen O’Shea the host of an ABC radio program for the Goulburn Murray, a region that includes the town of Rutherglen, was interviewing me.

Bronwen invited me on to her program, and also someone from the Australian Bureau of Meteorology to discuss the temperature record for Rutherglen. The Bureau declined.

Bronwen began the interview by suggesting that Bureau have only tweaked the figures for Rutherglen. I disagreed. I explained that the Bureau has actually completely trashed the temperature record by changing what had been a slight cooling trend into warming of 1.73 degree C for the last 100 years.

I also explained that this had been achieved by progressively dropping down the original temperatures from 1973. I wanted to explain that the largest change was back in 1913, with the difference between the actual recorded temperature, and the new official temperature a massive 1.8 degree C.

I was cut-off, before I got to explain too much.

I waited, assuming the line had dropped out. But after no one phoned me back I rang back myself. I phoned ABC Goulburn Murray and was put on hold. Guess whom Bronwen was now interviewing?

Answer: the infamous John Cook, a faux sceptic from the University of Queensland.

    Answer: Someone who mentioned the blog site ‘Sceptical science’ and who I assumed was John Cook.**

Mr Cook

    This person

was telling Bronwen that the temperature record for Rutherglen had to be corrected because it was different from everywhere else.

But that is just not true. I haven’t looked at all the weather stations for Victoria. But I have looked at trends for all the stations with long continuous records for the state of New South Wales, which is just across the Murray River from Rutherglen.

Most of the inland records show a very similar trend to Rutherglen. In fact, if we consider the raw data for Deniliquin from 1913 through until the end of the record in 2003 we see a similar pattern of cooling.

Deniliquin is not some random choice of my own. It is listed in the Bureau’s official station catalogue as being one of three nearest sites to Rutherglen, the other two sites listed are Wagga Wagga and Cabramurra. I will look at the data for these locations in due course.

As detailed in my recent paper to the Sydney Institute: after considering all the locations in New South Wales where there are long continuous temperature records available, I have calculated that the net temperature change for New South Wales shows cooling of 0.021 degree per century. That is the net change for the entire state.

In contrast the BOM claims for NSW that there has been a 1 degree C per century warming.

Before I start doing the calculations for all of Victoria, I suggest you get the complete picture for Rutherglen.

To this end I’ve just created a dedicated page for Rutherglen and dedicated it to a real trooper and truth seeker, Judy Ryan.

Here’s the page…

https://jennifermarohasy.com.dev.internet-thinking.com.au/temperatures/rutherglen/

Now. Before anyone makes comment at this thread, could I suggest they at least scan the information as provided… sort of the ABC of Rutherglen that I wasn’t quite able to communicate this morning on the ABC.

* I have been contacted at my Twitter account to say that it was not John Cook. He apparently even has an alibi. So, sorry for misleading anyone. After I phoned back I was put on hold, and could hear Bronwen talking with someone. I wondered who that was. I heard them recommend the website Sceptical Science and assumed, it now appears incorrectly, that it was John Cook.

—————
Photograph by Lyndon Mechielsen.

Filed Under: Humour, Information, Opinion Tagged With: Temperatures

Who’s going to be sacked for making-up global warming at Rutherglen?

August 27, 2014 By jennifer

HEADS need to start rolling at the Australian Bureau of Meteorology. The senior management have tried to cover-up serious tampering that has occurred with the temperatures at an experimental farm near Rutherglen in Victoria. Retired scientist Dr Bill Johnston used to run experiments there. He, and many others, can vouch for the fact that the weather station at Rutherglen, providing data to the Bureau of Meteorology since November 1912, has never been moved.

Senior management at the Bureau are claiming the weather station could have been moved in 1966 and/or 1974 and that this could be a justification for artificially dropping the temperatures by 1.8 degree Celsius back in 1913.

Surely its time for heads to roll!

The temperature record at Rutherglen has been corrupted by managers at the Australian Bureau of Meteorology.


Some background: Near Rutherglen, a small town in a wine-growing region of NE Victoria, temperatures have been measured at a research station since November 1912. There are no documented site moves. An automatic weather station was installed on 29th January 1998.

Temperatures measured at the weather station form part of the ACORN-SAT network, so the information from this station is checked for discontinuities before inclusion into the official record that is used to calculate temperature trends for Victoria, Australia, and also the United Nation’s Intergovernmental Panel on Climate Change (IPCC).

The unhomogenized/raw mean annual minimum temperature trend for Rutherglen for the 100-year period from January 1913 through to December 2013 shows a slight cooling trend of 0.35 degree C per 100 years. After homogenization there is a warming trend of 1.73 degree C per 100 years. This warming trend is essentially achieved by progressively dropping down the temperatures from 1973 back through to 1913. For the year of 1913 the difference between the raw temperature and the ACORN-SAT temperature is a massive 1.8 degree C.

There is absolutely no justification for doing this.

This cooling of past temperatures is a new trick* that the mainstream climate science community has endorsed over recent years to ensure next year is always hotter than last year – at least for Australia.

There is an extensive literature that provides reasons why homogenization is sometimes necessary, for example, to create continuous records when weather stations move locations within the same general area i.e. from a post office to an airport. But the way the method has been implemented at Rutherglen is not consistent with the original principle which is that changes should only be made to correct for non-climatic factors.

In the case of Rutherglen the Bureau has just let the algorithms keep jumping down the temperatures from 1973. To repeat the biggest change between the raw and the new values is in 1913 when the temperature has been jumped down a massive 1.8 degree C.

In doing this homogenization a warming trend is created when none previously existed.

The Bureau has tried to justify all of this to Graham Lloyd at The Australian newspaper by stating that there must have been a site move, its flagging the years 1966 and 1974. But the biggest adjustment was made in 1913! In fact as Bill Johnston explains in today’s newspaper, the site never has moved.

Surely someone should be sacked for this blatant corruption of what was a perfectly good temperature record.

———-

Climate records contradict Bureau of Meteorology by Graham Lloyd, 27th August
http://www.theaustralian.com.au/national-affairs/climate/climate-records-contradict-bureau-of-meteorology/story-e6frg6xf-1227037936046

The story is behind a paywall. But if you don’t already have a subscription perhaps its time… this could just be the biggest story of the year.

** There are a lot of tricks that climate science managers have implemented over the years to fix the temperature record; that is fix it so it shows global warming. “Trick” was the word Phil Jones, a leading United Nation’s Intergovernmental Panel on Climate Change (IPCC) scientist, used to explain to his peers that, when constructing very long global temperature series using proxy data based on tree ring measurements that can extend back thousands of years, it was best to substitute thermometer data for this proxy data from about 1960 because the proxy data started to show cooling from about then. Indeed from about 1960 until 2002 the thermometer data mostly did show warming. But now even this instrumental record is starting to show cooling. Enter the relatively new trick of homogenization.

Filed Under: Information Tagged With: Temperatures

  • « Go to Previous Page
  • Go to page 1
  • Interim pages omitted …
  • Go to page 7
  • Go to page 8
  • Go to page 9
  • Go to page 10
  • Go to page 11
  • Interim pages omitted …
  • Go to page 13
  • Go to Next Page »

Primary Sidebar

Recent Comments

  • Ian Thomson on Vax-ed as Sick as Unvax-ed, Amongst My Friends
  • Dave Ross on Vax-ed as Sick as Unvax-ed, Amongst My Friends
  • Dave Ross on Vax-ed as Sick as Unvax-ed, Amongst My Friends
  • Alex on Incarceration Nation: Frightened of Ivermectin, and Dihydrogen monoxide
  • Wilhelm Grimm III on Incarceration Nation: Frightened of Ivermectin, and Dihydrogen monoxide

Subscribe For News Updates

  • This field is for validation purposes and should be left unchanged.

December 2025
M T W T F S S
1234567
891011121314
15161718192021
22232425262728
293031  
« Jan    

Archives

Footer

About Me

Jennifer Marohasy 
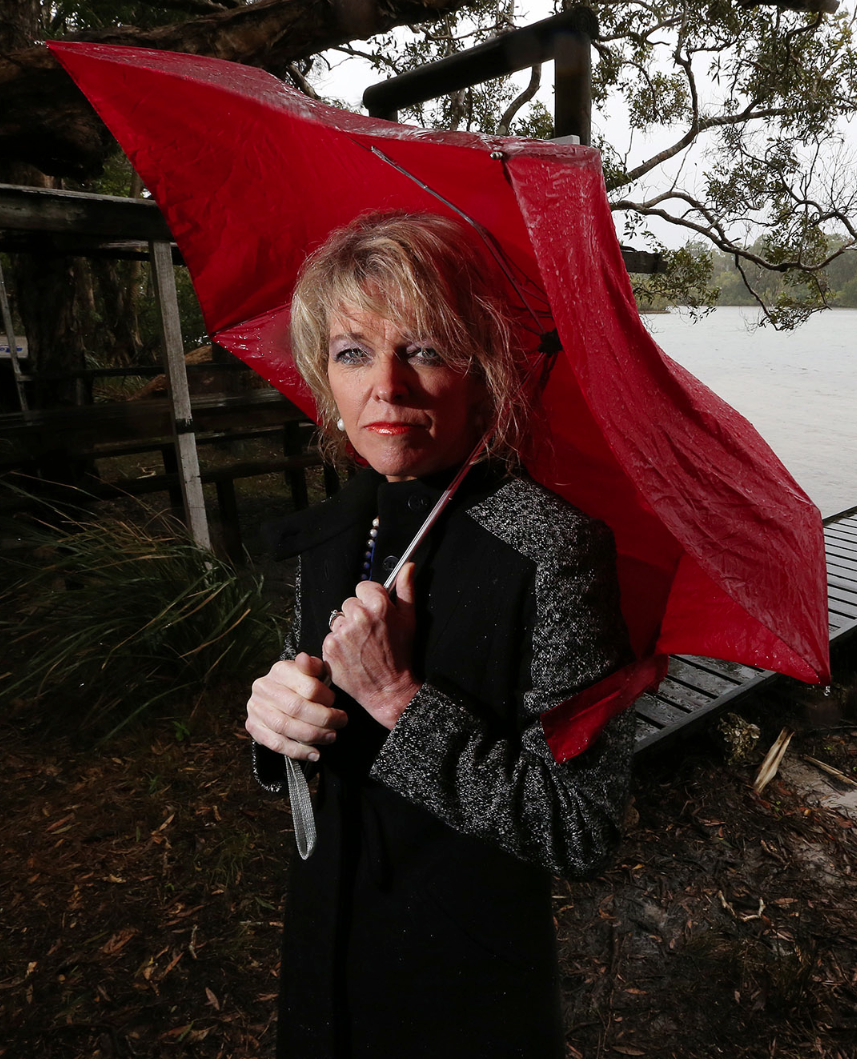
Jennifer Marohasy BSc PhD has worked in industry and government. She is currently researching a novel technique for long-range weather forecasting funded by the B. Macfie Family Foundation. Read more

Subscribe For News Updates

Subscribe Me

Contact Me

To get in touch with Jennifer call 0418873222 or international call +61418873222.

Email: jennifermarohasy at gmail.com

Connect With Me

  • Facebook
  • LinkedIn
  • RSS
  • Twitter
  • YouTube

Copyright © 2014 - 2018 Jennifer Marohasy. All rights reserved. | Legal

Website by 46digital