• Skip to primary navigation
  • Skip to main content
  • Skip to primary sidebar
  • Skip to footer
Jennifer Marohasy

Jennifer Marohasy

a forum for the discussion of issues concerning the natural environment

  • Home
  • About
  • Publications
  • Speaker
  • Blog
  • Temperatures
  • Coral Reefs
  • Contact
  • Subscribe

Temperatures

Sydney Morning Herald not balanced, not fair, not factual

September 28, 2014 By jennifer

ON 10th September 2014, the Sydney Morning Herald published an article suggesting that I was an amateur, hostile to climate science and in denial. When I attempted to respond by way of an opinion piece, I was told there was no space. That I would not be published. Jen rain

I’ve just lodged a complaint with the Australian Press Council. They only allow 400 words by way of ‘reason for complaint’. I’ve provided the following reasoning:

Michael Brown’s article ‘Pseudoscience and nonsense reign once science is left behind in climate debate’, published by the Sydney Morning Herald on 10th September 2014, is in breach of the Australian Press Council’s General Principles 1 and 3. In refusing to provide Jennifer Marohasy with an opportunity for reply The SMH is in breach of Principle 4.

There are four key errors of fact that combine to mislead the reader. Dr Brown claims Dr Marohasy has found “a few potential errors” in the homogenisation process as implemented by the Bureau. In fact Dr Marohasy has shown that the homogenisation process as implemented by the Australian Bureau of Meteorology is flawed because it can result in changes to both the direction and magnitude of temperature trends. Dr Brown claims Dr Marohasy has cherry-picked a few unrepresentative examples. The examples provided by Dr Marohasy are real, valid, and illustrate the potential impact of homogenisation, which is to mislead the public on climate change. Dr Brown claims that Australia continues to warm and the warming temperature trend is clear in raw and homogenised data for 100 years. In fact Australian and global average surface air temperature has remained more or less steady since 2001 (e.g. Nature Climate Change, volume 4, pages 222-227).

Dr Brown describes Jennifer Marohasy as a “plucky amateur”. Dr Marohasy is not an amateur. Indeed Dr Brown has also omitted key facts in particular that Dr Marohasy is an adjunct research fellow at Central Queensland University with several recent peer-reviewed publications in climate science.

Dr Marohasy submitted an opinion piece correcting some key errors of fact on 15th September 2014. On 16th September she was advised that it would not be published.

In publishing Dr Brown’s opinion, but refusing to publish Dr Marohasy’s rebuttal, the Sydney Morning Herald is continuing to withhold important information from the Australian public, in particular most Australians remain ignorant of the fact that all the data used to calculate national temperature trends is homogenised, that this can have an impact on both the magnitude and direction of temperature trends. Furthermore in publishing an article that suggests Dr Marohasy is “hostile” to climate science, practices “pseudoscience”, is in “denial”, and performs “sloppy” work, the Sydney Morning Herald is not only misleading its readers, but also defaming Dr Marohasy.

I would have thought that in the interests of balance, fairness and keeping their readership across the issue that the Herald could have simply published the opinion piece that I submitted. This article follows:

Evidence and transparency is important in science

If some technocrats had their way, it would be accepted practice to routinely alter historical temperature records, particularly if those records did not accord with global warming theory.

I have complained for some time about the practice of homogenisation undertaken by the Australian Bureau of Meteorology. My concerns were mostly ignored until I gave a lecture at the Sydney Institute in July. There, I described how cooling trends at RAAF Base Amberley in Queensland and the post office at Bourke in New South Wales have been changed into warming trends through homogenisation.

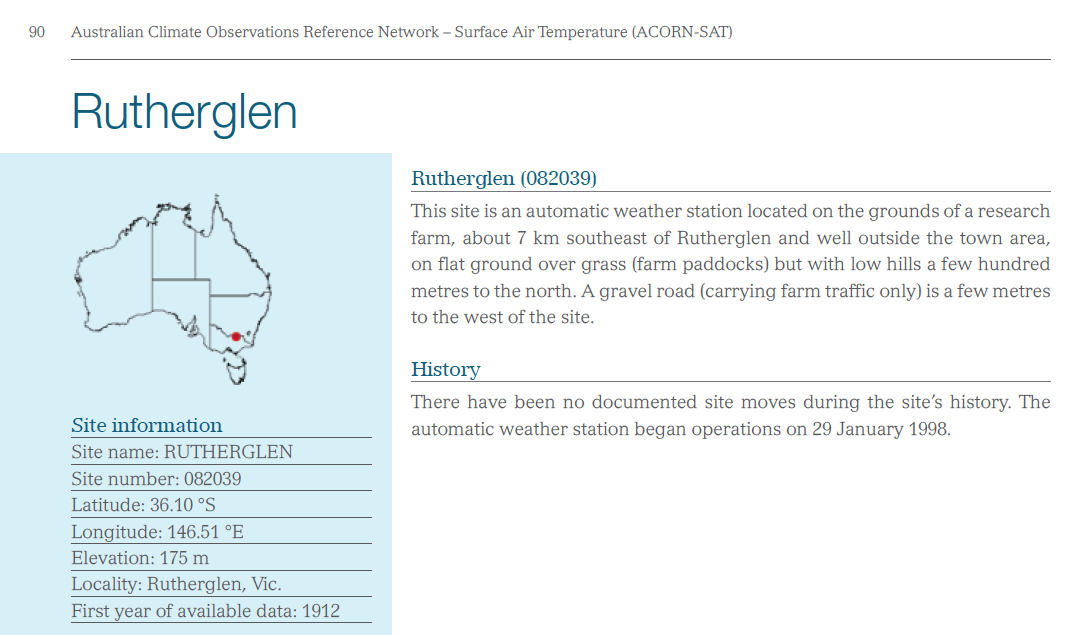
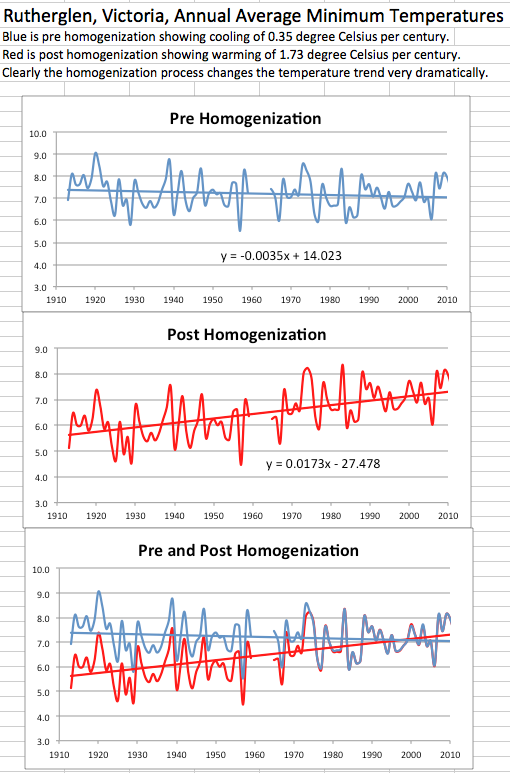
More recently, I provided The Australian with an example from an agricultural research station outside Rutherglen in north-eastern Victoria. Since 1912, a weather station there has observed an overall cooling trend. Rather than incorporate this cooling into the official record, the Bureau has applied algorithms that have flipped the cooling trend of 0.35 degrees Celsius into a warming trend of 1.73 degrees Celsius.

Homogenisation may legitimately be used in climate science to correct for anomalies in data when stations are relocated from one site to another. The Bureau claims that the Rutherglen station was moved in the 1960s or 1970s. Yet there is no evidence to suggest it was ever moved. Even if it were so, this does not explain why the record for, say, 1913 is a full 1.8 degrees Celsius cooler in the modified and homogenised data than in the original.

The overall effect of manmade global warming is estimated to be 0.8 degrees Celsius over the last century. If so, homogenisation has the potential to create a highly distorted impression of temperature trends.

That is only the start. When the entire instrumental record is considered, the very hottest years in Australia occurred in the late 1800s. Indeed the hottest year on record is perhaps 1878, and the hottest January was in 1896. This is not what we have been conditioned to believe, but it is what the data shows. The Sydney Morning Herald itself documented the heatwave of January 1896, reporting on the mass evacuation of affected residents by train from inland regions.

The Bureau believes that data prior to 1910 is unreliable for the purposes of the national record. The same Bureau, however, is happy to use that data for reporting global temperatures.

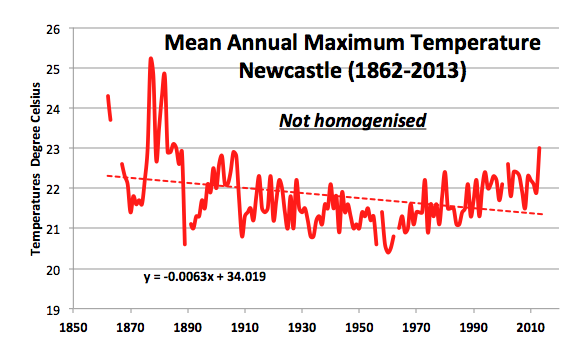
If we take those early records into account, it is clear that New South Wales experienced cooling from the late 1800s to about 1960. After 1960, temperatures across the state and the nation started to increase. This warming continued until it reached a plateau in 2002. Because the warming of the late twentieth century never completely negated the cooling of the early twentieth century, the overall net trend is actually one of cooling.

Peer-reviewed literature supports my contention that early twentieth century cooling was real and significant and that homogenisation creates an artificial warming trend in the official temperature record for Australia.

Yet last Wednesday in the opinion pages of the Sydney Morning Herald (Pseudoscience and nonsense reign once science is left behind in climate debate) Michael Brown, an astronomer from Monash University, argued that I had found merely “a few potential errors” in the data “while ignoring the fact that warming across Australia is seen in both raw and homogenised data”.

I have always been of the opinion that anyone who doesn’t take truth seriously in small matters cannot be trusted in large ones either. Insisting on precision and transparency is not, as Dr Brown suggests, quackery, pseudoscience or “plucky amateurism”. It is the very essence of scientific method.

Unfortunately, we have reached a stage where consensus is driving the science, rather than science shaping the consensus.

It is often said that global warming is the greatest moral issue of our times. If so, the truth surely matters. Upholding the truth means respecting dissent. It requires careful and public scrutiny of information which does not conform to received wisdom.

____________________________

Dr Jennifer Marohasy is an Adjunct Research Fellow at Central Queensland University with six recent peer-reviewed publications in climate science focused on the application of artificial intelligence to rainfall forecasting. This research required Dr Marohasy to compile long temperature series for different locations as arrays for a neural network model, in the process she became interested in the methodology used by the Bureau of Meteorology in the compilation of an annual average temperature for Australia.

Sources, if required, for para beginning “The peer-reviewed literature”:
Deacon, E.L. 1952, Climatic Change in Australia since 1880, Australian Journal of Physics, Volume 6, Pages 209-218, see especially Figure 1 showing the ten-year running averages of mean summer maximum temperature for Bourke, Alice Springs Narrabri and Hay)

Trewin, B. 2013, A daily homogenized temperature data set for Australia, International Journal of Climatology, Volume 33, see especially page 1524)

Source, if required for para beginning “That is only the start”:

‘Excursion to Cool Climates’, January 25, 1896 and Extraordinary Heat at Wilcannia, January 18, 1896.

Filed Under: Information, News, Opinion Tagged With: Temperatures

Absolutely Politically Incorrect: Maximum Temperatures at Bourke and Bathurst

September 24, 2014 By jennifer

The only thing that interferes with my learning is my education. Who said that? What does it mean?

Of course, for the educated climate scientist this chart that shows the mean annual maximum temperatures for Bathurst gaol and Bourke post office should be homogenised. But what beauty and intrigue in raw data that throws up an identical cooling trend when the entire record, unhomogenised is plotted for these two locations in New South Wales, both with exceptionally long records.

Bourke n Bathurst MaxT

I shall not be posting so much for the next little while, as I’ve technical papers to write on rainfall forecasting, diatoms, frogs and also temperatures.

Filed Under: Information Tagged With: Temperatures

Who’s going to be sacked for making-up global warming at Rutherglen? Part 2.

September 19, 2014 By jennifer

THE Bureau of Meteorology has spent several weeks looking for documentation to support its recent claim that, contrary to what is written in its published station catalogue, the weather station at Rutherglen was once moved. Station Catalogue

The Bureau hasn’t been able to find any actual documentation to verify this move. But this hasn’t stopped it nevertheless concluding that there was a station move and publishing a document, not in the peer-reviewed literature, but on the Internet to conclude that the weather station was once moved between paddocks.

Furthermore, but not even published on the Internet, this move between paddocks, that could have occurred in 1966 or even 1974 apparently justifies a drop down in minimum temperatures, with the largest change a 1.8 degree Celsius difference between recorded and homogenised temperatures for Rutherglen in 1913. The net effect on the temperature trend is the creation of a 1.73 degree Celsius per century warming, where previously there was a 0.35 degree C per century cooling in the minimum temperature series.

It makes no sense!

But it hasn’t stopped the alarmists on Twitter and at HotWhopper claiming the Bureau was right all along: the weather station had moved, there are maps and photographs and conclusions, just no actual documented evidence. Indeed it doesn’t seem to have occurred to Lotharsson and the rest of the HotWhopper cheer squad, that if the Bureau was able to find inspection reports, requests for replacement equipment and more, that there should also be documentation if the station had actually been moved!

Of course it may have been moved, and the documentation may have been lost, but that still doesn’t justify the change in magnitude and direction of the temperature trend for Rutherglen that the Bureau has made.

My colleague, Bill Johnston, has forensically examined the temperature data generated by the weather station at Rutherglen. Dr Johnston is of the opinion that it is possible that there was a site move in 1965. He can find a break in the data at this time. But even accounting for this, there is no overall warming trend in the data either side of this break. So, Dr Johnston has concluded after running three independent statistical tests over the data, that it is the Bureau that has changed the data, resulting in a bias in the data series where none previously existed.

HotWhopper haven’t actually examined the data, or thought about whether moving a weather station between paddocks in a relatively flat rural terrain could cause a change in the direction and magnitude of the temperature trend. They are just celebrating that the Bureau could publish on the Internet claiming a site move.

According to HotWhopper, quoting the Bureau, the need for an adjustment to the Rutherglen data was made through the application of, “an objective statistical test that showed an artificial jump in the data during this period” prior to 1966.

In fact statistical tests cannot show “artificial jumps”. What empty heads they are at HotWhopper and the Bureau!

Statistical tests can detect breakpoints in temperature series. These may be attributable to climatic or non-climatic factors.

The Bureau claims that, 1966 and 1974 dates match the two breakpoints in minimum temperatures through a “statistical comparison of its [Rutherglen] data with other site data in the region.”

So, the Bureau is suggesting the “jump” is non-climatic and due to the weather station being moved because, while there is “no firm documentation” for a site move, 12 documents have been located that together, they claim, provide some circumstantial evidence for the weather station having been moved between paddocks.

Importantly, the Bureau is not claiming any breakpoints in the Rutherglen data per se, but rather that the trend at Rutherglen is not consistent with its neighbours at about the times for which there is circumstantial evidence the station was moved from one paddock to another.

It is in fact disingenuous and illogical for the Bureau to suggest that what could only be considered an insignificant move, if indeed it did occur, that is a move between paddocks in a relatively flat rural terrain could create a change in the direction and magnitude of the temperature trend.

But there is more. While the BOM claim a discontinuity based on neighbouring stations the algorithms and/or test that might show such a result are not disclosed. We are expected to believe this is the case, but this is not science because no methodology has been provided. In fact, when one of my colleagues, Ken Stewart, tested this proposition. He found that the raw data for Rutherglen has a virtually identical trend to its neighbouring comparison sites, while the homogenised ACORN-SAT data for Rutherglen is strongly biased towards warming relative to those neighbouring sites.

So, I ask again, who is going to be sacked for making up global warming at Rutherglen?

Filed Under: Humour, Information, News Tagged With: Temperatures

Homogenisation of Williamtown temperatures, draws attention to hot Newcastle in 1878

September 15, 2014 By jennifer

WINSTON Churchill famously said that, democracy is the worst form of government except for all the others. Indeed when everyone has the opportunity to have a say it can be difficult to keep everyone marching together in the same direction, at the same speed, repeating the same mantra.

Of course, getting to the truth often requires alternative opinions to be heard, and perhaps now, finally, the mainstream media will start to allow those sceptical of the theory of anthropogenic global warming to have their say. Indeed just today the Newcastle Herald published the opinion of Anthony Cox explaining how the Australian Bureau of Meteorology homogenise the data. It’s a good article, but was not published in full, and published without a key chart showing the affect of homogenisation on the temperature trend.

Williamtown

What the chart actually shows is that for the Williamtown RAAF, near Newcastle, the minimum temperature series that begins in 1951 has been homogenised. That is, in the creation of the official temperature series temperatures have been changed from what was originally recorded. Like for Rutherglen in Victoria, and Amberley in Queensland, the temperatures are dropped down starting in about 1971. This has an affect on the overall trend, changing what was a mild warming of 0.4 degree C per century from 1951 to 2012, into dramatic warming of 1.6 degree C per century.

Ignoring this new example of homogenisation at Williamtown RAAF, and the 28-pages of ‘adjustments’ released by the Bureau just last week that show most, if not all the weather stations that make-up the official station network are corrupted, the first person to comment at the thread that is now open at the Newcastle Herald is suggesting that I am “cherry picking” and that the overall trend for Australia is surely one of warming.

In fact I’ve hardly started with my criticisms, and the overall trend for Newcastle, like the rest of Australia, is very much one of cooling.

Let me explain, Williamston RAAF is one of the 112 stations that is used to calculate national trends, but it’s not the best temperature series for the Newcastle region. It only starts in about 1951. A much more comprehensive record, but one that is conveniently ignored by the Bureau in the development of the official temperature network, comes from the Nobby’s Signal Station, Newcastle. This record starts way back in 1862, and guess what, like most of the really long records it shows that it was much warmer in the late 1800s than for any time since. In fact the hottest years on record are 1877 and 1878.

We have been conditioned to believe that temperature have been gradually warming, but this is not what the data shows.

Newcastle

When those early records are taken into account, it is clear that New South Wales experienced cooling from the late 1800s to about 1960. After 1960, temperatures across the state and the nation started to increase. This warming continued until it reached a plateau in 2002. Because the warming of the late twentieth century never completely negated the cooling of the early twentieth century, the overall net trend is actually one of cooling. In the case of Newcastle, its a cooling of 0.63 degree Celsius per century.

****
Also today, Graham Young has republished an earlier blog post by me, ‘Bureau caught in own tangled web of homgenisation’ at On Line Opinion…
http://www.onlineopinion.com.au/view.asp?article=16680

Any comments you can make in this comment thread would be appreciated.

And perhaps also at the Newcastle Herald thread here… http://www.theherald.com.au/story/2558481/opinion-adjusted-temperatures-need-explaining/?cs=308

After all, in a democracy your vote, your opinion, does count even if it does not accord with popular opinion.

If you want to Tweet this, I’ve made a new tiny URL.. http://tinyurl.com/nbm54ts

Filed Under: Information, News, Opinion Tagged With: Temperatures

Bureau Caught in Own Tangled Web of Homogenisation

September 12, 2014 By jennifer

THE Australian Bureau of Meteorology now acknowledge that they change the temperatures at most, if not all, the weather stations that make-up the official station network from which national temperature trends are calculated. Indeed, earlier in the week, 28 pages of ‘adjustments’ were released online following a series of articles in The Australian and The Weekend Australian by Graham Lloyd. Scrutinise the detail in this document of adjustments and not only is the rationale and methodology indefensible, but it contradicts information published in the official Station Catalogue which is meant to be the go-to document for understanding this official network known as ACORN-SAT (Australian Climate Observations Reference Network –Surface Air Temperature).

That the Minister has not yet intervened, and that many within the Australian scientific community attempt to justify the practice of homogenisation that creates these ‘adjustments’ that changes cooling trends to warming trends at a whim, is reason for national shame. It all amounts to corruption of the scientific process on a grand scale, with significant economic implications. But not even a whisper about the scandal can be heard from the Australian national broadcaster or the many other typically righteous institutions and individuals that claim to be motivated by the truth.

Yet the deceit is increasingly in plain view. Consider, for example, that the official ACORN-SAT Station Catalogue clearly states on page 6 that in the development of the temperature record for Bathurst Agricultural Research Station (Station No. 063005) data from the longer Bathurst Gaol (Station No. 063004) record was not used. Now go to the 28-page ACORN-SAT Station Adjustment Summary and it lists eight occasions when the Bathurst Gaol record was used to make changes to the Bathurst Agricultural Station Record, which cumulatively have changed the temperature record by 4.65 degree Celsius in different directions at different times.

Also note amongst the changes made to this temperature series the addition of 0.6 degree C to the maximum temperature series (applied to all data prior to 1971) following the installation of a Stevenson screen. That’s right. While the Bureau has been claiming it must discard all data prior to 1910 because until this year stations didn’t have Stevenson screens, in fact we can now see that it has accepted post-1910 data from stations that did not have screens installed until later, in some cases not until 1971.

Moving across the border into Victoria: the Bureau released the ‘adjustments’ used to homogenise the temperature series from the Agricultural Station at Rutherglen (also part of the ACORN-SAT network) about a week earlier than for everywhere else. This followed the series of articles in The Australian newspaper questioning why a cooling trend in the original record from Rutherglen had been turned into a warming trend in the official record.

Rutherglen

Ken Stewart has already attempted to use the data for Rutherglen that was released last week to understand how and why the Bureau homogenised the temperature series at Rutherglen. After several days work he came to the conclusion that either the wrong list of 17 stations (against which the Bureau claimed it has made comparisons) was provided and/or their percentile-matching algorithm produced an error. In short, the method when applied as per the newly provided information produces an altogether different result to that documented by the Bureau, at least for Rutherglen.

But why even bother with the homogenisation when there was no good reason in the first place to apply it to Rutherglen?

After Graham Lloyd first brought the issue of homogenisation at Rutherglen to the nation’s attention the Bureau replied that the process had needed to be applied because there had been a site move. But it has since been unable to provide any evidence, and the claim contradicts its own station catalogue.

It is the case that when weather stations are moved, for example, from post offices to airports, discontinuities can be created in the data that may need to be corrected. But in fact there is no evidence to suggest that the weather station at Rutherglen has ever moved. For the last 100 years it has been sitting in a flat paddock, creating a near perfect temperature series. In fact, all that seems amiss with the temperature series is that the minimum temperatures show a cooling trend, contrary to global warming theory.

Statistician David Stockwell had tested the original minimum temperature series for Rutherglen for discontinuities and found none. Agronomist Bill Johnston has run his own very fine-scaled ‘ruler’ over the same dataset and found step-changes that could be attributable to shifts in the climate, the equipment or something else. But nevertheless when all of these micro-lumps and bumps are accounted for, Dr Johnston concludes that the residual trend is no different to zero-trend. In other words, no need to make any adjustments.

Drs Stockwell, Johnston and myself have all been called deniers by the mainstream climate science community for drawing attention to the logical inconsistencies obvious in the homogenisation of Rutherglen. But at the same time none of the same name-calling scientists, who draw a government salary for their apparent expertise in this area, have been prepared to actually mention the word ‘Rutherglen’ in public – let alone discuss the data.

I’ve come to the conclusion that those who have so far defended the homogenising of the temperature series at Rutherglen, Amberley, Deniliquin and Bourke, as the first example that I have thrown up over the last few weeks, are acting either on faith, ignorance or the new morality being preached by technocrats who believe it is wholly legitimate to change received evidence when it does not accord with theory. In the case of the Bureau it’s called homogenisation. Ansley Kellow in his book Science and Public Policy refers to the phenomenon as noble cause corruption.

With the release of the 28-pages of adjustments earlier in the week it should be crystal clear that the practice of homogenisation is indefensible and widespread, affecting virtually all the stations that comprise the ACORN-SAT network. This must have significant ramifications for government policy in so many different areas, because the temperature trends created by the ACORN-SAT network underpin the notion that we have man-made global warming.

In a democracy it is the role of government to oversee the correct function of institutions like the Bureau of Meteorology. Greg Hunt is the Minister ultimately responsible. So far he has been silent on the issue. This is in effect condoning what until recently would have been considered a totally unethical practice: changing received evidence to fit a preferred storyline. It’s unacceptable, but will Minister Hunt do anything about it? Will the national broadcaster even report on it? What can you do about it?

Postscript:

Over recent years the Australian Bureau of Meteorology has been given increasing responsibilities and more and more funding. For example, with the Water Act 2007, it has taken over responsibilities for provision of information that determines water allocations within the Murray Darling (essentially the size of the rice and cotton crops), in October last year an initiative of the National Plan for Environmental Information established the Bureau of Meteorology as Australia’s central coordinating authority for all environmental information.

Filed Under: Information, News Tagged With: Temperatures

Newspapers as the guardians of hot history

September 10, 2014 By jennifer

OLD newspapers hold a lot of information, some of it very valuable. I’m not only referring to last week’s The Land, but clippings that date back to editions published one hundred or more years ago.

Last week's The Land
Last week’s The Land

For example, in the Sydney Morning Herald on Tuesday 5th January 1909 it was reported that Bourke was experiencing a heat wave with temperatures ranging between 103 and 125 degree Fahrenheit (39 to 51.7 degree Celsius). It’s perhaps the hottest temperature ever recorded anywhere in Australia.

The recording of 125 degree Fahrenheit on 3rd January 1909 was taken from a new Stevenson screen installed in the yard at the Bourke post office in August 1908.

According to the Bureau of Meteorology there are no reliable records before 1910 because there were few Stevenson screens.

Well maybe just one in Bourke?

No.

Again, if you check the old newspapers, well, according to the Rockhampton Morning Bulletin on Saturday 28th September 1889 government meteorologist Clement Wragge was fitting a Stevenson screen at the telegraphic office before travelling on to Boulia and Cloncurry in western Queensland to do the same.

How pesky are these written reports when the Bureau would have us believe there is no such thing as a reliable temperature record before 1910.

It is interesting that the record hot day in Bourke on 3rd January 1909 was also written into the Meteorological Observation book that was kept in the Bourke post office back then, and can now be found in the national archive at Chester Hill in western Sydney.

I went and checked not only the old newspapers but also the book in the national archive, because, guess what? The Bureau of Meteorology is claiming it was all a clerical error. They have scratched this record made on 3rd January 1909 from the official record for Bourke, which means it’s also scratched from the NSW and national temperature record.

Yep. It never happened. No heatwave back in 1909.

They have also wiped the heatwave of January 1896. This was probably the hottest January on record, not just for Bourke, but Australia-wide. Yet according to the rules dictated by the Bureau, if it was recorded before 1910, it doesn’t count.

In ignoring the old records the Bureau is denying the Australian public valuable information. Its dangerous and its irresponsible.

We need to know both how hot and also how dry it was in the past if we are to adequately prepare for the future, whether or not the theory of anthropogenic global warming is ever proven.

So rather than working to make the data fit the theory, the Bureau should focus on keeping an accurate record.

This could start with them reinstating that record hot day in Bourke on 3rd January 1909. After all if it was published in the press, and in the official book at the Bourke post office it must be true. Not to mention that it was also very hot in Brewarrina that day, a warm 123 degree Fahrenheit according to the old newspapers.

*****
This article was first published in last week’s The Land newspaper.

Filed Under: Information Tagged With: Temperatures

  • « Go to Previous Page
  • Go to page 1
  • Interim pages omitted …
  • Go to page 6
  • Go to page 7
  • Go to page 8
  • Go to page 9
  • Go to page 10
  • Interim pages omitted …
  • Go to page 13
  • Go to Next Page »

Primary Sidebar

Recent Comments

  • Ian Thomson on Vax-ed as Sick as Unvax-ed, Amongst My Friends
  • Dave Ross on Vax-ed as Sick as Unvax-ed, Amongst My Friends
  • Dave Ross on Vax-ed as Sick as Unvax-ed, Amongst My Friends
  • Alex on Incarceration Nation: Frightened of Ivermectin, and Dihydrogen monoxide
  • Wilhelm Grimm III on Incarceration Nation: Frightened of Ivermectin, and Dihydrogen monoxide

Subscribe For News Updates

  • This field is for validation purposes and should be left unchanged.

November 2025
M T W T F S S
 12
3456789
10111213141516
17181920212223
24252627282930
« Jan    

Archives

Footer

About Me

Jennifer Marohasy Jennifer Marohasy BSc PhD has worked in industry and government. She is currently researching a novel technique for long-range weather forecasting funded by the B. Macfie Family Foundation. Read more

Subscribe For News Updates

Subscribe Me

Contact Me

To get in touch with Jennifer call 0418873222 or international call +61418873222.

Email: jennifermarohasy at gmail.com

Connect With Me

  • Facebook
  • LinkedIn
  • RSS
  • Twitter
  • YouTube

Copyright © 2014 - 2018 Jennifer Marohasy. All rights reserved. | Legal

Website by 46digital