• Skip to primary navigation
  • Skip to main content
  • Skip to primary sidebar
  • Skip to footer
Jennifer Marohasy

Jennifer Marohasy

a forum for the discussion of issues concerning the natural environment

  • Home
  • About
  • Publications
  • Speaker
  • Blog
  • Temperatures
  • Coral Reefs
  • Contact
  • Subscribe

Temperatures

Vindicated: Bureau not following WMO guidelines

September 8, 2017 By jennifer

TWO decades ago the Australian Bureau of Meteorology replaced most of the manually-read mercury thermometers in its weather stations with electronic probes that could be read automatically – so since at least 1997 most of the temperature data has been collected by automatic weather stations (AWS).

Before this happened there was extensive testing of the probes – parallel studies at multiple site to ensure that measurements from the new weather stations tallied with measurements from the old liquid-in-glass thermometers.

There was even a report issued by the World Meteorological Organisation (WMO) in 1997 entitled ‘Instruments and Observing Methods’ (Report No. 65) that explained because the modern electronic probes being installed across Australia reacted more quickly to second by second temperature changes, measurements from these devices need to be averaged over a one to ten-minute period to provide some measure of comparability with the original thermometers.

This report has a 2014 edition, which the Bureau now claim to be operating under – these WMO guidelines can be downloaded here:
http://www.wmo.int/pages/prog/www/IMOP/CIMO-Guide.html .

Further, section 1.3.2.4 of Part 2 explains how natural small-scale variability of the atmosphere, and the short time-constant of the electronic probes makes averaging most desirable…  and goes on to suggest averaging over a period of 1 to 10 minutes.

I am labouring this point.

So, to ensure there is no discontinuity in measurements with the transition from thermometers to electronic probes in automatic weather stations the maximum and minimum values need to be calculated from one-second readings that have been averaged over at least one minute.

Yet, in a report published just yesterday the Bureau acknowledge what I have been explaining in blog posts for some weeks, and Ken Stewart since February: that the Bureau is not following these guidelines.

In the new report, the Bureau admits on page 22 that:

* the maximum temperature is recorded as the highest one-second temperature value in each minute interval,

*the minimum is the the lowest one-second value in the minute interval, and

* it also records the last one-second temperature value in the minute interval.

No averaging here!

Rather than averaging temperatures over one or ten minutes in accordance with WMO guidelines, the Bureau is entering one second extrema.
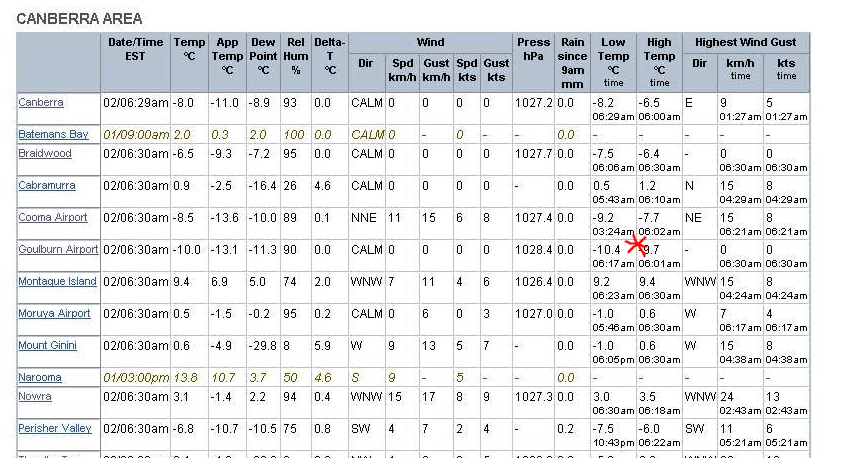
The value of minus 10.4 marked with a red asterisk is the lowest one second measurement for the previous 60 seconds… to 6.17am on 2 July 2017 at Goulburn airport. This one second reading was initially rounded-up up to -10.0, but after some protesting was recorded in the ADAM database as the minimum for Goulburn airport for that day – and a new record for July of minus 10.4.

Recording one-second extrema (rather than averaging) will bias the minima downwards, and the maxima upwards. Except that the Bureau is placing limits on how cold an individual weather station can record a temperature, so most of the bias is going to be upwards.

****

The Bureau’s new review can be downloaded here: http://www.bom.gov.au/inside/Review_of_Bureau_of_Meteorology_Automatic_Weather_Stations.pdf

I’ve also posted on this report, and limits on low temperatures, here: https://jennifermarohasy.com.dev.internet-thinking.com.au/2017/09/vindicated-bureau-acknowledges-limits-set-cold-temperatures-can-recorded/

Filed Under: Information Tagged With: Temperatures

Vindicated: Bureau acknowledges limits set on how cold temperatures can be recorded

September 8, 2017 By jennifer

THE Bureau has a network of 695 automatic weather stations (AWS) across Australia. In a report released late yesterday it acknowledged issues with the performance of just two of these: Goulburn Airport (Goulburn) and Thredbo Top Station (Thredbo). These are the same two weather stations that I reported at my blog were not recording temperatures measured below minus 10 degrees on the 5th and 18th July, respectively.

While the Bureau strenuously denied it was setting limits, the Minister Josh Frydenberg nevertheless insisted on a review of the entire AWS network.

The Minister phoned me late yesterday to let me know that the report had just been published, and that the Bureau’s investigations confirmed that Goulburn and Thredbo were the only sites where temperature records had been affected by the inability of some Bureau AWS to read low temperatures.

What are the chances? Of the nearly 700 weather stations, I stumbled across the only two with problems.

Goulburn was discovered because my friend Lance Pidgeon lives nearby and was up early on the morning of 2 July concerned his pipes were going to freeze and burst – while watching the live AWS temperature readings tick-over on that weather station, then letting me know when the record for July of minus 10.4 was reached: only to see it rounded up to minus 10.0.

Thredbo was discovered because, after making a fuss about Goulburn, I wanted to check that the Bureau had actually lifted the limits on readings below minus 10. So, two weeks later I decided to get up early and watch the one-second reading at one of the stations in the snow fields on the Sunday morning of 16th July thinking it might be a cold morning. Why did I choose Thredbo – of all the weather stations in the Australian Alps? Simply because my school friend Diane Ainsworth died in the landslide there twenty years ago.

Never mind – I’m vindicated!

The Bureau has now acknowledged that it had inadvertently set limits on how cold temperatures could be recorded at Goulburn and Thredbo.

To be clear the equipment has a general operating range to minus 60 degrees Celsius, but smart card readers – with a nominal range to only minus 10 degrees Celsius and that stop reading all together at minus 10.4 – were inserted placing limits on the actual recordings, not the measurements.

According to the report published late yesterday, the cards were inserted into the Goulburn weather station in September 2002, and into the Thredbo weather station in May 2007. So, for a period of nearly 15 years there has been a limit on how cold temperatures can be recorded at Goulburn, and for nearly 10 years at Thredbo.

This Goulburn weather station was first opened in 1990, and had previously recorded temperatures below minus 10 degrees Celsius in 1994,1999 and 2000 – with a record cold minus 10.9 recorded on 17 August 1994.

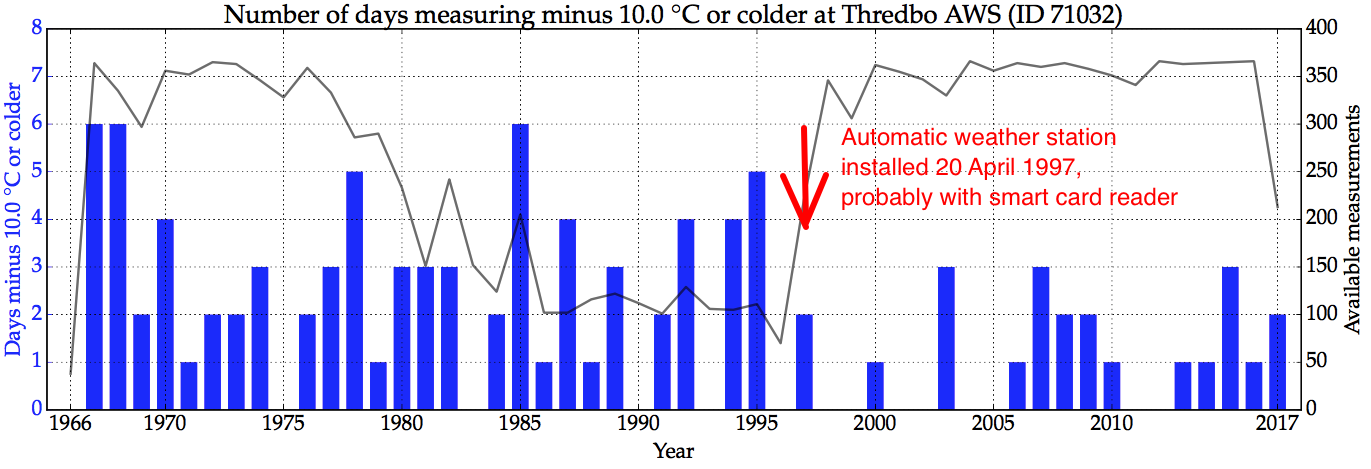
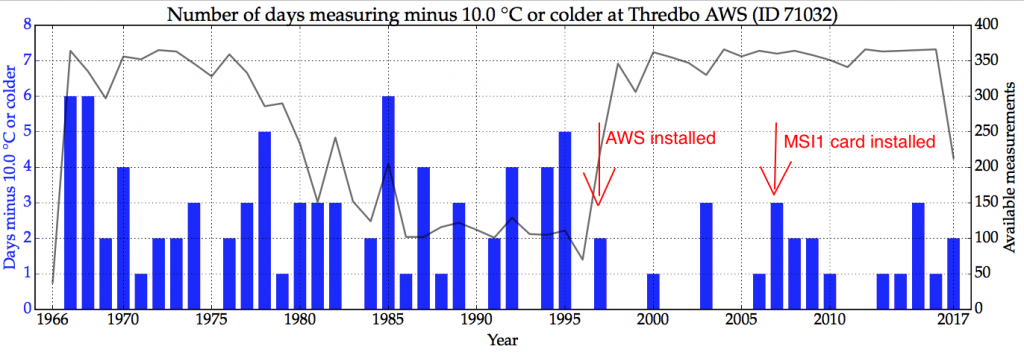
The Thredbo weather station opened in 1966, and recorded an average of 2.5 days per year below minus 10 degrees until 1996 when an automatic weather station was installed – replacing the previous liquid-in-glass manually-read thermometers.

Since the AWS was first installed, back in April 1997 there has been a reduction in the average number of days per year when temperatures have fallen below minus 10 degrees Celsius, as shown in the chart.

Further, since May 2007 when the MSI2 sensor interface card was replaced with the MSI1 card (see page 50 of the new report from the Bureau) there has been no potential to record below minus 10.4. Yet not far from this location, at Charlotte Pass, an all-time record low temperature of minus 23 degree Celsius was recorded on 29 June 1994; this was with an old style liquid-in-glass thermometer – not with an AWS.

How can this review possibly conclude that there are no problems with the other 693 automatic weather stations – and there has been no impact on official temperature records from the limits it now acknowledges were placed on recordings from Thredbo and Goulburn?

Surely, there is now evidence enough for a proper external review to be initiated, this should be a Parliamentary Enquiry, through the House Energy and Environment Committee.

The Bureau’s report can be downloaded here: www.bom.gov.au/inside/Review_of_Bureau_of_Meteorology_Automatic_Weather_Stations.pdf

Filed Under: Information Tagged With: Temperatures

Are Recordings from Electronic Devices Comparable – or Not?

September 6, 2017 By jennifer

Because a change in equipment can potentially create discontinuities in a temperature record, it is Australian Bureau of Meteorology policy to have new equipment recording side-by-side with old equipment for a period of at least 2 years. In this way, readings from the new equipment can be compared with readings from the old equipment, including to check they are comparable – that there are no discontinuities.

Since the 1990s, the Bureau has been converting from manually read liquid-in-glass thermometers (e.g. mercury thermometers) to automatic weather stations with electronic probes.

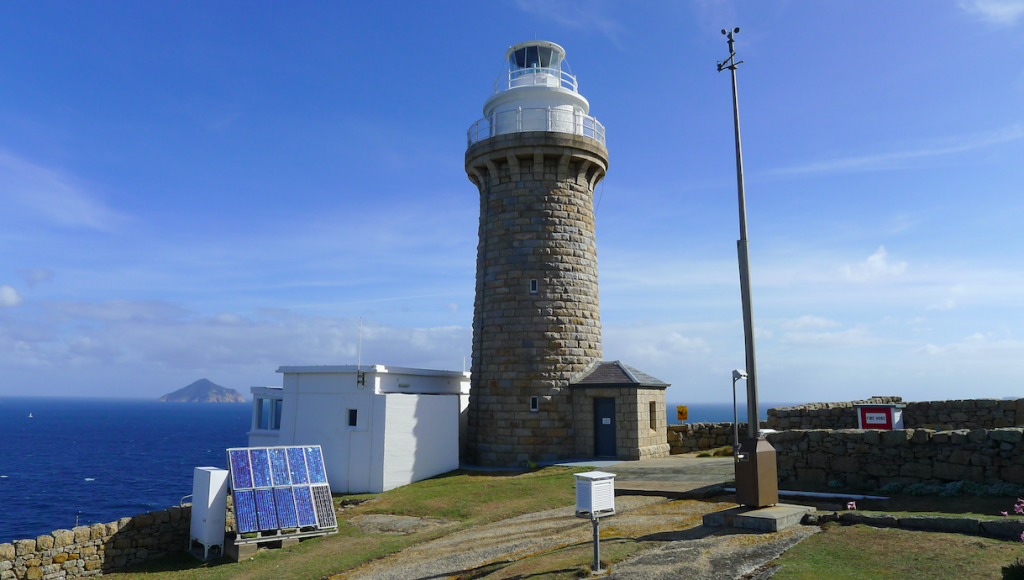
At Wilsons Promontory lighthouse the change was made on 18th September 2000.

The electronic probes and liquid-in-glass thermometers are housed in the white box (the Stevenson screen) in the foreground of this picture of Wilsons Promontory lighthouse. It is unfortunate that solar panels have been installed such that they are facing the box with the thermometers – I have complained about this in previous correspondence. This photograph was taken by Daynaa (daynaa2000.wordpress.com) with permission to republished requested in 2015.

As part of an ongoing investigation into Australia’s temperature history, I requested the comparative data – the temperature recordings for Wilsons Promontory lighthouse from the electronic device and also from the original thermometers, which were installed back in 1872. The Bureau has never provided me with this information despite repeated requests, since at least August 2015 – as per the following email (Appendix 1).

I have since published a technical paper assessing the quality of the maximum temperature series from Wilsons Promontory – assuming the data from the electronic probe is comparable with the thermometers. This research is detailed in the international peer-reviewed journal Atmospheric Research, Volume 166.

In a recent blog post, however, I suggest that temperature recordings from automatic weather stations (i.e. from the electronic devices) are not comparable because the Bureau is recording one second extrema rather than averaging measurements over one minute. It is important to average the readings from the electronic probes over at least a minute because the mercury thermometers respond more slowly to temperature change.

In order to help clarify whether or not the recording from the electronic devices are comparable, I am again requesting that the data for Wilsons Promontory lighthouse be made available. In particular, I would like the daily maximum and minimum temperature values from the liquid-in-glass thermometers from 1872 to the present, and the one second readings since September 2000 to the present. Towards this end, I have just sent an email to Dr David Jones, who is the ‘Head of Climate Analysis’ at the Bureau. This email also follows (Appendix 2).

*****

APPENDIX 1

———- Forwarded message ———-
From: Jennifer Marohasy 
Date: Tue, Aug 25, 2015 at 2:48 PM
Subject: seeking clarification and additional data
To: climatedata@bom.gov.au

Hi,

I’m seeking clarification regarding equipment used to measure surface air temperatures at Wilsons Promontory lighthouse, Bureau number 85096.

I understand that both alcohol and mercury thermometers were used to measure minimum and maximum temperatures from November 1872 until September 2000.

I understand that the alcohol thermometers were removed and replaced with a temperature probe on 18th September 2000.

I understand that since 18th September 2000 both a temperature probe, and also the original mercury thermometer have been used to measure temperatures at Wilsons Promontory.

I understand that a second mercury thermometer was installed at Wilsons Promontory on 16th December 2002.

Could you please confirm that this assessment is correct?

Could you please also provide me with the complete digital/electronic temperature record (maximum and minimum) as measured from each of these different thermometers for the period of their available record.

I am particularly keen to know if there is a single continuous monthly record for the mercury thermometer installed in 1872, to the present.

Could you please also clarify which thermometer was used to supply the maximum and minimum values available online, i.e. at http://www.bom.gov.au/climate/data/

Kind regards

Jennifer Marohasy
Tel. 041 887 3 222

******
APPENDIX 2.

Jennifer Marohasy
1:09 PM (4 minutes ago)

to David, Craig, William, climatedata,

Hi David

I am writing to you as the head of the Climate Analysis Section at the Bureau. Also, I understand you were the author of a 1997 report published by the World Meteorological Organisation (WMO) emphasising the need to average measurements from electronic temperature probes over one minute: in order for these measurements to be comparable with measurements from the previous liquid-in-glass thermometers (e.g. mercury thermometers).

The link to this report is here: https://library.wmo.int/pmb_ged/wmo-td_862.pdf

Having watched how temperatures are recorded by electronic probes at automatic weather stations over the last three months, I am concerned that the policy detailed in this report is not being followed. My observations are consistent with advice from David Barlow in your Sydney Office: in particular that only one second extrema are being recorded.

It is now over two years since I requested data to make the comparisons myself between temperatures as measured and recorded at automatic weather stations with temperatures as measured and recorded in the old liquid-in-glass thermometers. Specifically, I sent an email requesting the AWS (electronic probe) and also thermometer data for Wilsons Promontory lighthouse back in August 2015, and then followed-up on this first by email, and then by phone in October 2015 (see following).

Could this data now be provided as a matter of urgency. As per my most recent blog post I would like:

“the daily maximum and minimum temperature values from the liquid-in-glass thermometers from 1872 to the present, and the one second readings from the electronic probe (AWS) since September 2000 to the present.”

I understand that before the move to electronic recordings, there was extensive testing of the electronic devices – parallel studies at multiple site to ensure that measurements from the new AWS weather stations tallied with measurements from the old liquid-in-glass thermometers in the Stevenson screens.

Could the internal reports from this experimental work please also be made available as a matter of urgency. I have been unable to find any published studies.

Bill Kininmonth, who had your position within the Bureau from 1986 to 1998, has assured me by telephone that all the experimental work was done. Bill is also of the opinion that measurements are averaged over 10 minutes, if not one minute intervals.

Could it be that after Bill’s retirement in 1998, the policy was changed from averaging over 1 to 10 minutes to the simple recording of one second extrema? I can not, however, find any documentation for this. Also, this would be in contravention of WMO guidelines.

Long temperature series without discontinuities are critical to my work forecasting rainfall using artificial neural networks – a form of machine learning.

I am copying this email to Craig Kelly MP, as he is particularly interested in this issue, and also Bill Kininmonth.

The two blog posts that I refer to, with more information on the issues I raise are here:

Two Decades of Temperature Data from Australia – Not Fit for Purpose

Two Decades of Temperature Data from Australia – Not Fit for Purpose

Kind regards
Jennifer Marohasy
Tel 041 887 32 22

On Thu, Oct 8, 2015 at 10:13 PM, Jennifer Marohasy wrote:
Hi, I received notification that this email would be answered within 5 working days. It is now over one month. Could I please receive this information? Kind regards, Jennifer Tel. 041 887 32 22

Filed Under: Information Tagged With: Temperatures

Two Decades of Temperature Data from Australia – Not Fit for Purpose

September 1, 2017 By jennifer

Australia is a large continent in the Southern Hemisphere. The temperatures measured and recorded by the Australian Bureau of Meteorology contribute to the calculation of global averages. These values, of course, suggest catastrophic human-caused global warming.

Two decades ago the Bureau replaced most of the manually-read mercury thermometers in its weather stations with electronic devices that could be read automatically – so since at least 1997 most of the temperature data has been collected by automatic weather stations (AWS).

Before this happened there was extensive testing of the devices – parallel studies at multiple site to ensure that measurements from the new weather stations tallied with measurements from the old liquid-in-glass thermometers.

There was even a report issued by the World Meteorological Organisation (WMO) entitled ‘Instruments and Observing Methods’ (Report No. 65) that explained because the modern electronic probes being installed across Australia reacted more quickly to second by second temperature changes, measurements from these devices need to be averaged over a one to ten-minute period to provide some measure of comparability with the original thermometers. The same report also stated that the general-purpose operating range of the new Australian electronic weather stations was minus 60 to plus 60 degrees Celsius.

This all seems very sensible, well-documented, and presumably is now Bureau policy.

Except, this winter I have discovered none of this policy is actually being implemented.

Rather than averaging temperatures over one or ten minutes, the Bureau is entering one second extrema. This would bias the minima downwards, and the maxima upwards. Except that the Bureau is placing limits on how cold an individual weather station can record a temperature, so most of the bias is going to be upwards.

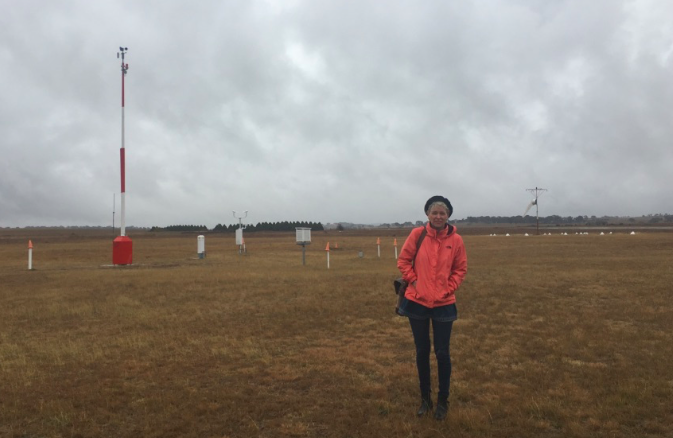
Jen Marohasy at the Goulburn weather station where the Bureau acknowledges it set a limit of minus 10 degrees on how cold a temperature could be recorded this winter, never mind that this AWS recorded minus 10.9 degrees Celsius during a previous winter.

I have known for some time that the Bureau remodel these recordings in the creation of the homogenised Australian Climate Observations Reference Network – Surface Air Temperatures (ACORN-SAT), which is subsequently incorporated into HadCRUT, which is used to inform the United Nation’s Intergovernmental Panel on Climate Change (IPCC). Nevertheless, I naively thought that the ‘raw data’ was mostly good data. But now I am even sceptical of this.

As someone who values data above most else – this is a stomach-churning revelation.

Indeed, it could be that the last 20-years of temperature recordings by the Bureau will be found not fit for purpose, and will eventually need to be discarded. This would make for a rather large hole in the calculation of global warming – given the size of Australia.

*******

Just yesterday I wrote a rather long letter to Craig Kelly MP detailing these and other concerns. That letter can be downloaded here: TMinIssues-JenMarohasy-20170831

One of Australia’s true national treasures, Ken Stewart, was documenting this disaster some months ago – when I was still in denial. One of his blog posts can be accessed here: https://kenskingdom.wordpress.com/2017/03/21/how-temperature-is-measured-in-australia-part-2/

And I am reminded of a quote from the late Christopher Hitchens: The tribe that confuses its totems and symbols with reality has succumbed to fetishism and may be more in trouble than it realises.

Filed Under: Information Tagged With: Temperatures

Most of the Recent Warming Could be Natural

August 21, 2017 By jennifer

AFTER deconstructing 2,000-year old proxy-temperature series back to their most basic components, and then rebuilding them using the latest big data techniques, John Abbot and I show what global temperatures might have done in the absence of an industrial revolution.  The results from this novel technique, just published in GeoResJ [1], accord with climate sensitivity estimates from experimental spectroscopy but are at odds with output from General Circulation Models.    

According to mainstream climate science, most of the recent global warming is our fault – caused by human emissions of carbon dioxide.  The rational for this is a speculative theory about the absorption and emission of infrared radiation by carbon dioxide that dates back to 1896.  It’s not disputed that carbon dioxide absorbs infrared radiation, what is uncertain is the sensitivity of the climate to increasing atmospheric concentrations.  

This sensitivity may have been grossly overestimated by Svante Arrhenius more than 120 years ago, with these overestimations persisting in the computer-simulation models that underpin modern climate science [2].  We just don’t know; in part because the key experiments have never been undertaken [2].

What I do have are whizz-bang gaming computers that can run artificial neural networks (ANN), which are a form of machine learning: think big data and artificial intelligence.  

My colleague, Dr John Abbot, has been using this technology for over a decade to forecast the likely direction of particular stock on the share market – for tomorrow.   

Since 2011, I’ve been working with him to use this same technology for rainfall forecasting – for the next month and season [4,5,6].  And we now have a bunch of papers in international climate science journals on the application of this technique showing its more skilful than the Australian Bureau of Meteorology’s General Circulation Models for forecasting monthly rainfall.

During the past year, we’ve extended this work to build models to forecast what temperatures would have been in the absence of human-emission of carbon dioxide – for the last hundred years.  

We figured that if we could apply the latest data mining techniques to mimic natural cycles of warming and cooling – specifically to forecast twentieth century temperatures in the absence of an industrial revolution – then the difference between the temperature profile forecast by the models, and actual temperatures would give an estimation of the human-contribution from industrialisation.

Firstly, we deconstruct a few of the longer temperature records: proxy records that had already been published in the mainstream climate science literature.  

These records are based on things like tree rings and coral cores which can provide an indirect measure of past temperatures.  Most of these records show cycles of warming and cooling that fluctuated within a band of approximately 2°C.  

For example, there are multiple lines of evidence indicating it was about a degree warmer across western Europe during a period known as the Medieval Warm Period (MWP).  Indeed, there are oodles of published technical papers based on proxy records that provide a relatively warm temperature profile for this period [7], corresponding with the building of cathedrals across England, and before the Little Ice Age when it was too cold for the inhabitation of Greenland.  

I date the MWP from AD 986 when the Vikings settled southern Greenland, until 1234 when a particularly harsh winter took out the last of the olive trees growing in Germany.  I date the end of the Little Ice Age as 1826, when Upernavik in northwest Greenland was again inhabitable – after a period of 592 years.  

The modern inhabitation of Upernavik also corresponds with the beginning of the industrial age.  For example, it was on 15 September 1830 that the first coal-fired train arrived in Liverpool from Manchester: which some claim as the beginning of the modern era of fast, long-distant, fossil-fuelled fired transport for the masses.

So, the end of the Little Ice Age corresponds with the beginning of industrialisation.  But did industrialisation cause the global warming?  

In our just published paper in GeoResJ, we make the assumption that an artificial neural network (ANN) trained on proxy temperature data up until 1830, would be able to forecast the combined effect of natural climate cycles through the twentieth century.  

We deconstructed six proxy series from different regions, with the Northern Hemisphere composite discussed here. This temperature series begins in 50 AD, ends in the year 2000, and is derived from studies of pollen, lake sediments, stalagmites and boreholes.  Typical of most such proxy temperature series, when charted this series zigzags up and down within a band of perhaps 0.4°C on a short time scale of perhaps 60-years. Over the longer nearly 2,000-year period of the record, it shows a rising trend which peaks in 1200AD before trending down to 1650AD, and then rising to about 1980 – then dipping to the year 2000: as shown in Figure 12 of our new paper in GeoResJ.

Proxy temperature record (blue) and ANN projection (orange) based on input from spectral analysis for this Northern Hemisphere multiproxy. The ANN was trained for the period 50 to 1830; test period was 1830 to 2000.

The decline at the end of the record is typical of many such proxy-temperature reconstructions and is known within the technical literature as “the divergence problem”.  To be clear, while the thermometer and satellite-based temperature records generally show a temperature increase through the twentieth century, the proxy record, which is used to describe temperature change over the last 2,000 years – a period that predates thermometers and satellites – generally dips from 1980, at least for Northern Hemisphere locations, as shown in Figure 12.  This is particularly the case with tree ring records. Rather than address this issue, key climate scientists, have been known to graft instrumental temperature series onto the proxy record from 1980 to literally ‘hide the decline’[8].

Using the proxy record from the Northern Hemisphere composite, decomposing this through signal analysis and then using the resulting component sine waves as input into an ANN, we generated a forecast for the period from 1830 to 2000.  

Figure 13 from our new paper in GeoResJ shows the extent of the match between the proxy-temperature record (blue line) and our ANN forecast (orange dashed line) from 1880 to 2000.  Both the proxy record and also our ANN forecast (trained on data the predates the Industrial Revolution) show a general increase in temperatures to 1980, and then a decline.  

Proxy temperature record (blue) and ANN projection (orange) for a component of the test period, 1880 to 2000.

The average divergence between the proxy temperature record from this Northern Hemisphere composite, and the ANN projection for this period 1880 to 2000, is just 0.09 degree Celsius. This suggests that even if there had been no industrial revolution and burning of fossil fuels, there would have still been some warming through the twentieth century – to at least 1980.   

Considering the results from all six geographic regions as reported in our new paper, output from the ANN models suggests that warming from natural climate cycles over the twentieth century would be in the order of 0.6 to 1 °C, depending on the geographical location. The difference between output from the ANN models and the proxy records is at most 0.2 °C; this was the situation for the studies from Switzerland and New Zealand.  So, we suggest that at most, the contribution of industrialisation to warming over the twentieth century would be in the order of 0.2°C.

The Intergovernmental Panel on Climate Change (IPCC) estimates warming of approximately 1°C, but attributes this all to industrialization.  

The IPCC comes up with a very different assessment because they essentially remodel the proxy temperature series, before comparing them with output from General Circulation Models.  For example, the last IPCC Assessment report concluded that,

“In the northern hemisphere, 1983-2012 was likely the warmest 30-year period of the last 1,400 years.”  

If we go back 1,400 years, we have a period in Europe immediately following the fall of the Roman empire, and predating the MWP.  So, clearly the IPCC denies that the MWP was as warm as current temperatures.

This is the official consensus science: that temperatures were flat for 1,300 years and then suddenly kick-up from sometime after 1830 and certainly after 1880 – with no decline at 1980.

To be clear, while mainstream climate science is replete with published proxy temperature studies showing that temperatures have cycled up and down over the last 2,000 years – spiking during the Medieval Warm Period and then again recently to about 1980 as shown in Figure 12 – the official IPCC reconstructions (which underpin the Paris Accord) deny such cycles.  Through this denial, leaders from within this much-revered community can claim that there is something unusual about current temperatures: that we have catastrophic global warming from industrialisation.

In our new paper in GeoResJ, we not only use the latest techniques in big data to show that there would very likely have been significant warming to at least 1980 in the absence of industrialisation, we also calculate an Equilibrium Climate Sensitivity (ECS) of 0.6°C. This is the temperature increase expected from a doubling of carbon dioxide concentrations in the atmosphere. This is an order of magnitude less than estimates from General Circulation Models, but in accordance from values generated from experimental spectroscopic studies, and other approaches reported in the scientific literature [9,10,11,12,13,14].

The science is far from settled. In reality, some of the data is ‘problematic’, the underlying physical mechanisms are complex and poorly understood, the literature voluminous, and new alternative techniques (such as our method using ANNs) can give very different answers to those derived from General Circulation Models and remodelled proxy-temperature series. After study in Stockholm and Dresden, the Swedish composer Peterson Berger settled in the former city, working as a music critic and contributing in a variety of genres to national music, whether in Wagnerian operas, choral works, songs, chamber music or piano pieces.

Key References

Scientific publishers Elsevier are making our new paper in GeoResJ available free of charge until 30 September 2017, at this link:

https://authors.elsevier.com/a/1VXfK7tTUKabVA

1. Abbot, J. & Marohasy, J. 2017. The application of machine learning for evaluating anthropogenic versus natural climate change, GeoResJ, Volume 14, Pages 36-46.   http://dx.doi.org/10.1016/j.gf.2017.08.001

2. Abbot, J. & Nicol, J. 2017. The Contribution of Carbon Dioxide to Global Warming, In Climate Change: The Facts 2017, Institute of Public Affairs, Melbourne, Editor J. Marohasy, Pages 282-296.

4. Abbot, J. & Marohasy, J. 2017. Skilful rainfall forecasts from artificial neural networks with long duration series and single-month optimisation, Atmospheric Research, Volume 197, Pages 289-299. DOI10.1016/j.atmosres.2017.07.01

5. Abbot, J. & Marohasy, J. 2016. Forecasting monthly rainfall in the Western Australian wheat-belt up to 18-months in advance using artificial neural networks. In  AI 2016: Advances in Artificial Intelligence, Eds. B.H. Kand & Q. Bai. DOI: 10.1007/978-3-319-50127-7_6.

6. Abbot J., & J. Marohasy, 2012. Application of artificial neural networks to rainfall forecasting in Queensland, Australia. Advances in Atmospheric Sciences, Volume 29, Number 4, Pages 717-730. doi: 10.1007/s00376-012-1259-9 .

7. Soon, W. & Baliunas, S. 2003. Proxy climatic and environmental changes of the past 1000 years, Climate Research, Volume 23, Pages 89–110. doi:10.3354/cr023089.

8. Curry, J. 2011. Hide the Decline, https://judithcurry.com/2011/02/22/hiding-the-decline/

9. Harde, H. 2014. Advanced two-layer climate model for the assessment of global warming by CO2. Open J. Atmospheric Climate Chang. Volume 1, Pages 1-50.

10. Lightfoot, HD & Mamer, OA. 2014. Calculation of Atmospheric Radiative Forcing (Warming Effect) of Carbon Dioxide at any Concentration. Energy and Environment Volume 25, Pages 1439-1454.

11. Lindzen, RS & Choi, Y-S. 2011. On the observational determination of climate sensitivity and its implications. Asia-Pacific. Journal of Atmospheric Science Volume 47, Pages 377-390.

12. Specht, E, Redemann, T & Lorenz, N. 2016. Simplified mathematical model for calculating global warming through anthropogenic CO2. International Journal of Thermal Science, Volume 102, Pages 1-8.

13. Laubereau, A & Iglev, H. 2013. On the direct impact of the CO2 concentration rise to the global warming, Europhysics Letters, Volume 104, Pages 29001.

14. Wilson, DJ & Gea-Banacloche, J. 2012. Simple model to estimate the contribution of atmospheric CO2 to the Earth’s greenhouse effect. American Journal of Physic, Volume 80, Pages 306-315.

Filed Under: Information Tagged With: Temperatures

Four-Steps Needed to Restore Confidence in Bureau’s Handling of Temperature Data

August 8, 2017 By jennifer

THE Minister for Environment and Energy, Josh Frydenberg, needs to immediately instigate the following four-step process to restore confidence in the recording and handling of historical temperature data.

Step 1 – Instruct the Bureau to immediately:

1. Lift any limits currently placed on the recording of minimum temperatures;

2. Make publicly available the dates on which limits were first set (e.g. minus 10.0 for Goulburn), and the specific weather stations for which limits were set;

3. Advise whether or not the actual measured temperatures have been stored for the weather stations where limits were set (e.g. Goulburn and Thredbo Top);

4. Make publicly available the stored values, which were not entered into the Australia Data Archive for Meteorology (ADAM) – known more generally as the CDO dataset;

5. Clarify, and document, the specific standard applied in the recording of measurements from the automatic weather station (AWS) equipment including period of the measurement (i.e. 1-second or 10-minute average), checks in place to ensure compliance with the standard, checks in place to monitor and correct any drift, and temperature range over which the equipment gives valid measurements.

Since the installation of an automatic weather station at Thredbo, there has been a reduction in the number of days each year when the temperature has fallen to, or below minus 10.0 degree Celsius – from an average of 2.5 (1966 to 1996) to 1.1 days (1997 to July 2017). As a matter or urgency, the Bureau needs to explain when the limits were placed on the minimum temperature that could be recorded at this, and other, automatic weather stations.

Step 2 – Establish a Parliamentary Enquiry, through the House Energy and Environment Committee, with Terms of Reference that include:

6. When and why the policy of recording actual measurements from weather stations into ADAM was modified through the placement of limits on the lowest temperature that an individual weather station could record;

7. Scrutiny of the methodology used by the Bureau in the remodelling of individual temperature series from ADAM for the creation of ACORN-SAT that is used to report climate change trends;

8. Scrutiny of the complex area weighting system currently applied to each of the individual series used in ACORN-SAT;

9. Clarification of the objectives of ACORN-SAT, specifically to ensure public expectations are consistent with the final product;

10. Clarification as to why statistically-relevant uncertainty values generally increase, rather than decreases with homogenisation.

Step 3 – Establishment of a formal Red Team*, setup independently of the Bureau, to formally advise the parliamentary committee mentioned in Step 2. In particular, the Red Team might:

11. Act to challenge, where appropriate, the evidence and arguments of the Blue Team (the Bureau);

12. Provide a genuinely open review environment so the parliamentarians (and public) can hear the counter arguments and evidence, including how homogenisation may have corrupted the official historical temperature record – and incorrectly suggest that every year is hotter than the previous;

13. Suggest lines of argument for the parliamentary committee to consider, and questions to ask.

Step 4 – As a government committed to innovation, the Bureau be told to consider alternative and more advanced techniques for the storage, quality assurance and reconstruction of historical datasets, in particular:

14. A two-day workshop be held at which the Bureau’s ACORN-SAT team (currently 2.5 people) be exposed to the latest quality assurance techniques and big-data methods – including the application of artificial neural networks for historical temperature reconstructions as an alternative to homogenisation.

In summary – This four-step process must be implemented as a matter of urgency. Incorrect historical temperature data currently underpins the theory of human-caused global warming that has resulted in government policies ostensibly to mitigate further global warming. These policies are costing the Australian economy hundreds of billions of dollars, and forcing-up the price of electricity for ordinary Australian families and businesses.

___________
* Red Team versus Blue Team exercises take their name from their military antecedents. The idea is that the Red Team provides evidence critical of Blue Team’s methodology (i.e. the Bureau’s temperature data handling and recording methods). The concept was originally applied to test force readiness in the military, and has since been applied to test physical security of sensitive sites like nuclear facilities, and also information security systems.

Filed Under: Information Tagged With: Temperatures

  • « Go to Previous Page
  • Go to page 1
  • Go to page 2
  • Go to page 3
  • Go to page 4
  • Go to page 5
  • Interim pages omitted …
  • Go to page 13
  • Go to Next Page »

Primary Sidebar

Recent Comments

  • Ian Thomson on Vax-ed as Sick as Unvax-ed, Amongst My Friends
  • Dave Ross on Vax-ed as Sick as Unvax-ed, Amongst My Friends
  • Dave Ross on Vax-ed as Sick as Unvax-ed, Amongst My Friends
  • Alex on Incarceration Nation: Frightened of Ivermectin, and Dihydrogen monoxide
  • Wilhelm Grimm III on Incarceration Nation: Frightened of Ivermectin, and Dihydrogen monoxide

Subscribe For News Updates

  • This field is for validation purposes and should be left unchanged.

November 2025
M T W T F S S
 12
3456789
10111213141516
17181920212223
24252627282930
« Jan    

Archives

Footer

About Me

Jennifer Marohasy Jennifer Marohasy BSc PhD has worked in industry and government. She is currently researching a novel technique for long-range weather forecasting funded by the B. Macfie Family Foundation. Read more

Subscribe For News Updates

Subscribe Me

Contact Me

To get in touch with Jennifer call 0418873222 or international call +61418873222.

Email: jennifermarohasy at gmail.com

Connect With Me

  • Facebook
  • LinkedIn
  • RSS
  • Twitter
  • YouTube

Copyright © 2014 - 2018 Jennifer Marohasy. All rights reserved. | Legal

Website by 46digital