• Skip to primary navigation
  • Skip to main content
  • Skip to primary sidebar
  • Skip to footer
Jennifer Marohasy

Jennifer Marohasy

a forum for the discussion of issues concerning the natural environment

  • Home
  • About
  • Publications
  • Speaker
  • Blog
  • Temperatures
  • Coral Reefs
  • Contact
  • Subscribe

Temperatures

Guilty of Agreeing to Meet with Scott Pruitt

May 4, 2018 By jennifer

SCOTT Pruitt heads the US Environmental Protection Agency. Last year he was planning to visit Australia, and the proposed agenda did include a two-hour roundtable with me and colleagues from three Australian universities.

Some of this is reported today in The Guardian.

Along with the inference I’m a nutter – because I have accused the Bureau of Meteorology of corrupting the temperature record.

The Australian public do have much confidence in the Bureau, as they have in the past had confidence in the Commonwealth Bank, Catholic Church – even the Australian cricket captain.

In the case of the banks and the churches, ordinary Australians were complaining for years before any action was taken. Now, the authorities are asking how could we have been so-misled for so long? Why was nothing done sooner – and why was the mounting evidence of wrong-doing ignored.

For some years I have been asking for an open, honest and independent inquiry into the operations of the Australian Bureau of Meteorology. In 2015, I wrote to the Auditor-General of Australia suggesting a performance audit with terms of reference to include: consistency with its own policies, and reliability of methodology. At the time my primary concern was the remodelling of temperature data through a process known as homogenisation.

In response, it was suggested I direct my concerns to Dr Ron Sandland AM, who at that time was chairing a Technical Advisory Forum to review these same issues, that I had previously raised with then Minister for the Environment, Hon. Greg Hunt MP. It was already clear to me that Dr Sandland and his team were undertaking a most cursory review and not working through a single example of homogenisation. I nevertheless made a submission to Dr Sandland’s Forum that has never been acknowledged.

As I detailed in a letter sent just this morning to Australia’s Chief Scientist, Alan Finkel, my issues continue to be less with the actual policies, protocols and best practice manuals already in place, but with increasing evidence these are being systematically ignored. This is exactly the issue that the current Royal Commission is finding with the banks – because it is not believing the documentation, but actually working through examples and establishing what happens in practice.

The Guardian would do well to consider my evidence closely – to stop parroting assurances from Bureau chief, Andrew Johnson, and work through an example of how data is remodelled.

I could detail many other areas of operation in which the Bureau blatantly and systematically disregards its own specific and correct policies.

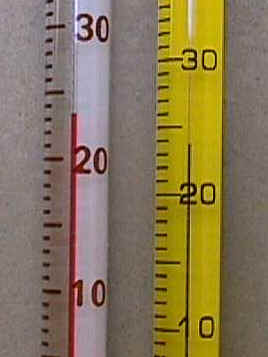
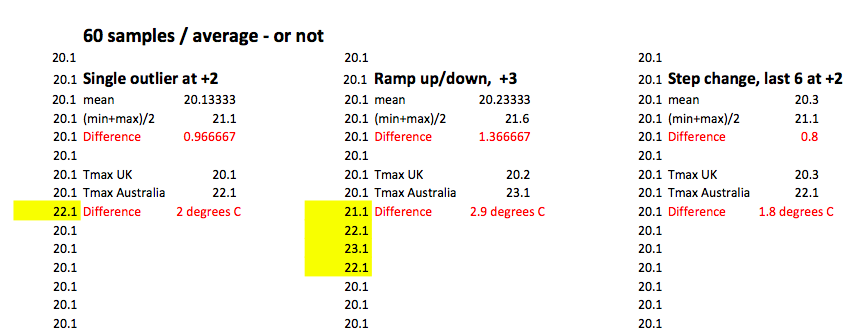
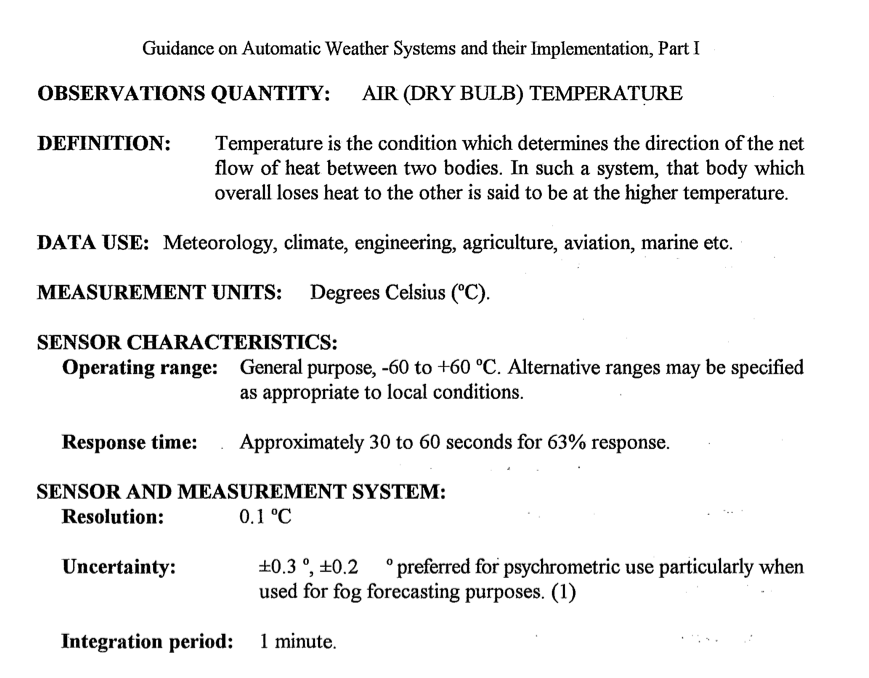
The one issue that I detailed for Alan Finkel is the way temperatures are currently measured in automatic weather stations by electronic probes. This goes to the heart of the integrity and reliability of temperature measurements recorded by the Bureau, subsequently homogenised, and incorporated into international databases – including those relied upon by the United Nation’s Intergovernmental Panel on Climate Change (IPCC).

I may have raised exactly this issue with Scott Pruitt. He would have been arriving in Australia in September, at about the same time that the Bureau handed down an internal review in which it admitted to having set limits on how cold temperatures could be recorded at both Goulburn and Thredbo in south eastern Australia.

When I first detailed the evidence for this at my blog in early July – I was considered a nutter by many. But after Alan Jones interviewed me on radio 2GB, and despite the Bureau strenuously denying it was setting limits, Environment Minister The Hon. Josh Freydenberg MP did asked for a review of the operations of the Bureau’s automatic weather stations.

On 7th September, just as the report was published, the Minister phoned me to let me know that the Bureau’s internal investigations confirmed that Goulburn and Thredbo were the only sites where temperature records had been affected by the inability of some Bureau automatic weather stations to read low temperatures… limits had indeed been set.

What are the chances? Of the Bureau’s 563 weather stations, I had stumbled across the only two with problems.

Guardian reporters like Adam Morton may continue to be dismissive and suggest those who doubt, including Scott Pruitt and me, are fools. But the real fools are those who fail to see that climate science falls well short of Popperian standards, rather engaging in all manner of tactics to defend absurd practices as detailed in my letter this morning to Alan Finkel. Indeed, it very much resembles the model of scientists behaving badly as described by Paul Feyerabend.

It is unfortunate that Scott Pruitt had to cancel his visit to Australia when Hurricane Harvey hit the Texas gulf coast – but the evidence against the Bureau for corrupting the temperature record remains.

Jennifer Marohasy visiting the automatic weather station at Goulburn in late July 2017.

Filed Under: Information Tagged With: Temperatures

BoM Blast for Dubious Record Hot Day

February 11, 2018 By jennifer

IN September 2017, the Australian Bureau of Meteorology (BoM) claimed a series of new record hot days across south eastern Australia, including on 23 September at Mildura. At that time, the mainstream media reported this as a new record for the state of Victoria, specifically claiming it was the hottest September day ever recorded – all the way-back to September 1889. This claim, however, cannot be verified because the BoM uses a non-standard method for recording temperatures at Mildura, and furthermore the parallel data provided to me in December 2017 as proof of equivalence is flawed and deficient.

Background

On 23 September 2017, a new record hot day for Victoria was claimed at the Mildura airport using an electronic probe in an automatic weather station (AWS) housed in a Stevenson screen.

The BoM claims that measurements from such devices are ‘comparable’ to measurements from traditional mercury thermometers, which were used to measure official air temperatures at Mildura from 13 June 1889 until 1 November 1996.

There is no documentation, however, supporting this contention for Mildura or any of the other nearly 500 AWS spread across the Australian continent. Furthermore, the BoM does not have World Meteorological Organisation, or any other form of accreditation (i.e. ISO 17025) for any of its AWS. In addition, the BoM uses a non-standard method of recording temperatures from such devices. Specifically, while one­-minute averaging of one­-second readings is standard across the world (e.g. in India, UK, Germany, Holland, Switzerland, Saudi Arabia and Kuwait) the BoM records the instantaneous highest one-second readings from a probe as the maximum temperature for that location for that day.

Given electronic probes generally respond more quickly to fluctuations in air temperature than mercury thermometers, it follows that this method – instantaneous recordings from an electronic probe – would result in new temperature maxima under the same weather conditions. The BoM, however, claims that temperature measurements from electronic probes are nevertheless ‘comparable’ with measurements from mercury thermometers because the BoM’s ‘purpose-designed’ probes ‘closely mirror’ the behaviour of liquid-in-glass thermometers, including the time constant.

While this is theoretically possible, to know if it is being achieved in practice it is necessary to analyse parallel measurements i.e. data from an electronic probe and mercury thermometer operating side-by-side for a period of time.

While the BoM has never released reports with parallel data supporting the claim of equivalence, in late October and early December 2017 a first and second lot of A8 forms were released to me – this followed my request to Minister Josh Freydenberg on 26 September for parallel measurements, and more specifically on 22 October for these A8 forms… immediately after I was informed by a whistle-blower that these forms contained the relevant information.

Parallel data from Mildura – preliminary findings

After I manually transcribed and analysed relevant data from a subset of the first batch of over 4,000 scanned A8 forms received on 28 October, I wrote to Minister Freydenberg on 12 November explaining that the values recorded manually on the A8 forms from the mercury thermometers for the period November 1996 to December 2000 at Mildura are significantly different from the official values recorded from the electronic probes.

Just considering the values for September, the mean difference is statistically significant at the 0.05 level of probability, and is +0.34 °C, +0.27 °C and +0.28 °C for the years 1997, 1998 and 1999, respectively. Somewhat surprisingly, the automatic weather stations at Mildura for these three Septembers recorded statistically significantly cooler temperatures than the mercury thermometers.

Analysis of the second lot of forms, received on 4 December, has proven more problematic because of the quality of the available data, and absence of critically important data.

The electronic probe that measured the record hot day on 23 September 2017 was installed on 27 June 2012 and I was initially told that there was parallel data only available through until January 2015. So, there is no reading from a mercury thermometer for Mildura for 23 September 2017.

After scrutiny of the A8 forms actually provided, however, it appeared that the extent of parallel readings for the probe installed on 27 June 2012 would be limited to just the eight months July 2012 to February 2013… except that the BoM had omitted to scan September 2012 – the one month that could provide a direct measure of the equivalence of the relevant probe for that time of year at that location. After informing the BoM of this omission, I have been told it is being looked-into… that the relevant officer will follow-up on the missing month of data.

Meanwhile, if we consider the residual available parallel data… the very hottest days according to readings from the electronic probe (30 November 2012, 18 January 2013, 5 January 2013, 8 January 2013, 6 January 2013, 1 December 2013, highest to lowest) have no equivalent reading from a mercury thermometer. In short, it appears that on the hottest days in Mildura – during the period that manual readings were being taken after installation of the most recent probe – no one was turning-up to take the manual reading from the mercury thermometer. As a consequence, the data for this period from the mercury thermometer is not normally distributed, as shown in Figure 1. This makes statistical analysis using standard techniques impossible as assumptions implicit, for example in a standard paired T-test, are violated.

Fig. 1. When the frequency of specific temperatures/data points as measured from the mercury thermometer at Mildura after July 2012 are plotted, it is evident that the data is not normally distributed. This makes statistical comparisons with measurements from the electronic probe problematic.

There are many more maximum temperatures measurements available for the electronic probe (n=948) than for the mercury thermometer (n=115), and the distribution is quite different, with a somewhat more normal distribution for the probe data, as shown in Figure 2.

Fig 2. Distribution of measurements from the electronic probe recording in an AWS.

Considering days when there is parallel data available in the temperature band of interest (the claimed-record hot day in September 2017 measured 37.7 degrees Celsius) the new probe has been found to measure up to 0.4 degrees hotter (e.g. 26 February 2013 the recording for the probe is 37.3, while the mercury thermometer recorded 36.9 on the A8 form). In fact, Table 1 shows that for the last month of available parallel measurements the electronic probe (Tmax-Probe) often recorded considerably warmer than the mercury thermometer (Tmax-LIG).

Tbl 1. This screenshot of the Excel file where I record the transcribed values shows that for the very last month of parallel recordings at Mildura, the electronic probe was often recording hotter than the mercury thermometer by up to 0.4 degree Celsius. (The abbreviation LIG stands for liquid-in-glass i.e. mercury and alcohol thermometers. Also, note that the measurements/data points shown here are as recorded on the A8 forms that are one full day different from the values in the CDO and ADAM databases… this is because the actual recording is of the temperature the afternoon before.)

In conclusion

While it is official BoM policy to ensure that there is approximately five-years of overlapping parallel data when there is a site move or equipment change at an official weather station, this policy appears to be rarely implemented. Indeed, while it would seem reasonable to assume that there would be dozens of reports detailing the results from such parallel studies – none have been made publicly available.

In the case of Mildura, the quality and length of the available parallel data makes it difficult to draw any real conclusions about the equivalence of measurements from the electronic probe installed in July 2012, with measurements from earlier probes and/or the mercury thermometer first installed back in 1889.

The issue of verifying the claimed record hot day on 23 September 2017 is compounded by the BoM’s method of measuring temperatures – in particular the absence of averaging over at least one minute which is standard for electronic probes.

****
The second chart and table were added to this post the next morning (12 Feb. 2018) – to aid understanding, and add clarity.

Filed Under: Information Tagged With: Temperatures

A Law Unto Themselves: The Australian Bureau of Meteorology

November 13, 2017 By jennifer

Sunday, 12th November 2017 – 4PM

Honourable Josh Frydenberg MP
Minister for Environment and Energy

Dear Minister

Re: Suspend announcement of new record hot days – Inform WMO that Bureau’s measurements are currently not comparable with mercury thermometers – Give directive for release of more A8 forms – Establish an audit mechanism

1. BACKGROUND

I write to confirm my receipt of some preliminary information from Mildura – you may remember that I wrote to you on 26th September suggesting that the new record hot day for Mildura announced by the Bureau of Meteorology of 37.7 degrees Celsius recorded on Saturday 23rd September, was unlikely to be a valid record because it was not measured consistent with calibration.

The Bureau have since acknowledged that their method of recording temperatures from electronic sensors is not accredited, though they claim it nevertheless gives readings equivalent to mercury thermometers. Interestingly, your office emailed a journalist, backing them up – claiming that a single electronic sensor can “mirror the behaviour of liquid in glass thermometers”. This is nonsense, because mercury and alcohol thermometers have different time constants. This is one reason the World Meteorological Organisation (WMO) insist on numerical averaging: alcohol thermometers (that measure temperature minima) have longer time constants than mercury thermometers (that measure temperature maxima).

Historically, alcohol thermometers were used to measure minimum temperatures, and mercury thermometers were used to measure maximum temperatures – across Australia. Then on 1 November 1996, the Bureau changed their ‘primary instrument’ to electronic sensors.

Anyway, I am grateful for the information recently received from the Bureau (following your directive), which does enable some comparison of measurements from a mercury thermometer with measurements from an electronic sensor, but only for Mildura for the period November 1996 to December 2000. I received this information in the form of over 4,000 scanned A8 forms, and have personally transcribed much of the relevant information, specifically the handwritten manual recording from the mercury thermometers.

2. MY PRELIMINARY FINDINGS

I can confirm, that the values recorded manually on the A8 forms from the mercury thermometers for the period November 1996 to December 2000 are significantly different from the official values recorded from the electronic sensors. If we consider just the values for September, the mean difference is statistically significant at the 0.05 level of probability, and is +0.34 °C, +0.27 °C and +0.28 °C for the years 1997, 1998 and 1999, respectively.

Somewhat surprisingly, the automatic weather stations at Mildura for these three Septembers recorded statistically significantly cooler temperatures than the mercury thermometers. (This is generally consistent with other values on the A8 forms, though winter and summer differences may be more extreme.)

This could suggest that the recent record hot day was in fact an underestimation of temperature. However, I’ve since been shown photographs that prove the electronic sensor in place at Mildura for those three years (1997, 1998, 1999) was shorter and thicker (with a correspondingly significantly longer time constant), than the Rosemount sensor that was in place on 23rd September 2017. Furthermore, the Bureau’s own documentation indicates that the Stevenson screen size has also changed – introducing yet another variable. Additionally, it has been brought to my attention that at that time – back in 1997, 1998 and 1999 – the official recorded temperatures were likely to be a numerical average taken over at least one-minute. The recent record was a one second-spot reading. I have confirmed this from the one-minute data for Mildura for 23rd September, also made available to me recently – following your directive.

While the current head, Andrew Johnson, claims the Bureau has always taken one-second readings from electronic sensors, this is at odds with a letter from Sue Barrell, Bureau of Meteorology, to Dr Peter Cornish dated 6th February 2013, available online here. The letter details a methodology much more consistent with World Meteorological Guidelines – specifically reference is made to numerical averaging.

The bottom line is that since the introduction of automatic weather stations over 20 years ago, there has been no documented standard against which Australian temperatures at Mildura, or anywhere else, have been recorded. Of most concern to me is the muddling, (including by your staffers), of the numerical averaging-period with the time constant. The Bureau somewhat confusingly often refers to the time constant as the sensor “averages”.

3. HISTORICAL TEMPERATURE RECORD

I have been reliably informed that when the various variables for Mildura are eventually determined – as they must – the actual hottest day on record for September for Mildura may be 22nd September 2003 or the 28th of September 1928 if temperatures before 1910 are ignored.

Interestingly, the hottest day ever for Mildura according to the official ACORN-SAT record is 10th January 1939; that summer of 1938-39 was exceptionally hot across south-eastern Australia. When I was researching the longer historical temperature record for Mildura a couple of years ago (at the same time I was correcting for Stevenson screen installations and moves from the post office to the airport in back-of-the-envelope type calculations), I determined that the hottest summer on record at Mildura was likely 1905/1906.

Backing this up, a relatively recent study published by Lucinda Coates and colleagues (Environmental Science and Policy, Volume 42, 2014) identified Januaries in 1879, 1896, 1906 and 1908 as being months with ‘significant heat events’ in Australia.

Our Bureau ignores this early pre-1910 historical temperature record, and after 1910 corrects for its political incorrectness through homogenisation as I have detailed elsewhere.

4. ECONOMIC IMPLICATIONS

Whilst the historical temperature record issued by the Bureau may have only been of limited, or academic interest, in the past this is no longer the case in view of the current scientific and public policy debate about global warming. These temperature recordings are now the primary input data which determine a range of scientific predictions, projections and model outputs with enormous, fiscal, economic and political implications both for Australia and internationally. If these temperature recordings are wrong then all the consequent scientific, fiscal, economic and political decisions based on this data may be wrong also.

On this basis, given the importance of the temperature record, I would suggest that there needs to be an ongoing and independent oversight audit mechanism/group established to ensure that you and the government can be confident that you are receiving reliable and accurate temperature records on which to base government policy decisions both nationally and internationally.

The fiscal records of government agencies are independently and regularly audited for amounts far less than the fiscal and economic impacts of global warming policies so it would seem only prudent and reasonable that the temperature records of the Bureau of Meteorology, which have such huge fiscal and economic impacts, should be subject to a similar audit regime to ensure their accuracy, integrity and reliability.

Historical temperature records back to 1880 are the primary input data which determine the range of scientific predictions, projections and model output with enormous fiscal, economic and political implications both for Australia and internationally.

Current and historical temperature records for Mildura, as measured and collated by the Bureau, are included in the calculation of global temperatures by the UK Meteorological office and NASA – subsequently relied upon by the United Nations Intergovernmental Panel on Climate Change informing the Paris Accord.

Perhaps unbeknownst to these organisations, our Bureau has a ‘novel’ method of recording temperatures from electronic sensors in automatic weather stations that cannot logically give readings consistent with the liquid-in-glass thermometers, which were the primary instruments for Australian temperature measurements until 1 November 1996.

5. RECOMMENDATIONS

Given the importance of the temperature record being correct: there is a need for an ongoing and independent oversight audit.

Inform the WMO that the temperatures recorded by our Bureau are not consistent with calibration, nor any international standard.

Direct the Bureau to desist from announcing new record hot days – not only for Mildura but for all 563 automatic weather stations recording surface temperatures across Australia.

Also, I would be grateful to receive more scanned A8 forms, specifically for the period 1 January 2001 until 30 September 2017 for Mildura. (It could be that I have only received A8 forms for Mildura until December 2000, as the Bureau is awaiting your directive to release the forms after this date.) I also await advice regarding the availability of scanned A8 forms from the other 38 locations with parallel data, as I detailed in my letter to you of 22nd October 2017.

Yours sincerely

Jennifer Marohasy BSc PhD
Senior Fellow, Institute of Public Affairs
Founder, Climate Modelling Laboratory, Noosa
Member, International AltMet Network

The assistance of AltMet Network members LP, KS, JV, MN, PC, PM and RM is gratefully acknowledged in the drafting of this letter.

Filed Under: Information Tagged With: Temperatures

Averaging by Convention – or Not

October 17, 2017 By jennifer

FOR some time, weather enthusiasts across Australia have been noticing rapid temperature fluctuations at the ‘latest observations’ page at the Australian Bureau of Meteorology’s website. For example, Peter Cornish, a retired hydrologist, wrote to the Bureau on 17 December 2012 asking whether the 1.5 degrees Celsius drop in temperature in the space of one minute at Sydney’s Observatory Hill could be a quirk of the new electronic temperature sensors. Ken Stewart, a retired school principal, requested temperature data for Hervey Bay after noticing a 2.1 degrees Celsius temperature change in the space of one minute on 22 February 2017.

So, begins my article to be published later today at The Spectator online, perhaps to be entitled ‘More Hot Days Caused by Purpose-Designed Temperature Sensors’. [That article was eventually published at both The Spectator and WUWT.]

But if you read a bit beyond the headline you will see that my issue is not so much with the temperature sensors as the way in which the Bureau is not averaging according to calibration. In particular, and to paraphrase some more from the article…

Beginning some twenty years ago, electronic sensors have progressively replaced mercury thermometers in weather stations across Australia. The sensors can respond much more quickly to changes in temperature, and on a hot day, the air is warmed by turbulent streams of ground-heated air that can fluctuate by more than 2 degrees on a scale of seconds. So, if the Bureau simply changed from mercury thermometers to electronic sensors, it could increase the daily range of temperatures, and potentially even generate record hot days simply because of the faster response time of the sensors.

Except to ensure consistency with measurements from mercury thermometers there is an international literature, and international standards, that specify how spot-readings from sensors need to be averaged – a literature and methodology being ignored by the Bureau.

To be clear, the UK Met office takes 60 x 1 second samples each minute from its sensors, and then averages these. In the US, they have decided this is too short a period, and the standard there is to average over a fixed 5-minute period. In Australia, however, the Bureau takes not five-minute averages, nor even one-minute averages, but just one second spot-readings.

Check temperatures at the ‘latest observations’ page at the Bureau’s website and you would assume the value had been averaged over perhaps 10 minutes. But it is dangerous to assume anything when it comes to our Bureau. The values listed at the ‘observations’ page actually represent the last second of the last minute. The daily maximum (which you can find at a different page) is the highest one-second reading for the previous 24-hour period: a spot one-second reading in contravention of every international standard. There is absolutely no averaging.

Then again, how many of you knew that the mean daily temperature as reported by meteorological offices around the world is not an average of temperatures recorded through the day but rather the highest and the lowest divided by two – as is the convention.

This convention developed because (surface) temperature measurements were originally instantaneous measurements from mercury thermometers recorded manually each morning (providing the minima) and afternoon (providing the maxima).

So, in the UK the daily maximum from a weather station with an electronic sensor will be the highest value derived from the averaging of 60 samples over that one minute interval, while in Australia, the daily maximum will be the highest one-second spot reading.

And, the method for averaging from the sensors does matter, as shown in the attached spreadsheet using synthetic values to illustrate this point, and summarized in Figure 1.

Scroll to the end of this post to download the entire spreadsheet with all 60 numbers for each worked example.

The values shown in the three-worked example fall well within the general range of variation possible within a one-minute interval considering highest, lowest and last second values as shown in some of the datasets purchased by Ken Stewart from the Bureau earlier this year.

In the first example, which could be symptomatic of ‘sensor noise’, there is a single outlier of 22.1 in the 60 one-second readings from the sensor. If these are averaged, as is done by the UK Met office, then the recorded temperature measurement for that minute is 20.1 degrees Celsius. If, however, the highest one-second value is recorded, which is the method applied in Australia, the recorded temperature would be 22.1 degrees Celsius. There is a whole 2 degrees of difference. If we apply the meteorological convention for generating mean daily values, then the difference is 1 degrees Celsius (0.9666 rounded).

In the second example, which could reflect a wind direction change, or jet plane exhaust, the difference between the UK Met office method of averaging over 1 minute versus the Australian method of taking a one second spot reading is the rather large 2.9 degrees Celsius.

In the third example, where there is a step change, the difference between the UK and Australian methods for treatment of sub-minute readings is 1.8 degrees Celsius.

More recently the Bureau have attempted to suggest yet another method of averaging, as detailed in their Fast Facts. But this is really just obfuscation, in more recent correspondence with me CEO Andrew Johnson has used the correct term when calculating how long it takes a sensor to adjust to a step change in temperature, which is ‘time constant’.

*****

The spreadsheet detailing the different averaging methods can be downloaded here: Averaging-NF-JM

I am blessed to be part of an Alt-Met network that includes Kneel (who sent me a first version of this spread sheet), Ken Stewart, Lance Pidgeon, Phill and others… thanks for the conversations.

Filed Under: Information Tagged With: Temperatures

Bureau Management Rewrites the Rules – Again

September 11, 2017 By jennifer

Following is the latest advice from the Australian Bureau of Meteorology regarding measurement of temperatures from automatic weather stations (AWS). This advice contains numerous errors of fact and is inconsistent with the information in an internal review issued just last Thursday.

The following misinformation has just been posted at the official Bureau website:
http://www.bom.gov.au/inside/AWS_Review_Fast_Facts.pdf

My responses to the inaccuracies in this document are prefaced with JM, and inserted herein.

FAST FACTS: How does the Bureau measure temperature?

1. The Bureau measures air temperature using an electronic sensor (a platinum resistance thermistor) placed within a Stevenson Screen, and temperature is recorded every second.

JM: No. The temperature is measured every second, it is not recorded every second by the Bureau. Rather, the Bureau has explicitly stated, most recently in an internal report released just last Thursday, that for each one minute temperature it only records the highest one-second temperature, the lowest one-second temperature, and the last one-second temperature – in that one minute interval. The Bureau does not record every one-second value. In the UK, consistent with World Meteorological Organisation Guidelines, the average temperature for each minute is recorded.

2. The air temperature fluctuates frequently on the scale of seconds. By using a sensor which has a longer response time than the fluctuations of the air temperature, the sensor “averages” these fluctuations.

JM: No. Electronic sensors have shorter response times than mercury thermometers. So, to ensure there is no discontinuity in measurements when the transition occurred from mercury thermometers to electronic probes the maximum and minimum values need to be calculated from one-second readings that have been averaged over at least one minute.

3. Both the mercury-in-glass thermometers, and the electronic sensors, are housed within a Stevenson Screen. The time taken for air to be exchanged from the outside environment to within the screen provides a further time integration for the measurement of the ambient air temperature.

JM: Noted.

4. The response time of the sensor used in the Bureau AWSs is as long or longer than the changes in the temperature of the air it is measuring.

JM: This may be the case. But the key issue has always been achieving consistency with measurements from the mercury thermometers – so there are no discontinuities in the temperature record with the transition from mercury thermometers to temperature probes. There was a report issued by the World Meteorological Organisation (WMO) in 1997 entitled ‘Instruments and Observing Methods’ (Report No. 65) that explained because the modern electronic probes being installed across Australia reacted more quickly to second by second temperature changes, measurements from these devices need to be averaged over a one to ten-minute period to provide some measure of comparability with the original thermometers.

5. This means that each one second temperature value is not an instantaneous measurement of the air temperature but an average of the previous 40 to 80 seconds. This process is comparable to the observation process of an observer using a “mercury-in-glass” thermometer. Are these methods consistent with international best practice?

JM: The two claims made in this dot point are not consistent with published studies. As regards ‘these methods’, if this is an attempt at justifying an instantaneous one-second reading, then the answer is: No. .

[Please also note the information as a postscript from Lance Pidgeon – scroll down to after the photograph of us both at Goulburn.]

6. The Bureau’s procedures comply with the World Meteorological Organization’s Guide to Meteorological Instruments and Methods of Observation (the CIMO Guide) WMO-No. 8 (2014 edition). The guide is available here.

JM: The guide at the said link clearly states on page 540 (Part 2, Section 1.3.2.4) that atmospheric air temperature be reported as 1 to 10 minute averages. Therefore, the Bureau’s procedures are not compliant with WMO guidelines.

7. The guide recommends that temperatures be integrated over time to smooth out rapid fluctuations. There is more than one method of achieving this. The WMO guidelines do not prescribe which method to take. In its automatic weather stations the Bureau achieves this by using platinum resistance thermometers. These are comparable to mercury in glass thermometers.

JM: No. The guide clearly states that readings from platinum resistance thermometers are not comparable with instant one-second readings from mercury in glass thermometers.

In summary, given the Bureau is taking one-second extrema, rather than following its own published guidelines (Instruments and Observing Methods Report No. 65, WMO/TD No. 862) recordings taken by the Bureau over the last twenty years from automatic weather stations across Australia may not be fit for purpose. In particular, temperature measurements from Australia since at least 1990 have not been recorded consistent with calibration, and therefore are likely to be invalid?

Jennifer Marohasy
11 September 2017 – 9pm

This advice is also provided as a PDF here: FAST FACTS -Refuted-V2

Jennifer Marohasy and Lance Pidgeon at the Goulburn AWS in early August 2017. Photograph courtesy of The Australian newspaper.

Comment from Lance follows as an important postscript

Following the link provided in the ‘Fast Facts’, I found this:

“It is recommended that the time constant, defined as the time required by the thermometer to register 63.2% of a step change in air temperature, should be 20 s. The time constant depends on the airflow over the sensor.”

This is a completely different thing to the sampling rate and averaging. It is describing the conditions BEFORE the one second sample rate not after.

This time, specifies the curve which is not an average. To compare an exponential decay curve to an average is wrong. If the curve time was over 60 seconds then the most recent would have most of the influence while the oldest would only have the influence of three timeconstants (63 percent of 63 percent of 63 percent).

A rule of thumb is that about 5 time constants need to pass before a reasonable measurement can be taken and 7 or more for an accurate measurment.

So is the BoM also trying to hide that this (before the averaging) time constant is also too short by confusing 5, 7 and 1 time constants as “40 to 80”?

Also, I just noticed that the standard calibration method looks to remove and ignore the noise during the procedure. In particular:

“Since the measurement instrument is an integral part of the electrical thermometer, its calibration may be checked by substituting the resistance thermometer by an accurate decade resistance box and by applying resistances equivalent to fixed 5 K temperature increments over the operational temperature range. The error at any point should not exceed 0.1 K. This work would normally be performed by a servicing technician.”

And with reference again to the ‘Fast Facts’, it is sad that the Bureau do not appear to understand the difference between a thermistor and a platinum resistance thermometer. I write this because the document that Jennifer has posted begins with reference to a ‘thermistor’ and ends with comment about a ‘platinum resistance thermometer’.

Lance Pidgeon
via Crookwell, near Goulburn
12 September 2017 – 8am

*****

As far as I can tell the 2014 document Lance quotes from (which the Bureau claim they are working in accordance with – though clearly they are not) is a someone garbled version of a technically solid report published in 1997, which includes the following advice:

An extract from ‘Instruments and Observing Methods Report No. 65, WMO/TD No. 862’

*****

According to the ‘Fast Facts’, the Bureau’s procedures comply with the World Meteorological Organization’s Guide to Meteorological Instruments and Methods of Observation (the CIMO Guide) WMO-No. 8 (2014 edition). Following are two important extracts from this document:

Uploaded by Jennifer on 14 September 2017 – for future reference.

Filed Under: Information Tagged With: Temperatures

John has Plus 10 Degrees, Bureau Loses Minus 10 Degrees

September 11, 2017 By jennifer

He studied chemistry at Imperial College, London, has 10 degrees, including a law degree, and has published more than 100 scientific papers. I’m referring to my husband, John Abbot. He is also a man of few words.

John Abbot standing in front of the Noosa River, Queensland – not far from the Climate Lab where he works on rainfall forecasting using artificial neural networks.

Last Friday morning, after flipping through the Australian Bureau of Meteorology’s latest 77-page internal report – Review of the Bureau of Meteorology’s Automatic Weather Stations – he looked up at me, and then said, “But this is all about you.”

The report begins by explaining that the Bureau has 695 automatic weather stations spread across Australia, and that data from this network underpins all of the services the Bureau delivers, enabling more than 500,000 public forecasts, and nearly 15,000 weather and ocean warnings which are issued each year. The report then goes on to explain that just two of these weather stations are “not fit for purpose” – Goulburn Airport (Goulburn) and Thredbo Top Station (Thredbo).

On the 5th and 18th July, respectively, I explained in detail at my blog that after temperatures below minus 10 degrees Celsius were measured by the Goulburn and Thredbo weather stations they were not subsequently recorded as such in the appropriate database by the Bureau.

While the Bureau strenuously denied it was setting limits on how cold a temperature could be recorded from any particular weather station, the Minister Josh Frydenberg nevertheless insisted on the review – and of the entire AWS network.

The Minister phoned me late on Thursday, to let me know that the review was done and that the investigation found that Goulburn and Thredbo were the only stations, out of the entire network, where temperature records had been affected.

What are the chances? Of the nearly 700 weather stations, I stumbled across the only two with problems!

Goulburn was discovered because my friend Lance Pidgeon lives nearby. He was up early on the morning of 2 July concerned his pipes were going to freeze and burst – while watching the live AWS temperature readings tick-over for that weather station. He then texted me when what appeared to be a new record for July of minus 10.4 was reached, only for us to both see this rounded-up to minus 10.0.

Thredbo was discovered because, after making a fuss about Goulburn, I wanted to check that the Bureau had actually lifted the limits on readings below minus 10. So, two weeks later I decided to get up early and watch for the lowest second-readings at one of the stations in the snowfields. Given the weather set-up that morning, I thought it might be cold across that region. Why did I choose Thredbo – of all the weather stations in the Australian Alps? Simply because my school friend Diane Ainsworth died in the landslide there twenty years ago.

“And I’m vindicated in that 77-page report,” I said to John Abbot – last Friday morning.

But unfortunately, neither the report, nor its recommendations are going to fix the more substantive issues that I have been raising since at least 2011 – when much of the city of Brisbane was flooded by emergency releases from a dam that was never meant to ever fill again, according to the best guesses from our Bureau.

Indeed, in the years preceding the flooding of Brisbane the Bureau’s own David Jones, Head of Climate Analysis, was often penning opinion pieces, including for the Sydney Morning Herald, that explained drought was the new norm for Australia. In an email, back in September 2007 he went as far as to say that: “climate change here in Australia is now running so rampant that we don’t need meteorological data to see it.”

Dr Jones could be characterised as a ‘true believer’. He is now the Head of Climate Monitoring and Prediction at the Bureau. Perhaps not surprisingly the Bureau keeps telling us that next year will be hotter than the last and that this last winter was the warmest on record – never mind the record number of frosts being tallied up by farmers across the south east.

For some years every minister responsible for the Bureau has successfully staved-off what must come eventually: a proper public review into the operations of this institution, which has lost its way. For some years, ministers responsible for the Bureau have been claiming that there can be no external review because there is a need to maintain public confidence – they seem to know that a transparent review and public confidence are incompatible.

The report pertaining to this latest internal review claims that even though there has been a strict limit on how cold temperatures could actually be recorded at Thredbo, Australia’s climate history has in no way been compromised. This is nonsense!

Since the year the new automatic weather station was installed at Thredbo – by coincidence the year my friend Diane died in the landslide – there has been a significant reduction in the number of days measuring minus 10 degrees or lower.

To be clear, and contrary to what is written in this latest report from the internal review, the equipment installed at Thredbo back in 1997 is world class. There is nothing wrong with the equipment, and it can record temperatures down to minus 60 degrees Celsius.

The problem is senior management at the Bureau, and specifically their instructions for how the equipment is to be operated.

For example, and to raise another issue: because the electronic probes in the new automatic weather stations are much more sensitive to temperature change than the previous liquid-in-glass thermometers, the one-second measurements from the new probes must be averaged over 1 to 10 minutes before taking a recording. This is detailed in various reports and is also World Meteorological Organisation policy. So, in the UK, the data loggers are set to automatically average over 1 minute; in the US, it is 5 minutes.

The Bureau has the correct documentation in place, with the key report – based on detailed experimental work undertaken here in Australia in the early 1990s – published back in 1997. But the Bureau is not actually following its own guidelines.

I have worked this out by comparing readings from different pages as displayed on the Bureau’s website. But according to the new internal review of AWS operations, this must stop. In particular, the review found, “the current data flow architecture creates situations where data can be delivered to, and displayed on, the Bureau’s website via multiple pathways and this can be potentially inconsistent and confusing for end users.”

I was initially confused but then treated the various anomalies from the perspective of a puzzle to be solved.

This new report does clarify many issues. Indeed, while I initially thought that the new limit of -10.0 degrees Celsius had just been put in place this winter – it is apparent from the report that it has been in place at Thredbo for ten years, since 2007. What is not clear is how a value that is measured below minus 10 by the equipment is actually recorded, with my observations suggesting that at Thredbo it ends up as blank, while at Goulburn it is rounded to minus 10.0.

Thredbo is not far from the peak of Australia’s highest mountain, Mt Kosciusko. Temperatures have been recorded at Thredbo since January 1966. On six separate days in 1968 temperatures dropped to -10 or below. On 23rd June 1968 temperatures dropped to -11.6. On 28th, 29th and 30th July of that year temperatures of -10.3, -10.6 and -10.1 were recorded. On 28 July 1980, a record low minus 14.7 was recorded. In July 1994, which was an exceptionally cold winter, minus 13.6 was recorded. Not far from Thredbo, at Charlotte Pass in June 1994, the all-time lowest minimum in Australia of minus 23 degrees Celsius was recorded.

During June and July of this year, blizzard conditions were experienced across the Australian Alps, but we will never know how cold it actually got. Because a MSI1 card reader prevented the equipment – able to record down to minus 60 – from recording below minus 10 at Thredbo and probably also at many other locations. It is also impossible to know how cold this last winter was relative to 1994 because the weather station at Charlotte Pass was closed in March 2015 – it is no longer in operation.

Earlier this year, specifically on Wednesday 26 July, I was interviewed by Alan Jones on radio 2GB. He has one of the highest rating talkback radio programs in Australia. From about 7.40 a.m. that morning we discussed my concerns, specifically about limits on how cold temperatures can be recorded at Thredbo.

According to the new internal report from the Bureau, and apparently by coincidence, the very next day, on 27 July the limits were lifted at Thredbo. After 10 years at least, the Thredbo weather station was able to record very low temperatures again.

‘Low’and behold: on 2 August, a minimum temperature of -10.9 was recorded at Thredbo.

It had been such a long time since such a cold temperature had been recorded at Thredbo – at least 15 years coincident with the installation of the card that prevented the measurement of temperatures below minus 10.4.

Rather than announce the lifting of the ban on very cold temperatures at Thredbo, that very same day, 2 August 2017, the Bureau announced that July 2017 had been the warmest on record – ever, for Australia.

Contrary to the Minister’s press release of last Thursday, core issues at the Thredbo weather station have not been fixed – and these are issues that also affect the other 694 weather stations. By its own admission in the report (page 22), the Bureau is recording one-second extrema from at all weather stations: it is not averaging these values over at least one minute as is standard practice in the UK, or over 5 minutes as is done in the US.

Recording one-second extrema (rather than averaging) will bias the minima downwards, and the maxima upwards. Except that the Bureau has been placing limits on how cold an individual weather station can record a temperature, so most of the bias will have been upwards over the last few years – in accordance with Dr Jones’ favourite story about man-made warming.

It is well and truly time for an open, transparent and independent external review of the Bureau, and its management.

And John Abbot would prefer that it wasn’t just about me. So, such a review would need to address the multitude of other issues that have been documented over the years including by Warwick Hughes, Ken Stewart, Joanne Nova, Maurice Newman and indeed also by John Abbot – most recently in the journal Atmospheric Research (volume 197, page 290) where he explains that the Bureau’s probabilistic seasonal rainfall forecasts are misleading.

****
A version of this article was first published at The Spectator Australia.

Filed Under: Information Tagged With: People, Temperatures

  • « Go to Previous Page
  • Go to page 1
  • Go to page 2
  • Go to page 3
  • Go to page 4
  • Interim pages omitted …
  • Go to page 13
  • Go to Next Page »

Primary Sidebar

Recent Comments

  • Ian Thomson on Vax-ed as Sick as Unvax-ed, Amongst My Friends
  • Dave Ross on Vax-ed as Sick as Unvax-ed, Amongst My Friends
  • Dave Ross on Vax-ed as Sick as Unvax-ed, Amongst My Friends
  • Alex on Incarceration Nation: Frightened of Ivermectin, and Dihydrogen monoxide
  • Wilhelm Grimm III on Incarceration Nation: Frightened of Ivermectin, and Dihydrogen monoxide

Subscribe For News Updates

  • This field is for validation purposes and should be left unchanged.

November 2025
M T W T F S S
 12
3456789
10111213141516
17181920212223
24252627282930
« Jan    

Archives

Footer

About Me

Jennifer Marohasy Jennifer Marohasy BSc PhD has worked in industry and government. She is currently researching a novel technique for long-range weather forecasting funded by the B. Macfie Family Foundation. Read more

Subscribe For News Updates

Subscribe Me

Contact Me

To get in touch with Jennifer call 0418873222 or international call +61418873222.

Email: jennifermarohasy at gmail.com

Connect With Me

  • Facebook
  • LinkedIn
  • RSS
  • Twitter
  • YouTube

Copyright © 2014 - 2018 Jennifer Marohasy. All rights reserved. | Legal

Website by 46digital