• Skip to primary navigation
  • Skip to main content
  • Skip to primary sidebar
  • Skip to footer
Jennifer Marohasy

Jennifer Marohasy

a forum for the discussion of issues concerning the natural environment

  • Home
  • About
  • Publications
  • Speaker
  • Blog
  • Temperatures
  • Coral Reefs
  • Contact
  • Subscribe

Temperatures

Fussing Over One Degree of Simulation

August 12, 2021 By jennifer

I was at the Australian National University in October 2018, when the largest supercomputer in the Southern Hemisphere began running the simulations that have now been published as the IPCC’s Assessment Report No. 6 (AR6). It’s being touted as the most comprehensive climate change report ever. It is certainly based on a suite* of very complex simulation models (CMIP6).

Many are frightened by the official analysis of the model’s results, which claims global warming is unprecedented in more than 2000 years. Yet the same modelling is only claiming the Earth is warming by some fractions of a degree Celsius! Specifically, the claim is that we humans have caused 1.06 °C of the claimed 1.07 °C rise in temperatures since 1850, which is not very much. The real-world temperature trends that I have observed at Australian locations with long temperature records would suggest a much greater rate of temperature rise since 1960, and cooling before that.

Allowing some historical perspective shows that the IPCC is wrong to label the recent temperature changes ‘unprecedented’. They are not unusual in magnitude, direction or rate of change, which should diminish fears that recent climate change is somehow catastrophic.

To understand how climate has varied over much longer periods, over hundreds and thousands of years, various types of proxy records can be assembled derived from the annual rings of long-lived tree species, corals and stalagmites. These types of records provide evidence for periods of time over the past several thousand years (the late Holocene) that were either colder, or experienced similar temperatures, to the present, for example the Little Ice Age (1309 to 1814) and the Medieval Warm Period (985 to 1200), respectively. These records show global temperatures have cycled within a range of up to 1.8 °C over the last thousand years.

Indeed, the empirical evidence, as published in the best peer-reviewed journals, would suggest that there is no reason to be concerned by a 1.5 °C rise in global temperatures over a period of one hundred years – that this is neither unusual in terms of rate nor magnitude. That the latest IPCC report, Assessment Report 6, suggests catastrophe if we cannot contain warming to 1.5 °C is not in accordance with the empirical evidence, but rather a conclusion based entirely on simulation modelling falsely assuming these models can accurately simulate ocean and atmospheric weather systems. There are better tools for generating weather and climate forecasts, specifically artificial neural networks (ANNs) that are a form of artificial intelligence.

Of course, there is nowhere on Earth where the average global temperature can be measured; it is very cold at the poles and rather warmer in the tropics. So, the average global temperature for each year since 1850 could never be a direct ‘observation’, but rather, at best, a statistic calculated from measurements taken at thousands of weather stations across the world. And can it really be accurately calculated to some fractions of a degree Celsius?

AR6, which runs to over 4,000-pages, claims to have accurately quantified everything including confidence ranges for the ‘observation’ of 1.07 °C. Yet I know from scrutinising the datasets used by the IPCC, that the single temperature series inputted for individual locations incorporate ‘adjustments’ by national meteorological services that are rather large. To be clear, even before the maximum and minimum temperature values from individual weather stations are incorporated into HadCRUT5 they are adjusted. A key supporting technical paper (eg. Brohan et al. 2006, Journal of Geophysical Research) clearly states that: ‘HadCRUT only archives single temperature series for particular location and any adjustments made by national meteorological services are unknown.’ So, the idea, that the simulations are based on ‘observation’ with real meaningful ‘uncertainty limits’ is just not true.

According to the Australian Bureau of Meteorology (BOM), which is one of the national meteorological services providing data for HadCRUT, the official remodelled temperatures are an improvement on the actual measurements. This may be so that they better accord with IPCC policy, with the result being a revisionist approach to our climate history. In general they strip the natural cycles within the datasets of actual observations, replacing them with linear trends that accord with IPCC policy.

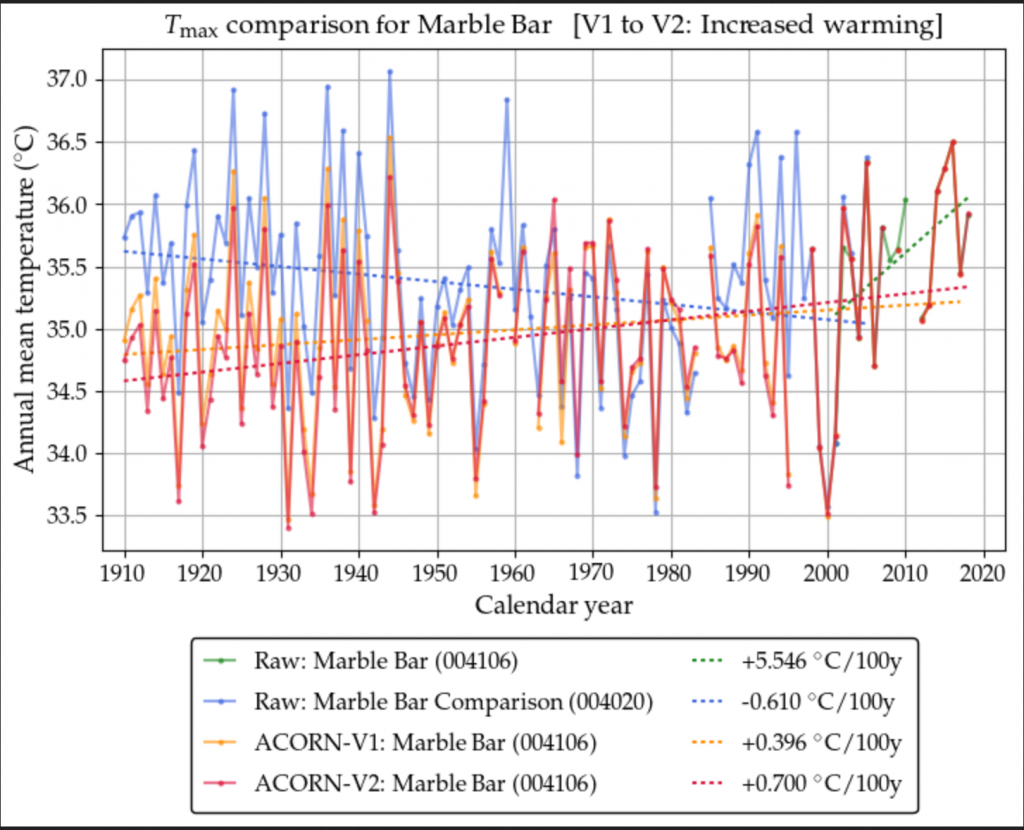
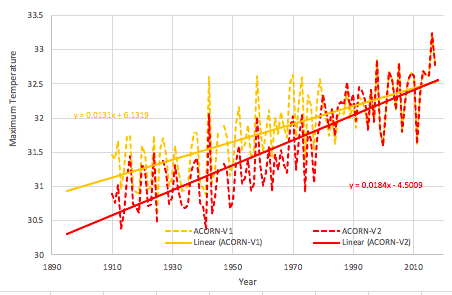
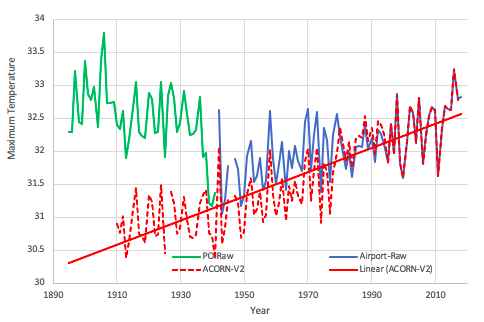
The BOM’s Blair Trewin, who is one of the 85 ‘drafting authors’ of the Summary for Policy Makers, in 2018 remodelled and published new values for each of the 112 weather stations used to calculate an Australian average over the period 1910 to 2016, so that the overall rate of warming increased by 23 %. Specifically, the linear trend (°C per century) for Australian temperatures had been 1 °C per century as published in 2012 in the Australian Climate Observations Reference Network − Surface Air Temperature (ACORN-SAT) database version 1. Then, just in time for inclusion in this new IPCC report released on Tuesday, all the daily values from each of the 112 weather stations were remodelled and the rate of warming increased to 1.23 °C per century in ACORN-SAT version 2 that was published in 2018. This broadly accords with the increase of 22% in the rate of warming between the 2014 IPCC report (Assessment Report No. 5) which was 0.85 °C (since 1850), and this new report has the rate of warming of 1.07 °C.

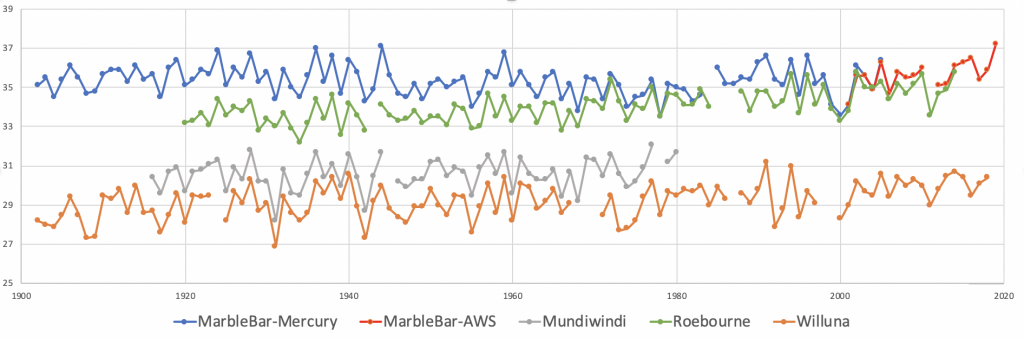
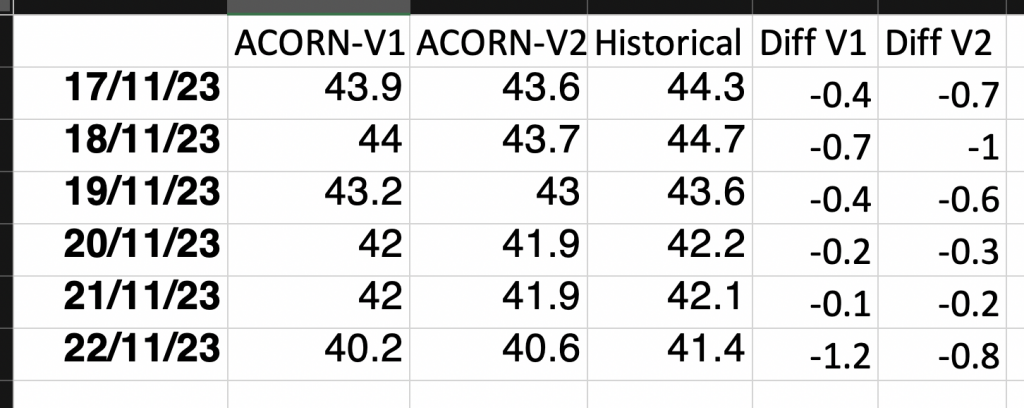
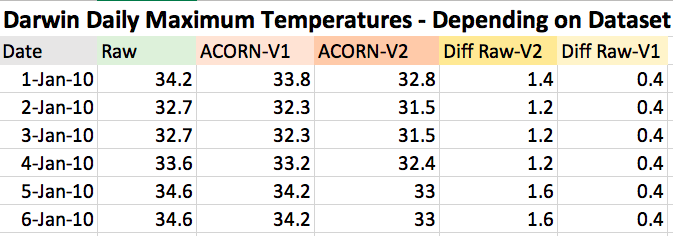
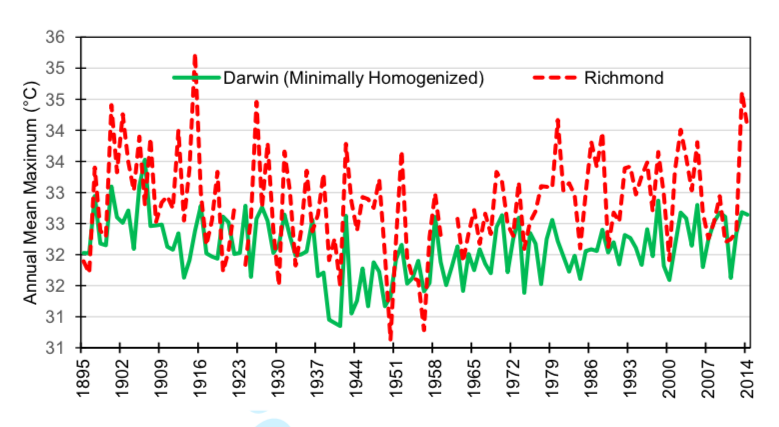
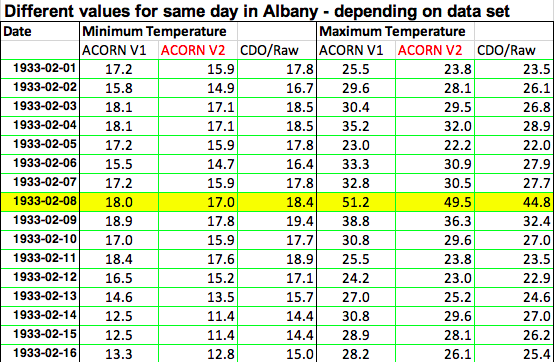
Remodelling of the data sets by the national meteorological services generally involves cooling the past, by way of dropping down the values in the first part of the twentieth century. This is easy enough to check for the Australian data because it is possible to download the maximum and minimum values as recorded at the 112 Australian weather stations for each day from the BOM website, and then compare these values with the values as listed in ACORN-SAT version 1 (that I archived some years ago) and ACORN-SAT version 2 that is available at the BOM website. For example, the maximum temperature as recorded at the Darwin weather station was 34.2 °C on 1 January 1910 (this is the very first value listed). This value was changed by Blair Trewin in the creation of ACORN-SAT version 1 to 33.8 °C. He ‘cooled’ this historical observation by a further 1.4 °C in the creation of ACORN-SAT version 2, just in time for inclusion in the values used to calculate a global average temperature for AR6. When an historic value is cooled relative to present temperatures, then an artificial warming trend is created.

I am from northern Australia, I was born in Darwin, so I take a particular interest in its temperature series. I was born there on 26th August 1963. A maximum temperature of 29.6 °C was recorded at the Darwin airport on that day from a mercury thermometer in a Stevenson screen, which was an official recording station using standard equipment. This is also the temperature value shown in ACORN-SAT version 1. This value was dropped down/cooled by 0.8 °C in the creation of ACORN-SAT version 2, by Blair Trewin in 2018. So, the temperature series incorporated into HadCRUT5, which is one of the global temperature datasets used in all the IPCC reports shows the contrived value of 28.8 °C for 26th August 1963, yet the day I born a value of 29.6 °C was entered into the meteorological observations book for Darwin. In my view, changing the numbers in this way is plain wrong, and certainly not scientific.

The BOM justifies remodelling because of changes to the equipment used to record temperatures and because of the relocation of the weather stations, except that they change the values even when there have been no changes to the equipment or locations. In the case of Darwin, the weather station has been at the airport since February 1941, and an automatic weather station replaced the mercury thermometer on 1 October 1990. For the IPCC report (AR5) published in 2014, the BOM submitted the actual value of 29.6 °C as the maximum temperature for Darwin on 26th August 1963. Yet in November 2018, when the temperatures were submitted for inclusion in the modelling for this latest report (AR6), the contrived value of 28.8 °C was submitted.

The temperature series that are actual observations from weather stations at locations across Australia tend to show cooling to about 1960 and warming since then. This is particularly the case for inland locations from southeast Australia. For example, the actual observations from the weather stations with the longest records in New South Wales were plotted for the period to 1960 and then from 1960 to 2013, for a presentation that I gave to the Sydney Institute in 2014. I calculated an average cooling from the late 1800s to 1960 of minus 1.95 °C, and an average warming of plus 2.48 °C from the 1960s to the present, as shown in Table 1. Yet this new United Nation’s IPCC report claims inevitable catastrophe should the rate of warming exceeds 1.5 °C, yet this can be shown to have already occurred at many Australian locations.

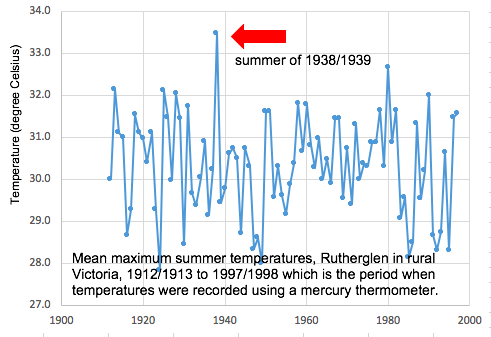
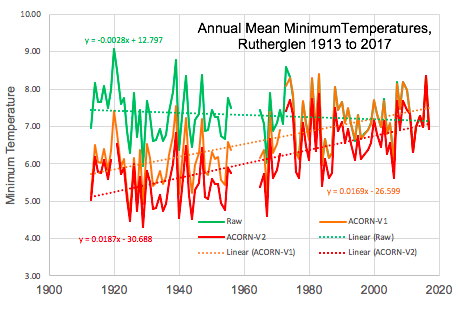
This is consistent with the findings in my technical report as published in the international climate science journal Atmospheric Research (volume 166, pages 141-149) in 2015, which shows significant cooling in the maximum temperatures at the Cape Otway and Wilsons Promontory lighthouses, in southeast Australia, from 1921 to 1950. The cooling is more pronounced in temperature records from the farmlands of the Riverina, including at Rutherglen and Deniliquin. To repeat, while temperatures at the lighthouses show cooling from about 1880 to about 1950, they then show quite dramatic warming from at least 1960 to the present. In the Riverina, however, minimum temperatures continued to fall through the 1970s and 1980s because of the expansion of the irrigation schemes. Indeed, the largest dip in the minimum temperature record for Deniliquin occurs just after the Snowy Hydroelectricity scheme came online. This is masked by the remodelled by dropping down/cooling all the minimum temperatures observations at Deniliquin before 1971 by 1.5 °C.

In my correspondence with the Bureau about these adjustments it was explained that irrigation is not natural and therefore there is a need to correct the record through remodelling of the series from these irrigation areas until they show warming consistent with theory. But global warming itself is not natural, if it is essentially driven by human influence, which is a key assumption of current policy. Indeed, there should be something right-up-front in the latest assessment of climate change by the IPCC (AR6) explaining that the individual temperature series have been remodelled before inclusion in the global datasets to ensure a significant human influence on climate in accordance with IPCC policy. These remodelled temperature series are then incorporated into CMIP6 which is so complex it can only be run only a supercomputer that generates so many scenarios for a diversity of climate parameters from sea level to rainfall.

In October 2018, I visited the Australian National University (ANU) to watch CMIP6 at work on the largest supercomputer in the Southern Hemisphere. It was consuming obscene amounts of electricity to run the simulations for this latest IPCC report, and it is also used to generate medium to long range rainfall forecasts for the BOM. The rainfall forecasts from these simulation models even just three months in advance are, however, notoriously unreliable. Yet we are expected to believe rainfall forecasts based on simulations that make projections 100 years in advance, as detailed in AR6.

There are alternative tools for generating temperature and rainfall forecasts. In a series of research papers and book chapters with John Abbot, I have documented how artificial neural networks (ANNs) can be used to mine historical datasets for patterns and from these generate more accurate medium and long-range rainfall and temperature forecast. Our forecasts don’t suggest an impending climate catastrophe, but rather that climate change is cyclical, not linear. Indeed, temperatures change on a daily cycle as the Earth spins on its axis, temperatures change with the seasons because of the tilt of the Earth relative to its orbit around the Sun, and then there are ice ages because of changes in the orbital path of the Earth around the Sun, and so on.

Taking this longer perspective, considering the sun rather than carbon dioxide as a driver of climate change, and inputting real observations rather than remodelled/adjusted temperature values, we find recurrent cycles greater than 1.07 degrees Celsius during the last 2000 years. Our research paper entitled ‘The application of machine learning for evaluating anthropogenic versus natural climate change’, published in GeoResJ in 2017 (volume 14, pages 36-46) shows a series of temperature reconstructions from six geographically distinct regions and gives some graphic illustration of the rate and magnitude of the temperature fluctuations.

ANNs are at the cutting edge of AI technology, with new network configurations and learning algorithms continually being developed. In 2012, when John Abbot and I began using ANNs for rainfall forecasting we choose a time delay neural network (TDNN), which was considered state-of-the-art at that time. The TDNN used a network of perceptrons where connection weights were trained with backpropagation. More recently we have been using General Regression Neural Networks (GRNN), that have no backpropagation component.

A reasonable test of the value of any scientific theory is its utility – its ability to solve some particular problem. There has been an extraordinary investment into climate change over the last three decades, yet it is unclear whether there has been any significant improvement in the skill of weather and climate forecasting. Mainstream climate scientists, and meteorological agencies continue to rely on simulation modelling for their forecasts such as the CMIP6 models used in this latest IPCC report – there could be a better way and we may not have a climate catastrophe.

* Following comment in the following thread from Greg Goodman on 15th August, I have added in the word ‘suite of’ because it is the case that CMIP6 is a project rather than a model, it is a project that runs a suite of simulation models.

Further Reading/Other Information

The practical application of ANNs for forecasting temperatures and rainfall is detailed in a series of papers by John Abbot and me that are listed here: https://climatelab.com.au/publications/

Chapter 16 of the book ‘Climate Change: The Facts 2020’ provides more detail on how the Australian Bureau of Meteorology takes a revisionist approach to Darwin’s history, click here:
https://climatechangethefacts.org.au/2021/08/09/rewriting-australias-temperature-history/

There is an interactive table based on the maximum and minimum values as originally recorded for each of the 112 Australian weather stations used to calculate the official temperature values as listed in ACORN-SAT version 1 and version 2 at my website, click here:
https://jennifermarohasy.com.dev.internet-thinking.com.au/acorn-sat-v1-vs-v2/

The feature image, at the top of this blog post, shows Jennifer Marohasy in front of the supercomputer at the Australian National University in October 2018, which was running simulations for the latest IPCC report.

Filed Under: Information Tagged With: Temperatures

Hottest Day Ever in Australia Confirmed: Bourke 51.7°C, 3rd January 1909

July 10, 2020 By jennifer

The Australian Bureau of Meteorology deleted what was long regarded as the hottest day ever recorded in Australia – Bourke’s 125°F (51.7°C) on the 3rd January 1909. This record* was deleted, falsely claiming that this was likely some sort of ‘observational error’, as no other official weather stations recorded high temperatures on that day.

However, Craig Kelly MP has visited the Australian National Archive at Chester Hill in western Sydney to view very old meteorological observation books. It has taken Mr Kelly MP some months to track down this historical evidence. Through access to the archived book for the weather station at Brewarrina, which is the nearest official weather station to Bourke, it can now be confirmed that a temperature of 50.6°C (123°F) was recorded at Brewarrina for Sunday 3rd January 1909. This totally contradicts claims from the Australian Bureau of Meteorology that only Bourke recorded an extraordinarily hot temperature on that day.

Brewarrina Meteorological Observations Book, January 1909 — photographed by Craig Kelly MP. Note 123F recorded at 9am on 4th January 1909.

Just today, Friday 10th July 2020, Mr Kelly MP obtained access to this record for Brewarrina, the closest official weather station to the official weather station at Bourke.

He has photographed the relevant page from the observations book, and it shows 123°F was recorded at 9am on the morning of Monday 4th January 1909 – published here for the first time. This was the highest temperature in the previous 24 hours and corroborates what must now be recognised as the hottest day ever recorded in Australia of 51.7°C (125°F) degrees at Bourke on the afternoon of Sunday 3rd January 1909.

The Meteorological Observations Book for Bourke for January 1909 records 125°C for 3rd January. Photograph taken on 26th June in 2014 at the Chester Hill archive by Jennifer Marohasy.

These images are from more complete pages that were photographed and can be accessed here: https://jennifermarohasy.com.dev.internet-thinking.com.au/reinstate-hottest-day/

That the Bureau of Meteorology denies these record hot days is a travesty. Is it because these records contradict their belief in catastrophic human-caused global warming?

The temperature of 50.6°C (123°F) recorded back in 1909 which is more than 100 years ago, photographed by Mr Kelly today at the National Archives in Chester Hill, is almost equivalent to the current official hottest day ever for Australia of 50.7 degrees Celsius at Oodnadatta on 2nd January 1960. These are in fact only the fourth and third hottest days recorded in Australia, respectively.

Not only has Mr Kelly MP tracked-down the meteorological observations book for Brewarrina, but over the last week he has also uncovered that 51.1°C (124°F) was recorded at White Cliffs for Wednesday 11th January 1939. This is the second hottest ever!

The evidence, a photograph from the relevant page of the White Cliff’s meteorological observations book, is published here for the first time.

This photograph from the White Cliffs Meteorological Observation Book shows the second hottest temperature ever recorded in Australia using standard equipment in a Stevenson screen.

Until the efforts of Mr Kelly MP, this second hottest-ever record was hidden in undigitised archives.

It is only through the persistence of Mr Kelly to know the temperatures at all the official weather stations in the vicinity of Bourke that this and other hot days have been discovered.

If we are to be honest to our history, then the record hot day at Bourke of 51.7°C (125°F) must be re-instated, and further the very hot 50.6°C (123°F) recorded for Brewarrina on the same day must be entered into the official databases.

Also, the temperature of 51.1°C (124°F) recorded at White Cliffs on 12th January 1939 must be recognised as the second hottest ever.

For these temperatures to be denied by the Bureau because they occurred in the past, before catastrophic human-caused global warming is thought to have come into effect, is absurd.

At a time in world history when Australians are raising concerns about the Chinese communist party removing books from Libraries in Hong Kong, we should be equally concerned with the Australian Bureau of Meteorology removing temperature records from our history.

If global warming is indeed the greatest moral issue of our time, then every Australian regardless of their politics and their opinion on greenhouse gases and renewable energies, must be honest to history and these truths.

____

* This temperature (125°F/51.7°C on the 3rd January 1909) was recorded at an official Bureau weather station and using a mercury thermometer in a Stevenson screen. Hotter temperatures were recorded in 1896 but the mercury thermometers were not in Stevenson screens, which is considered the standard for housing recording equipment.

The feature image shows Craig Kelly MP at The Australian National Archive, Chester Hill, just today examining the Brewarrina Meteorological Observations book.

The following YouTube video is of me being interviewed on Sky Television by Chris Smith last December 2019.

I have previously blogged on the record hot day at Bourke being deleted by the Bureau here:
https://jennifermarohasy.com.dev.internet-thinking.com.au/2017/02/australias-hottest-day-record-ever-deleted/

Filed Under: Information Tagged With: Temperatures

Warming Marble Bar

March 1, 2020 By jennifer

MY friend Craig Kelly – the Federal member for Hughes – attempted to raise the issue of the world’s longest heat wave record in the Australian parliament last Wednesday. He was shut down by Tony Burke, the manager of opposition business.

Specifically, Mr Kelly was attempting to draw attention to how the historical observations have been changed, and how the values as originally recorded at Marble Bar between 31 October 1923 and 7 April 1924 have been adjusted down. This was first brought to our attention by Chris Gilham, and reposted by Joanne Nova.

When the Australian Bureau of Meteorology cools the past – as it does with most of the 112 temperature series used to construct the official statistics – current temperatures appear hotter. The remodelling of Marble Bar has, to quote Mr Kelly, also robbed Australia of the world’s longest heatwave record. This now goes to Death Valley in California.

The Bureau has made many more changes to the Marble Bar record, than just dropping down the temperatures back in 1923 and 1924. With the first iteration of ACORN-SAT back in 2011, maximum temperatures as recorded at Marble Bar from 1967 back to 1910 were cooled on average by -0.41 °C, and from 1944 back to 1910 by an additional -0.52°C.

The Bureau claimed these changes were necessary because the weather station at Marble Bar has been moved, the moves created discontinuities in the temperature series, and these discontinuities can only be ‘corrected’ with reference to neighbouring sites.

In fact, the weather station at Marble Bar has always been just to the southeast of the town centre, on vacant public land on the edge of the Great Sandy Desert, which covers an area of about 284,993 km². There is no documentation for any move in 1944. In 1967 the weather station was apparently moved some metres. The distance is recorded as ‘small’ in the relevant catalogue.

The Bureau nevertheless identified weather stations at Mundiwindi (about 300 kms south), Wiluna (about 700 km south) and Roebourne (about 300 km east) as neighbouring stations suitable for comparison, specifically for fixing the perceived ‘discontinuity’ in 1944 created by the apparent station move.

The annual average maximum temperatures from the comparison sites move up and down in unison with the Marble Bar data including for the period from 1930 to 1940, as shown in Figure 1. This suggests that there is nothing wrong with the historical temperature observations for Marble Bar. And that feeding these stations together into the percentile matching algorithm would result in only minimal changes.

Figure 1. Maximum Temperatures Recorded at Marble Bar and Comparison Stations

The Bureau has listed Mundiwindi, Roebourne and Wiluna as comparison stations for Marble Bar.

Yet, the cumulative changes made to the original observations from Marble Bar in the creation of the new ACORN-SAT series (using the ‘nearby’ stations) make the new ACORN-SAT series less like the data from the nearby comparison stations.

The consequence of the changes to the maximum temperature series is that what was a cooling trend for Marble Bar of -0.6 °C per century from 1910 to 2005 in the original historical observations, becomes a warming trend of +0.396 °C per century from 1910 to 1918 in ACORN-SAT version 1, as shown in Figure 2. When ACORN-SAT version 1 was updated late 2018 to ACORN-SAT version 2, an even more significant +0.7 °C warming trend was generated for Marble Bar. ACORN-SAT version 2 is now the official temperature data base for Australia.

Figure 2. Historical Observations (blue) and Remodelled (red and orange)

The historical observations for Marble Bar (the raw data) from 1910 to 2005 indicate a cooling trend, this has been changed to a warming trend of 0.7 degrees Celsius per century in ACORN-SAT Version 2.

CHANGES TO INDIVIDUAL DAYS VERSUS CUMULATIVE

While the cumulative consequence of all the changes is a warming trend +0.7 °C Celsius per century in ACORN-SAT version 2, the changes are actually made to the daily values, as shown in Table 1.

Table 1. Temperatures for Six Days in November 1923

The daily values as recorded in the different databases for Marble Bar.

So while the actual temperature recorded at Marble Bar on 18th November 1923 was 44.7 °C, this has been changed to 43.7 in ACORN-SAT version 2. This is a difference of one whole degree, as shown in Table 1.

The difference is only 0.2 degrees on 21st November. This lack of consistency in the fiddling is because the Bureau applies what is called a percentile matching algorithm to generate the new temperature series. To quote from the relevant peer-reviewed paper as published by the Royal Meterological Society (International Journal of Climatology, Volume 33):

For the purposes of merging station series and correcting inhomogeneities, the data set has been developed using a technique, the percentile-matching (PM) algorithm, which applies differing adjustments to daily data depending on their position in the frequency distribution. This method is intended to produce data sets that are homogeneous for higher-order statistical properties, such as variance and the frequency of extremes, as well as for mean values. The PM algorithm is evaluated and found to have clear advantages over adjustments based on monthly means, particularly in the homogenization of temperature extremes.

TWO TEMPERATURE DATA BASES

Not many people are aware that the Bureau actually holds two very different temperature databases. Mostly, it uses what is called ACORN-SAT version 2 (Australian Climate Observations Reference Network – Surface Air Temperature) for generating trends and announcing record hot years. This database also contains all the values that are sent to the United Nation’s International Panel for Climate Change (IPCC).

The other database includes the historical values more or less as originally recorded. This is called the Australian Data Archive for Meteorology (ADAM), also known as the Climate Data Online (CDO). This database has a reasonable amount of integrity and generally reflects values actually recorded across Australia. There are nevertheless some issues with ADAM. The mix of stations is changing, with stations that have recorded colder temperatures closed down. For example, Charlotte Pass on the slopes of Mount Kosciuszko holds the record for the coldest temperature ever recorded on mainland Australia at −23 °C on 19 June 1994. Inexplicably, this station was closed down in March 2015. Also of concern is that there was a period when lower limits were set on how cold temperatures could be recorded, for example the limit that was set at Goulburn of −10 °C between the years 2007 and 2017 and at Thredbo between 2002 and 2017.

Also, some ‘inconvenient’ early hot records have been deleted, for example 51.7 °C recorded at Bourke in western New South Wales on 3 January 1909. This record needs to be reinstated as it is the hottest day ever recorded in Australia using standard equipment, properly calibrated and in a Stevenson Screen. The Bureau’s only excuse for deleting it is that it was recorded on a Sunday, and the weather observer was not meant to come in on that day.

The existence of these two date bases is not denied by the Bureau, but interestingly key Australian Broadcasting Corporation journalists cannot bring themselves to acknowledge this fact. This is perhaps because of all the complications it raises.

LET US GET IT CHANGED BACK

The Bureau has a long history of making nonsense changes to important historical temperature data series. I’ve previously documented the situation at Rutherglen (Victoria), Bourke (New South Wales), Darwin (Northern Territory) and Amberley (Queensland).

I’ve been trying to get something done about this since at least 2014. Ministers within the current cabinet who are across this issue include Greg Hunt and Josh Frydenberg. So far, they have refused to do anything about it, because they apparently do not want the Australian public to lose confidence in the Bureau.

I suggest we begin a campaign, in the first instance to have the correct temperatures for Marble Bar for the period of the heatwave, which was from 31 October 1923 to 7 April 1924, included in the official temperature record. This will require the Bureau to notify the relevant IPCC working group that is currently incorporating the incorrect values into their Sixth Assessment report, which is being used for the first global stocktake under the Paris Agreement.

Filed Under: Information Tagged With: Temperatures

Hottest Summer in Australia was 1938/1939

March 12, 2019 By jennifer

THIS last summer has been hot in Australia. But was it the hottest ever? Summer 80 years ago was arguably as hot, if not hotter. Back then more ferocious bushfires burnt larger areas.

Yet Australia’s Environment Minister, Melissa Price, recently claimed this summer’s bushfires as a consequence of climate change. I grew up with stories from my late father of terrible bushfires – infernos – back in 1939. The Black Friday bushfires destroyed four times the area of farmland and forest as the devastating February 2009 fires – and twenty times as much as burnt this last summer. Ash from that bushfire fell as far away as New Zealand.

My father described hot and hungry years in rural Victoria back then – just as John Steinbeck described farm life in the mid-west of the US in the 1930s in his famous ‘Grapes of Wrath’. There was hardship, and there were dust storms in the US and also in south-eastern Australia.

In rural Victoria, the summer of 1938-1939 was on average at least two degrees hotter than anything measured with equivalent equipment since.

Mean maximum summer temperatures as measured at Rutherglen in rural Victoria for the period when mercury thermometers were used.

Yet Minister Price denies this history – my late father’s history. She is relying on temperature data that has been extensive remodelled. This remodelling is justified by the Australian Bureau of Meteorology on the basis that temperatures are now measured using a non-standard method (spot readings) from non-standard equipment (custom built probes in automatic weather stations). Apparently, we need to know how hot it was back then, relative to the equipment used now.

On 13 January 1939 my father was living not far from Rutherglen, near Australia’s longest river, the Murray River. He described a hot wind blowing from the north west.

The Rutherglen agricultural research station has one of the longest, continuous, temperature records for anywhere in rural Victoria. Minimum and maximum temperatures were first recorded at Rutherglen using standard and calibrated equipment back in November 1912. Considering the first 85 years of summer temperatures – unadjusted/not homogenized – the very hottest summer on record at Rutherglen is the summer of 1938/1939.
While this last summer of 2018/2019 was hotter according to Minister Price, such a claim would not pass scrutiny if assessed for the Guinness Book of records – because of all the changes to the way temperatures are now measured at Rutherglen relative to that summer back in 1938/1939.

At Rutherglen, the first big change happened on 29 January 1998. That is when the mercury and alcohol thermometers were replaced with an electronic probe – custom built to the Australian Bureau of Meteorology’s own standard, with the specifications still yet to be made public.

According to Bureau policy, when such a major equipment change occurs there should be at least three years (preferably five) of overlapping/parallel temperature recordings, except the mercury and alcohol thermometers (used to measure maximum and minimum temperatures, respectively) were removed on exactly the same day the custom-built probe was placed into the Stevenson screen at Rutherglen, in direct contravention of this policy.

In 2011, the Bureau made further changes in that it stopped averaging one-second readings from the probe at Rutherglen over one minute. The maximum temperature as recorded each day at Rutherglen is now the highest one-second spot reading from the custom-built probe. That is correct – spot reading.

So, to reiterate, we now have a non-standard method of measuring (spot readings) from non-standard equipment (custom-built probes) making it impossible to establish the equivalence of recent temperatures from Rutherglen – or any of the Bureau’s other 695 probes in automatic weather stations spread across the landmass of Australia – with historical data.

Then there is the remodelling – with the most recent remodelling creating Version 2 of ACORN-SAT. This has resulted in an overall 23 per cent increase in the rate of warming between Versions 1 and 2 for the 112 weather stations that comprise ACORN-SAT. This is the database used by the Bureau and the CSIRO to monitor climate change across Australia.

At Rutherglen, a modest rate of warming in the raw maximum temperatures of 0.7 degrees Celsius per Century has been changed to 1.3 degrees Celsius in ACORN-SAT Version 2. Changes to the minimum temperature trend are more dramatic: a slight cooling trend of 0.3 degrees Celsius has been changed to warming of 1.9 degrees in ACORN-SAT Version 2 for Rutherglen.

Annual mean minimum temperatures at Rutherglen (1913-2017). Raw temperatures (green) show a mild cooling trend, which is changed into warming in Version 1 of the remodeled ACORN-SAT. The warming is exaggerated in Version 2 of ACORN-SAT.

This remodelling – known as homogenisation – involves the detection of discontinuities and then adjustments which generally result in past temperatures being cooled relative to the present. By cooling the past, present temperatures appear hotter. For example, considering maximum temperatures at Rutherglen, the largest single drop-down (adjustment) to daily temperatures occurs from 1 January 1938 back in time. The Bureau classifies the hot summer of 1938/1939 as a ‘discontinuity’ that is ‘statistical’ in ‘cause’ and then cools all the days before 31 December 1938 by 0.6 degrees Celsius back to 1912 – the beginning of the record.*

This is an embarrassment to the scientific method, and an insult to the 71 lives lost on 13 January 1939.

To repeat, the Bureau does not deny making these changes. Rather it claims such changes to Rutherglen’s temperature history are necessary to show what the temperature would be back then, using today’s equipment. But there was no actual change in the equipment between Versions 1 and 2 of ACORN-SAT for Rutherglen. So, this reason makes no sense.

The remodelling of Rutherglen, and the other 111 stations that comprise ACORN-SAT is extensive and misleading. It was correctly described as ‘fraud’ by commentator Rowan Dean on Sky Television on Sunday 10th March.

So why did, for example, the Bureau drop the minimum daily temperatures by a further 2.6 degrees Celsius on the day of the Black Friday bushfire? To be clear, the minimum temperature on the day of the Black Friday bushfire at Rutherglen was measured as 28.3 degrees Celsius. This value is changed to 27.8 degrees Celsius in ACORN-SAT Version 1, a reduction of 0.5 degrees Celsius. In Version 2, the temperature is reduced further, now archived as just 25.7 degrees Celsius for 13 January 1939 – a reduction of 2.6 degrees from the original temperature as actually recorded on that day.

There is a real history of rural Victoria: 71 men and women did perished in that bushfire back on 13 January 1939. According to my late father, it was extraordinarily hot and the wind was blowing from the north west.

The Bureau has never put a media release out letting the Australian public know that there is a Version 2 of ACORN-SAT, with even cooler historical temperatures for Rutherglen and most of the rest of Australia than in Version 1 that was only published in 2012.

Just a few years ago, the minister then responsible for the Bureau, Greg Hunt, was claiming that ACORN-SAT Version 1 was the world’s best practice and the correct temperature history of Australia. Now, we have ACORN-SAT Version 2, and temperatures overall have been warmed a further 23 percent relative to Version 1.

The remodelling by the Bureau is industrial-scale: this is necessary to generate a consistent global warming trend that does not exist in the raw unhomogenized data from rural and regional Australia.

There are consequences for future generations in this remodelling. It affects how we understand the relationship between climate and bushfires. Also, by continually reducing past temperatures, there is potential for new record hot days, record hot summers and hottest years for even cooler weather. Recommend wellbutrin buy .

This is nonsense – consistent with how the Bureau now measures and remodels our temperature history.

A different version of this article was first published at The Spectator: https://www.spectator.com.au/2019/03/the-hottest-summer-on-record-except-for-the-ones-that-weve-changed/

—
*I’m quoting from the ‘Adjustment Summary’ for ACORN-SAT Version 1 published in September 2014.

Filed Under: Information, News Tagged With: temperates, Temperatures

Changes to Darwin’s Climate History are Not Logical

February 23, 2019 By jennifer

THE hubris of the Australian Bureau of Meteorology is on full display with its most recent remodelling of the historic temperature record for Darwin. The Bureau has further dramatically increased the rate of global warming at Darwin by further artificially lowering historic temperatures.

This begins by shortening the historical temperature record so that it begins just after the very hot years of the Federation drought. Then by changing the daily values: that is changing the observed measured temperatures to something else.

For example, on 1st January 1910 the maximum temperature recorded at the Darwin post office was 34.2 degrees Celsius.

A few years ago, the Bureau changed this to 33.8 degrees Celsius, cooling the recorded temperature by 0.4 degrees. In its most recent re-revision of Darwin’s climate history the temperature on this day has been further reduced, and is now just 32.8.

The daily maximum temperatures for early 1910 as shown in the three different datasets for Darwin

Environmental reporter for the Australian newspaper, Graham Lloyd, asked the Bureau why it had made such changes earlier in the week. A spokesperson is quoted in The Weekend Australian as follows:

“For the case of Darwin, a downward adjustment to older records is applied to account for differences between the older sites and the current site, and difference¬s between older thermometers and the current automated sensor.

“In other words, the adjustments estimate what historical temperatures would look like if they were recorded with today’s equipment at the current site.”

Yet this is a version of exactly the same reason given by the Bureau just six years ago for reducing the temperature on 1 January 1910 by ‘only’ 0.4 degrees.

Neither the equipment, nor the site has changed since ACORN-SAT Version 1 was published in 2012.

Yet another 1 degree has been shaven from the historical temperature record!

To be clear, the weather station has been at the airport since February 1941, and an automatic weather station was installed on 1 October 1990. A Stevenson screen was first installed at the post office site in 1894, and has always been used at the airport site.

So, why was the temperature dropped down by a further one degree for 1 January 1910 in the most recent revision – undertaken just a few months ago? There is no logical or reasonable explanation.

Apparently, at the Bureau, the future is certain and the past can be continually changed – history can be continually revised.

When the daily values are added-up, and compared between versions as annual mean maximum temperatures we see the magnitude of the change – and its effect on temperature trends.

The warming trend of 1.3 degrees C per 100 years in ACORN V1 has been changed to 1.8 degrees C per 100 years in Version 2. The annual average maximum temperature for 1942, as one example, has been reduced by 0.5 degrees.

The extent of global warming increases from 1.3 degrees Celsius per 100 years to 1.8 degrees Celsius in the latest revisions by the Bureau to Australia’s temperature history.

In the maximum temperature record as actually measured at Darwin from 1895 to the present — and taking into consideration the move from the airport to the post office –- there is no warming trend in the Darwin temperature record. This is consistent with other locations in northern Australia with long high-quality records, for example Richmond in north western Queensland.

Annual mean maximum temperatures as measured at Richmond, Qld, charted with a minimally homogenized series for Darwin that combines the post office and airport series into one continuous temperature series making adjustments only for the move to the airport.
Mean maximum annual temperatures as measured at the Darwin Post Office and airport shown with the new remodeled ACORN-SAT Version 2, which is the new official record for Australia.

What the Bureau has done to the historical temperature record for Darwin is indefensible. The Bureau has artificially shortened and cooled Darwin’s climate history to make it consistent with the theory of human-caused global warming.

Ends.

Filed Under: Information Tagged With: Temperatures

Bureau Rewrites History – Again, at Albany

February 16, 2019 By jennifer

THE Australian Bureau of Meteorology keeps remodelling the temperature record for Australia – and not just by a little bit. Temperatures are changed through a process known as homogenisation, and then changed again, sometimes by as much as 6.4 degrees Celsius for the one day.

The temperatures as actually measured at Albany, and other places, has been changed by the Bureau in the development of the official temperature record for Australia.

For example, on 8th February 1933 the maximum temperature as measured at Albany in Western Australia was 44.8 degrees Celsius. Then, six years ago it was changed to 51.2 degrees Celsius! Recently it was changed again, this time to 49.5.

Changing the temperature record like this is not unusual for institutions such as the Australian Bureau of Meteorology, though the extent of the change for Albany on this day in 1933, and also the direction of the change, is unusual.

Usually past temperatures are cooled relative to the present as part of remodelling, which is called ‘homogenisation’. Cooling the past relative to the present has the effect of exaggerating global warming.

Given the magnitude and direction of this change to the Albany temperatures, which was first made six years ago, several of us asked the Bureau: ‘Why’?

Why was the temperature at Albany on this day (February 8, 1933) adjusted-up by so much (6.4 degrees) in the official version 1 of the ACORN-SAT dataset that was published six years ago?

I never got an answer.

I have simply been told, mostly via the mainstream media, that homogenisation is world’s best practice, and that ACORN-SAT is scientific.

Of course, it is not scientific to make such changes to temperature measurements, though this type of change – this remodelling – is standard practice not only for our Bureau but also for the custodians of the global temperature datasets relied upon by the IPCC (United Nation’s Intergovernmental Panel on Climate Change).

While ACORN-SAT Version 1 contains remodelled temperature values that can vary from the actual recorded measurement by more than 6 degrees, the values in this same database are often referred to as ‘observations’ as though they represent real measurements. For example, when leading climate scientist Sophie Lewis and David Karoly published a paper in the American Meteorological Society journal about ‘extreme events’ they erroneous refer to ACORN-SAT Version 1 values as ‘observations’.

Indeed, ACORN-SAT Version 1 has underpinned almost all the climate change work at our universities and at CSIRO over the last 6 years.

Most climate scientists seem to want to believe that the temperature values that they are working with represent real measurements. But they don’t!

Just recently this ACORN-SAT database – used by Lewis, Karoly and thousands of other scientists here in Australia and also overseas – was updated. Dr Blair Trewin at the Bureau has re-adjusted temperature values yet again, creating ACORN-SAT Version 2.

In the case of Albany, the maximum temperature on 8th February 1933 is now shown as 49.5 degrees Celsius. In reality it the maximum temperature in Albany on that day back in 1933 was 44.8 degrees Celsius.

The integrity of the historical temperature record is of extraordinary importance. This record also underpins belief in catastrophic human-caused global warming.

Perhaps today’s front-page story in The Australian newspaper by Graham Lloyd will generate some interest in how and why our climate history can be so change, apparently at the whim of the Bureau and other such institutions around the world.

I wait, and I hope.

Filed Under: Information Tagged With: Temperatures

  • Go to page 1
  • Go to page 2
  • Go to page 3
  • Interim pages omitted …
  • Go to page 13
  • Go to Next Page »

Primary Sidebar

Recent Comments

  • Ian Thomson on Vax-ed as Sick as Unvax-ed, Amongst My Friends
  • Dave Ross on Vax-ed as Sick as Unvax-ed, Amongst My Friends
  • Dave Ross on Vax-ed as Sick as Unvax-ed, Amongst My Friends
  • Alex on Incarceration Nation: Frightened of Ivermectin, and Dihydrogen monoxide
  • Wilhelm Grimm III on Incarceration Nation: Frightened of Ivermectin, and Dihydrogen monoxide

Subscribe For News Updates

  • This field is for validation purposes and should be left unchanged.

November 2025
M T W T F S S
 12
3456789
10111213141516
17181920212223
24252627282930
« Jan    

Archives

Footer

About Me

Jennifer Marohasy Jennifer Marohasy BSc PhD has worked in industry and government. She is currently researching a novel technique for long-range weather forecasting funded by the B. Macfie Family Foundation. Read more

Subscribe For News Updates

Subscribe Me

Contact Me

To get in touch with Jennifer call 0418873222 or international call +61418873222.

Email: jennifermarohasy at gmail.com

Connect With Me

  • Facebook
  • LinkedIn
  • RSS
  • Twitter
  • YouTube

Copyright © 2014 - 2018 Jennifer Marohasy. All rights reserved. | Legal

Website by 46digital