• Skip to primary navigation
  • Skip to main content
  • Skip to primary sidebar
  • Skip to footer
Jennifer Marohasy

Jennifer Marohasy

a forum for the discussion of issues concerning the natural environment

  • Home
  • About
  • Publications
  • Speaker
  • Blog
  • Temperatures
  • Coral Reefs
  • Contact
  • Subscribe

sea level change

Heron Island Corals: Still Constrained by Sea Level Fall

August 20, 2019 By jennifer

MY mother lived and worked on Heron Island at the Great Barrier Reef in 1955. That was the same year the young Bob Endean established the University of Queensland Heron Island Research Station. He went on to become a famous marine biologist, and instrumental in the formation of the Great Barrier Reef Marine Park Authority (GBRMPA) in 1975.

There are photographs of my mother, then Joan Edith Pearce, standing knee deep surrounded by Porites coral micro atolls that are stunted and bleached. I showed one of these at my talk entitled ‘Climate Change Concern’ at the Maroochydore Surf Life Saving Club on 14th July. This has now been made into a YouTube:

The growth of corals back in 1955 at Heron Island was constrained by their inability to continue to grow-up, because sea levels were not rising. This continues to be the situation today — despite what you might to be told on the nightly news.

In fact, a peer-reviewed technical paper by L. Scopelitis et al. published in the journal ‘Coral Reef’ (2011) and rather curiously entitled ‘Coral colonisation of a shallow reef flat in response to rising sea level: quantification from 35 years of remote sensing data at Heron Island, Australia’ explains that the period 2002 to 2007 has been the most constrained for Heron Island corals since at least 1940. This is apparently because they have reached their vertical limit for growth, and there has been no sea level rise.

The single biggest threat to the Great Barrier Reef is sea level fall. Sea levels did fall some 30 centimetres during the recent super El Nino event of 2015/2016 as I explain in the YouTube presentation.

This is not a large amount considering that the tidal range at Heron Island on any one day can be anything from 1 to 3 metres.

But 30 centimetres is enough to result in bleaching of the top 30 centimetres of a coral that may be subject to sunshine on the exposed reef flat for perhaps an hour.

Heron Island is a coral cay that formed perhaps 6,000 years ago, perhaps following a violent storm when a large pile of coral rubble and broken shells was left above the high tide mark. It has grown since then.

The incident of bleaching due to low sea levels associated with El Nino events has been documented at other Great Barrier Reef islands back 3,000 years by Helen McGregor at Wollongong University.

I’m specifically thinking of her paper entitled ‘Coral micro atoll reconstructions of El Nino-Southern Oscillation: New windows on seasonal and inter annual processes’, which was published in the journal ‘Past Global Changes’ (volume 21) in 2013. By dissecting micro-atolls — the type shown in the picture of my mother at Heron Island back in 1955 — it is possible to understand that sea level has been a constraint to coral growth at the Great Barrier reef for at least this long: at least 3,000 years.

The distinctive micro-atoll form is a result of continual exposure to heat and sunlight at extremely low tides, which result, of course, in low sea levels.

****

I’m leaving Noosa tomorrow for the Great Barrier Reef. If you would like to be updated on my work there — with a drone pilot and underwater photographer — considering subscribing for my irregular email updates:https://jennifermarohasy.com.dev.internet-thinking.com.au/subscribe/

Filed Under: Information, News Tagged With: Great Barrier Reef, sea level change

Recent Sea Level Fall – Since When?

July 9, 2019 By jennifer

ALWAYS in search of an ultimate truth, I’m rarely one to admit that everything is relative. When it comes to shorelines and the age of ‘wave cut platforms’, however, there is no escaping it … the relativism.

The sea and the climate are modelling our coastline as a sculptor might work a piece of clay … except over a longer time frame, and the shoreline is made of materials that are much tougher and much less consistent than clay. I’m specifically referring to the coastal sandstones, and also the granites, and even the igneous intrusions (from past volcanoes), along the coastal track from Main Beach at Noosa Heads to Hell’s Gates in Noosa National Park.

Geological time can be thought of in terms of the last few thousand years, the last few 100 thousand years, and also in terms of millions of years.

Over these periods sea levels along the east coast of Australia have risen, and fallen, and risen again. The factors causing the change in sea level over these time periods can be understood in terms of the varying orbits, tilts and wobbles of the Earth around the Sun, and also the varying levels of radiation emitted from the Sun. There are other factors. For example, varying declination of the moon may cause a 18.6 year pattern in sea levels. But this is unlikely to leave a mark on the shoreline … unless there are corals, as I will discuss at the Maroochydore Surf Lifesaving Club this Sunday*.

*****************************
If you are coming on Sunday, please book here: https://www.trybooking.com/book/event?eid=520591

******************************

Waves pound at cliff faces. Sometimes until they are cut back to sea level.

So, along the east coast of Australia – along the path I often walk from Hasting Street/Main beach to Hell’s Gates – and back, I find what are called by geologists ‘wave cut platforms’.

This photograph was taken looking north from Granite Bay, early one Sunday morning in June.

These ‘wave cut platforms’ exist where the sea has cut into the cliff face, creating a flat area that we would expect to be at sea level.

Well … we would expect the wave cut platform to be at sea level only if sea levels did not change.

If sea levels are rising then these platforms should be underwater.

The potholes in the rock platform to the north of Tea Tree Bay are above the high tide mark. These holes in the sandstone are thought to be formed from boulders working as grinding stones in the surf, as explained in the comments thread of a previous blog post.

These rock pools are known as potholes by geologists. This photographs was taken from my drone late in the afternoon, to the north of Tea Tree Bay, Noosa National Park. Can you see me in the photograph … I’m there, looking up?

Mostly, I see wave cut platforms above sea level. Yet, the east coast of Australia is often defined by geologists as a “relatively young sea-coast” — for example in W.J. Dakin’s book entitled ‘Australian Seashores’.

Where there are rock platforms that are well defined, yet a couple of metres or so above the highest tides, is this perhaps evidence that sea levels have fallen relatively recently. But exactly when?

This blog post is partly a shout-out to knowledgeable geologists …

Considering the coastline in these pictures taken from my new drone (called Skido):

1. When are the sandstone platforms likely to have been cut by the waves?

2. Would the rock platform with the pot holes have been cut during the last inter-glacial period from perhaps 140,000 to 120,000 years ago?

3. Is there any evidence of the more recent Holocene high-stand, which I understand to have been about 6,000 years?

I understand that sea levels were about 2 metres higher 120,000 years ago, and about 1.5 metres higher 6,000 years ago?

According to Warwick Willmott’s book entitled ‘Rocks and Landscapes of the Sunshine Coast’ the headlands of Noosa, Coolum and Point Cartwright were islands during the last inter-glacial.

In between this last-interglacial and the beginning of the Holocene (some 11,600 years ago) we had a fall in the sea level of about 150 metres along the Sunshine Coast – I’m quoting again from Warwick Willmott.

I should like to take some photographs of the underwater platforms that are evidence of the 150 metre fall in sea level. So, how far off the coast will I need to send my drone?

*****************
UPDATE 11 JUNE 2019

I’ve walked over these potholes at high tide, and was sure the surf didn’t get that far … but I had to check, and get some photographs to be sure. So, I went this afternoon for what was a relatively high tide of 2.0 metres at 4.30pm. The highest for this year was 2.32 metres on 22nd January. The second highest will be on 1st August at 2.27 metres.

Anyway, following are three photographs (from today on the highest tide) to provide additional perspective.

A screen shot from video of the pot holes, this time on a very high tide.

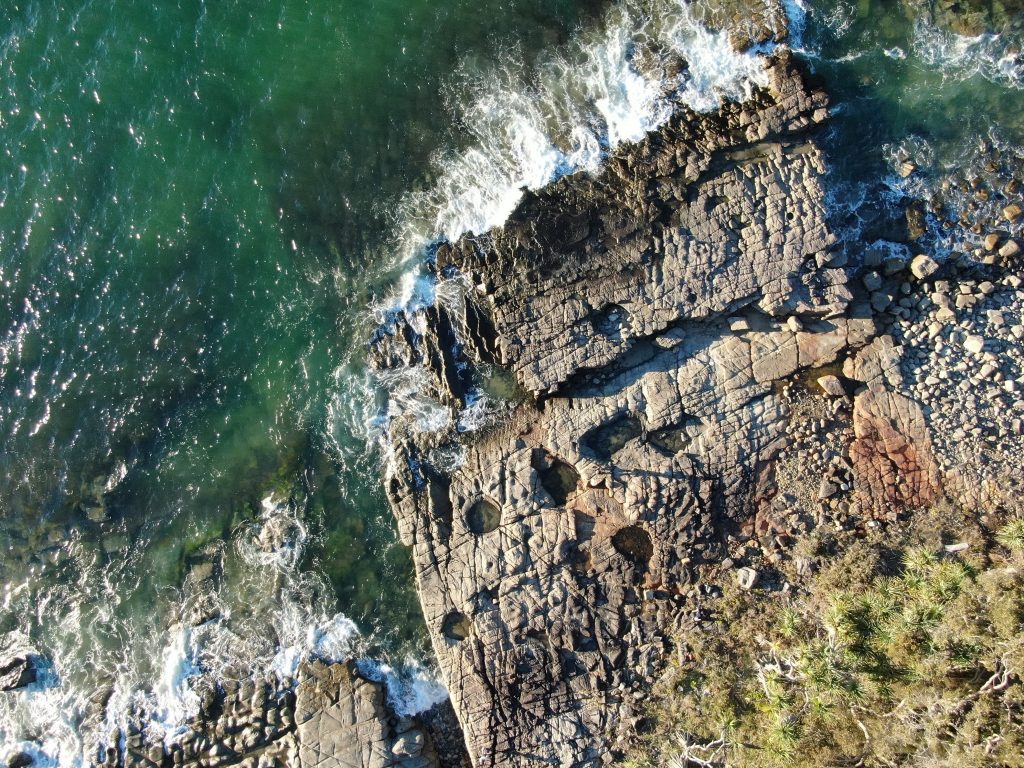
A photograph of the pot holes, on the very high tide today, 11th July 2019./caption]

****

*I shall be showing these photographs of rocky landscapes, and many more of corals, at the Maroochydore Surf Lifesaving Club this Sunday (14th July) at 2pm. Coral can give us an indication of sea level fall over much shorter time frames, for example, since 1950 as I will show on Sunday.

Everyone is welcome at the surf club, entry is $10, please register online here. The instructions are to go to Level 3, which is the Conference Room. The address is 36 Alexander Parade, Maroochydore. I’m told the $10 includes afternoon tea!

Filed Under: Information Tagged With: sea level change

Season’s Greetings, Tuvalu and Thank You Mr Kelly

December 23, 2018 By jennifer

HALFWAY between Hawaii and Australia lies the tiny nation of Tuvalu, which according to popular mythology is slowly disappearing into the Pacific Ocean because of rising sea levels. Except a recent article at the ABC news website correctly explained that in the four decades to 2014, Tuvalu has actually grown by 73 hectares.

How can this be? The mainstream news media reporting something factual – even though it contradicts their catastrophic anthropogenic global warming (CAGW) meme!

It all began with my favourite federal politician, Craig Kelly MP … a relentless warrior for all that is logical and reasonable.

Craig Kelly and Jennifer Marohasy in Townsville a couple of years ago.

Mr Kelly always takes a keen interest in the detail of issues that concern his electorate in Sutherland just south of Sydney, and his objective of late has been fair electricity prices. This objective resulted in something of an obsession by Mr Kelly with the draft National Energy Guarantee legislation – the NEG. In fact, this objective, that became a concern, that developed into an obsession, brought down a Prime Minister. It also caused the ABC Fact Check team to take an interest in his speeches and recently declare him correct, at least on the issue of Tuvalu.

Let me begin this story on 13th August when then Prime Minister Malcolm Turnbull insisted that a meeting of the Coalition’s Energy and Environment Committee, which is chaired by Craig Kelly, be in the prime minister’s cabinet room in his presence at 9pm that Monday night … rather than as usual at 8am in a standard committee room, immediately before the usual party room meeting which is at 9am on the Tuesdays that federal parliament is sitting.

The NEG legislation had been in development for over one year, but Mr Kelly had only ever been given one-page summaries. From these, early in 2018, Mr Kelly had understood that the Paris Target would be for 2030 and could be backloaded, so much of the emissions reduction could be, for example, in a decade’s time after the ever-promised improvement in the reliability and price of renewable sources of energy. Further, there would be no interim target, and the cost of the intermittency of the generators would be borne by the intermittent generators themselves. This meant that those ostensibly providing electricity to the grid were obliged to provide it when called upon, or else they would pay a penalty. These points were all important provisions in the draft legislation that Mr Kelly had lobbied for.

Then, there was rumbling that there would be an interim target, and that there could even be an annual emissions reduction target … that the Prime Minister was requesting as much.

This was in perhaps June, and Mr Kelly protested. “We don’t need to make Paris more onerous than it already is,” he complained to his parliamentary colleagues.

Mr Kelly became further concerned when it became apparent in July that the cost of the intermittency of generation could be borne by the large industrial users. That is, when the wind didn’t blow the bigger manufacturers would need their own backup … their own diesel generators.

These were all concerns that Mr Kelly made known to Mr Turnbull. But most importantly, he wanted to see the actual legislation – the text, the detail.

The meeting of the Energy and Environment Committee that Monday night – held in the room normally reserved for the Cabinet, and most unusually attended by the Prime Minister – lasted about two hours. By the end of it, seven members said they would support the Prime Minister and the legislation. Former Prime Minister Tony Abbot, now a backbencher and a new member of that committee, said he was opposed to it. Queensland Liberal-National MP Ken O’Dowd said he was undecided. That was also the position of Mr Kelly: he insisted that before he could endorse the NEG he needed to see the fine print – he needed more than a one-page summary.

Mr Kelly repeated this concern the next day in the party room, while eyeballing the Prime Minister.

That week parliament finished-up on Thursday. The next day, on Friday 17th August, soon after 6pm – soon after the journalists would have filed their stories for the weekend papers – Prime Minister Turnbull made a major announcement regarding the NEG. The emissions reduction target that was being proposed at 26 percent by 2030 would be set by regulation – not parliament.

Craig Kelly was now angry, because this meant that there could be future increases in the renewable energy target at the discretion of whoever was the Minister at the time. Labour wanted the target set at 45 percent and could achieve as much if they won the next election without so much as consulting the people or the parliament. What Mr Kelly saw as a major lever of the economy – the price and reliability of electricity – could be changed at the stroke of a Minister’s pen, if Prime Minister Turnbull had his way.

Mr Kelly went into overdrive – against the NEG and the Prime Minister, and for democracy.

It was reported that Mr Kelly appeared to be on a “kamikaze mission”. Further, the mainstream media reported he was going to lose preselection because he was so out of touch and being so unreasonable.

In fact, within the week it would be Prime Minister Turnbull, not Craig Kelly, who was out of his job.

Mr Kelly spent the weekend phoning colleagues. Monday it was announced that the legislation would be withdrawn. Tuesday morning at the party room meeting Mr Turnbull stood aside, declaring a spill.

Mr Kelly didn’t have a plan for Peter Dutton or Scott Morrison to become Prime Minister, but he had had enough of Turnbull’s NEG and his concerns were resonating.

To be clear, if Craig Kelly thought that by Australians paying more for their electricity, we could save the planet, he would have supported the NEG and a high renewable energy target. But in Mr Kelly’s view arguing about a NEG of 26 or 45 percent is like arguing about how many fairies fit on a pin head – it is about chimerical wish-fantasies. Even a NEG of 100 percent would have no effect on global temperatures, but it would have a real and deleterious effect on Australian industries reliant on affordable and reliable energy and it would also negatively impact his constituents already struggling to pay their electricity bill.

And Mr Kelly’s concerns go further than this, he is of the opinion that the planet does even need saving – at least not from CAGW. Typical of many so-called sceptics, Mr Kelly is not sceptical of climate change. Rather by reading in some detail about the Earth’s history he realises that the climate has always changed.

Further, as John Abbot and I explain in our recent article in GeoResJ*, there is nothing unusual about the speed or magnitude of climate change over the last 100 or so years. For the last 1,000 to 2,000 years, temperatures have fluctuated within a channel of plus or minus 1 degree Celsius. It is only studies using remodelled data, suspect algorithms and cherrypicked datasets – that generate hockey-sticks. Considering the majority of published studies, in the best journals, global temperatures, including in Sweden, are about as hot now as they were 1,000 years ago.

I mention Sweden, because children in Australia that want the federal government to stop climate change have apparently been following the lead of a Swedish school girl: fifteen-year old Greta Thunberg who has been demonstrating outside the Swedish parliament to stop climate change. That was until she set off with her father in an electric car for the United Nations climate talks in Poland. There she explained that the climate crisis is “the biggest crisis that humanity has ever faced”.

This fake news has been reported uncritically by the world’s media. In fact, they have reported her as wise and brave … causing two fourteen-year old girls, Harriet and Milou, from Castlemaine in rural Victoria to organize the national day of school student protest in Australia.

I was in a taxi on my way to the Melbourne airport when I heard the oh-so passionate chanting on Friday 30th November. I asked the cabbie to go around the block again … I was in disbelief at the naivety of it all. Governments can, of course, be a hindrance to various things – for example, innovation. But it is hubris and nonsense to suggest they could ever stop climate change. This is what Craig Kelly has been trying to explain all year and was a key reason he was so concerned about the NEG and its negative impact on the economy, for no environmental gain.

While denied access to the text of the draft NEG legislation, Mr Kelly has been reading key technical papers on climate change. Earlier this year he read an article in the journal Nature by Paul Kench and colleagues from the University of Auckland. He repeated the conclusions from that research at a Liberal party fundraiser, attended by Get-up activists incognito. So outraged by Kelly’s claims about Tuvalu, the activists sent transcripts of his blasphemy to The Guardian and Australian Broadcasting Corporation. To the ABC’s credit they did a fact check, they even got back to Craig Kelly and asked him if he could substantiate his claims.

Mr Kelly sent them the article, which explains that despite sea level rise, there have been “positive sediment generation balances for these islands” from wave deposition. In fact, to quote more from the article “environmental” rather than “anthropogenic processes” are causing an “expansion of the majority of the islands … masking any incremental effects of rising sea levels, making attribution of sea level effects elusive, as these [environmental] processes can promote high frequency and larger magnitude changes in islands that can persist on the geomorphic record”.

Yet at least since Al Gore’s documentary ‘An Inconvenient Truth’ the world media has been claiming Tuvalu was lost to CAGW.

Every attempt by so-called sceptics to correct the record – until this latest by Craig Kelly – appeared to just generate more ridicule … specifically remembering Graham Young’s attempt to correct the record at Crikey.com back in 2006.

What neither the article in Nature that Mr Kelly quotes from, nor the recent few paragraphs of concession from our ABC, explain the complexity of the situation at Pacific Islands on an Earth where climate change and also volcanism will persist … yes volcanism.

Indeed, the great majority of oceanic islands, including in the Pacific, were formed by volcanic activity. While the volcanoes are active, the islands generally rise relative to the global averaged sea-level. When volcanic activity stops, the islands will cool and eventually start to sink … though as Paul Kench et al. explain in the Nature article wave process and shifts in wave regimes can result in the growth of atolls offsetting any rise in sea levels.

But what is needed in all of this, and especially in future ABC news items, is some context. It is fact that:

1. Since the last glacial maximum about 20,000 years ago, sea levels have risen by more than 100 metres as large ice sheets melted.

2. Globally-averaged sea levels reached a maximum height about 2,000 years ago.

3. Along the east coast of Australia sea levels have actually fallen by about 1.5 metres since then … to reiterate sea levels have fallen about 1.5 metres over the last 2,000 years.

3. But over the last 100 years there has been a slight, but measurable, increase in sea levels. Considering Sydney Harbour this has added up to about a 6.5 centimetre increase over the last 100 years … based on a documented rise of 0.65 millimetres per year between 1885 and 2010: that is the official rate of sea level rise at Fort Denison (just across from the Opera House) as reported by the US National Oceanic and Atmospheric Administration (NOAA). That is less than 1 millimetre per year.

Of course, compounded, this could add up to something catastrophic – one day. But, neither sea levels, nor temperatures, rise in a monotonic way – rather they cycle.

Considering just sea levels at any one location on this planet there is the daily tidal cycle, the monthly lunar cycle, the annual cycle associated with the sun’s declination that causes the four seasons, cycle associated with El Nino and La Nina events, and then there are the longer cycles including the cycles associated with ice ages and interglacial warm periods.

We need to hear more about this from the mainstream media … not just Mr Kelly.

There is no denying that standing for reason can be difficult, especially when the numbers and slogans are against you. But just as Craig Kelly defied a Prime Minister, and won … it is incumbent on every one of us who seeks the truth to keep asking questions and concern ourselves with the detail and most importantly to not give-up on the truth never mind the short-term consequences.

—————

*There has been a campaign against our article in GeoResJ by various high profile believers in CAGW, we respond to this in some detail here: https://jennifermarohasy.com.dev.internet-thinking.com.au/temperatures/response-to-criticism-of-abbot-marohasy-2017-georesj/

Filed Under: Good Causes, History Tagged With: sea level change

Opera House Still Above Sea Level: Despite Homogenisation

October 5, 2014 By jennifer

ONE of the longest continuous sea level measuring gauges is not far from the Sydney Opera House at Fort Denison. The mean sea level trend is 0.65 millimetres per year based on monthly sea level data from 1886 to 2010.

Except that sea levels haven’t trended consistently up each year but rather follow 50-60 year cycles, then there is the impact from El Nino events, and of course the moon is responsible for the neap tides and the king tides.

To be clear, that is NOT 0.65 centimetres per year, but rather MILLImetres per year. Tiny. Particularly given much of the New South Wales coastline has sustained an approximate 2 metre drop in sea levels over the last few thousand years. Not a 2 centimetre drop, but a 2 metre drop. This is not controversial, but rather a well-established fact in the technical literature. The arguing is not that the fall has been of this approximate magnitude, but whether the approximate 2 metre fall in sea levels has been more-or-less continuous or through step changes.

In the scheme of things the rise since 1886 is but a blip in an otherwise falling trend. Of course go back just 16,000 years and sea levels were rising, and significantly faster than at present. Yes. The climate changes.

But, what about Tuvulu, I hear someone ask? It’s an atoll in the Pacific that is sinking. Add to this pressure from a growing population resulting in the depletion of aquifers, and saltwater intrusion can give the false impression of sea level rise.

But none of this is new information to readers of this blog. What is new, is that Bob Carter and colleagues have just written a long report pointing out that there are wide variations in rates of tectonic uplift and subsidence (sinking) around the world at particular times and that any coastal management plan for New South Wales should be based on a good understanding of the local geology, as well as long-term rates of sea level rise. Professor Carter’s new report also suggests that in order to create an impression of sea level rise, rather than just plot raw data, there is a good amount of homogenization. In particular, the high sea-level rise figure of 3.3 mm per year reported for the Fort Denison tide gauge in the report does not represent the original data measurements, but results from computer modeling combined with the selection of a short and atypical section of the available sea-level record.

All this as rebuttal to what might appear to be an innocuous report by Whitehouse and Associates entitled ‘South Coast Regional Sea Level Rise Policy and Planning Framework’. But apparently it could become something of a blue print for the further erosion of the property rights of coastal residents more generally.

Bottom-line: we are unlikely to lose the South Coast or the Opera House to sea level rise from climate change, but it doesn’t hurt to have your own plan in case of a tsunami. According to Ted Bryant, recently retired from the University of Wollongong, six big tsunamis have hit Sydney during the last 10,000 years, the most recent in 1491.

I’m adding this youtube on a bad moon rising for fun.

Filed Under: Humour, Information Tagged With: sea level change

Sea-level Rise and Fall Over Recent Decades: Dr Nils-Axel Morner

May 7, 2014 By jennifer

I’ve been invited to speak at the 9th International Conference on Climate Change, sponsored by the Heartland Institute. Its in Las Vegas in July. The speakers list is now available and also a draft schedule. It looks like I will be speaking in a session with Dr Nils-Axel Morner from Stockholm University. I followed a link to his presentation on sea-level rise and fall given at the conference last year in Munich. It’s informative and entertaining…

Filed Under: Information Tagged With: sea level change

Save Lady Elliot, Set AirCon to 25 Degrees

February 1, 2014 By jennifer

Dear Jennifer, I had a holiday on Lady Elliot Island in October 2013 and while there took the attached photos with the idea that I might send the one of the climate change sign to an Australian blog as an example of Federal Government alarmist propaganda.

Lately the tide seems to be turning against the CO2 global warming scam with the Akademik Shokalskiy debacle in the Antarctic, record polar sea ice totals, the circumpolar vortex in the northern hemisphere and Tom Switzer’s article in the Sydney Morning Herald. However with the heat waves lately in Australia the warmists are fighting back with the usual dodgy forecast heat records which are very seldom reached but most people don’t question them. I commend you for your open letter to the BOM requesting verification of the 2013 temperature record.Lady Elliot

I had another look at this photo of the sign today to work out again how much sea level rise they showed in the graph from 1990 to 2013 and it scaled about 300mm or 13.04mm/year. As another check I scaled the 600mm rise over 57.5 years and only got 10.43mm/year which seemed extremely odd, (I’m a retired land surveyor used to working with graphs).

On further inspection I finally noticed that the 5 year intervals on the x axis read 2010, 2015 then jumped 15 years to 2030 and back to 5 year intervals from 2035 to 2055 which explained the yearly rise difference. The sign writer obviously made a booboo or the original information he was given was wrong. Either way the error should have been corrected before the sign was released for public viewing. The nearest National Tide Centre Gauge at Rosslyn Bay shows a rise of about 2.8mm/year and has only operated since 1993 so the 13mm/year rise on the graph is ridiculous.

As the Great Barrier Reef is in your bailiwick I thought you might be interested in publicising the gross errors on this “way over the top” sign and I assume that a similar one is also on most of the other islands controlled by the GBR Marine Park Authority but you will probably be able to find this out easier than I can. The 03 in the top left corner may be its sign number.

Regards
Sel Hopley

Click on the image for a larger and better view of the entire photograph including the how to save the Island by setting your air con at 25 degrees celsius.

Filed Under: Information Tagged With: sea level change

  • « Go to Previous Page
  • Go to page 1
  • Go to page 2
  • Go to page 3
  • Go to page 4
  • Go to Next Page »

Primary Sidebar

Recent Comments

  • Ian Thomson on Vax-ed as Sick as Unvax-ed, Amongst My Friends
  • Dave Ross on Vax-ed as Sick as Unvax-ed, Amongst My Friends
  • Dave Ross on Vax-ed as Sick as Unvax-ed, Amongst My Friends
  • Alex on Incarceration Nation: Frightened of Ivermectin, and Dihydrogen monoxide
  • Wilhelm Grimm III on Incarceration Nation: Frightened of Ivermectin, and Dihydrogen monoxide

Subscribe For News Updates

  • This field is for validation purposes and should be left unchanged.

November 2025
M T W T F S S
 12
3456789
10111213141516
17181920212223
24252627282930
« Jan    

Archives

Footer

About Me

Jennifer Marohasy Jennifer Marohasy BSc PhD has worked in industry and government. She is currently researching a novel technique for long-range weather forecasting funded by the B. Macfie Family Foundation. Read more

Subscribe For News Updates

Subscribe Me

Contact Me

To get in touch with Jennifer call 0418873222 or international call +61418873222.

Email: jennifermarohasy at gmail.com

Connect With Me

  • Facebook
  • LinkedIn
  • RSS
  • Twitter
  • YouTube

Copyright © 2014 - 2018 Jennifer Marohasy. All rights reserved. | Legal

Website by 46digital