• Skip to primary navigation
  • Skip to main content
  • Skip to primary sidebar
  • Skip to footer
Jennifer Marohasy

Jennifer Marohasy

a forum for the discussion of issues concerning the natural environment

  • Home
  • About
  • Publications
  • Speaker
  • Blog
  • Temperatures
  • Coral Reefs
  • Contact
  • Subscribe

Rainfall forecasting

Wet Summers During La Niña Cycles

November 25, 2021 By jennifer

Last night I was very briefly on Sky Television, and we were reminded by Andrew Bolt that Professor Tim Flannery once said the dams would never fill again.   Back in 2009 we were told to expect drought as the new norm here in Australia because of climate change.

That was when we had El Niño drought conditions, meaning the trade winds were weak and more rain fell on the ocean than could make it to the Australian mainland.  But, of course, the conditions changed – as they always do, because there are cycles – and what is known as a La Niña developed.  It was a very strong La Niña by the end of 2010 with an SOI value of +27.1 for December.

The dams along the east coast of Australia did fill suddenly with the change in the cycle to one of wet from one of dry.  To the extent that the city of Brisbane was flooded – with more than 20,000 homes inundated – after SEQ Water was forced to make emergency releases of water from Wivenhoe dam in January 2011!  SEQ Water had mistakenly kept the dam full of water through December, even though the dam was built for flood mitigation – to catch the water should there be torrential rain.  There was no reason for Brisbane to have flooded, except they got the seasonal forecast so wrong along with the dam management.  They weren’t thinking in terms of cycles – they never do.

Wivenhoe dam was built following the terrible 1974 inundation of Brisbane when more than 6,000 homes were flooded following torrential rains following Cyclone Wanda.  That was also a La Niña year with the SOI index at +31.6 in November 1973.

As the air pressure gradient cycles, as measured but the SOI Index, so we experience periods of dry followed by wet along the east coast of Australia.   This interactive table can be found at The Australian Bureau of Meteorology website.

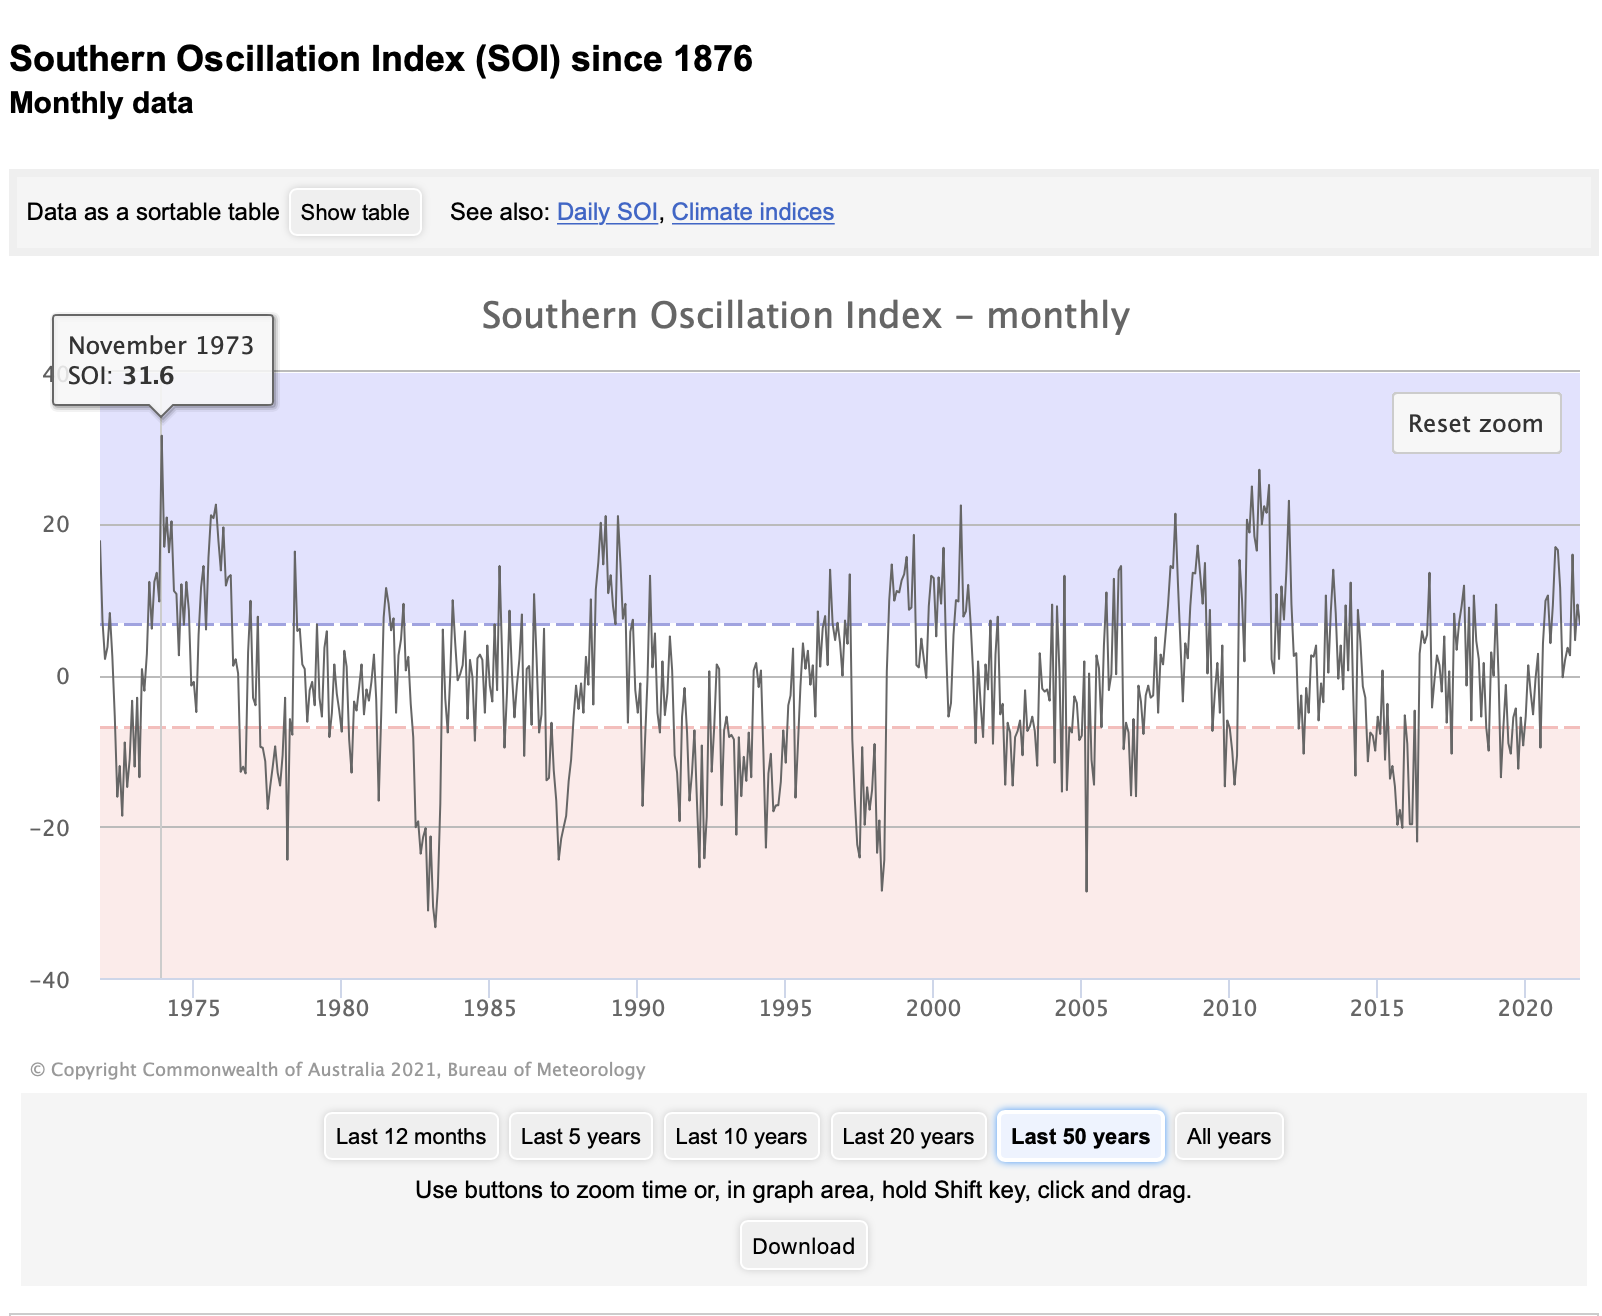
The SOI index is the difference in air pressure between Tahiti and Darwin.

When there are strong pressure gradients, we have stronger than usual trade winds drawing moist air from the Pacific Ocean all the way to the Australian mainland.  When the winds are not so strong, and especially during El Niño conditions when they are weak, it is more likely to rain over the ocean with the storm clouds and cyclones not making it as far as the Australian east coast. Then we risk drought here in Australia.

We can see cycles of La Niña and El Niño in the air pressure data that goes right back to 1876 as measured between Darwin and Tahiti.    Indeed, Australia is a land of drought or flooding rains because of these cycles.

Except that David Jones, and other activists, hold such key positions at the Australian Bureau of Meteorology and have for so long, and they refuse to acknowledge the strength of the cycles because they are so wedded to the theory of catastrophic climate change and the idea that there are tipping points when there are just cycles.   They brief Tim Flannery who is really just one of the useful idiots.   Andrew Bolt shouldn’t really be so upset by him!  It is the Bureau that has the potential to deliver much better forecasts, but that would require them to recognise there are cycles that persist and give up on the notion of a climate catastrophe.

John Abbot and I went to the Bureau to talk with them, specifically with Oscar Alves, back in August 2011 about the potential of Artificial Neural Networks (a form of machine learning/artificial intelligence) for more reliable seasonal rainfall forecasting.   We used the SOI index as a key input, and have detailed our technique in a series of published papers.

****

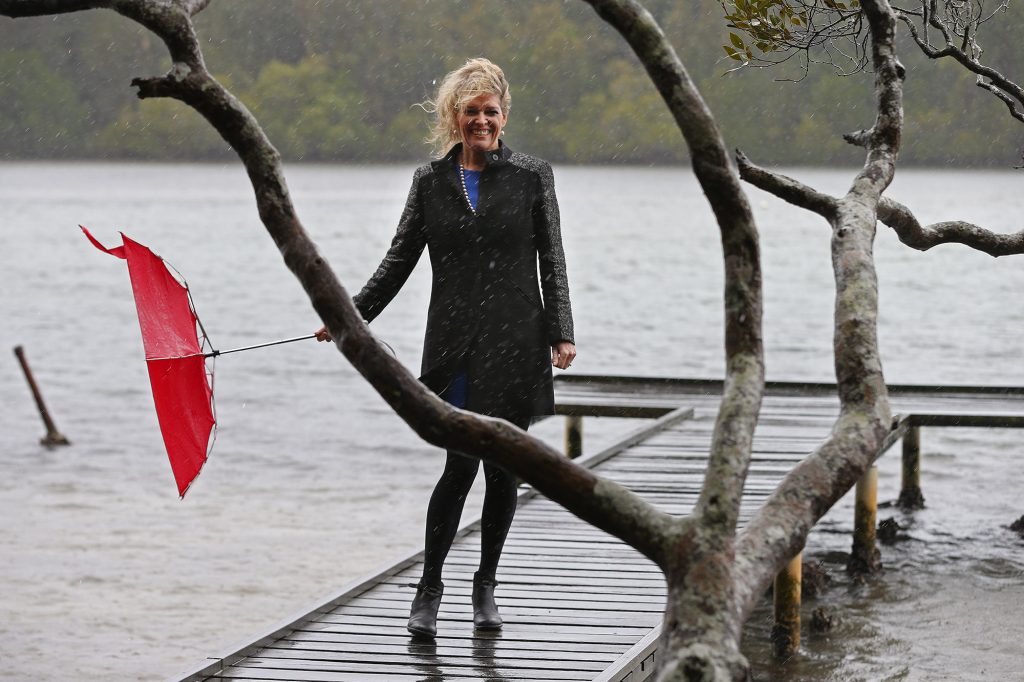
The feature photograph at the very top of this blog post was taken outside our unit in St Lucia Brisbane after the apartment block was flooded in January 2011.  It was quite a job, the cleanup.

Filed Under: Information Tagged With: Rainfall forecasting

Skilful Monthly Rainfall Forecasts

July 24, 2017 By jennifer

THE accurate weather forecast of James Stagg back in June 1944 is considered crucial to the successful D-day invasion that changed the course of WWII.

Should we find ourselves at war again, is there an institution or individual capable of providing an accurate short or long-term weather forecast?

Dr John Abbot and I are working towards better medium-term rainfall forecasts, as explained in the highlights to our latest research paper:

1.Monthly rainfall forecasts for agricultural areas in Queensland and Western Australia,

2. Forecasts more skilful than produced by Australian Bureau of Meterology using General Circulation Models, and

3. Potential to provide better warnings of extreme flooding events with long lead times.

This paper is provided free by scientific publishers Elsevier for a limited period (50 days) at: https://authors.elsevier.com/a/1VQBlcd3RzLeg .

Jennifer walking in the rain along Weyba Creek, Noosaville, August 2014.

Filed Under: Information Tagged With: Rainfall forecasting

Don’t Retire: Start a PhD in Paradise

August 16, 2014 By jennifer

BEFORE the 20th Century there was no age for retirement. There existed a leisured class who through birth or industry could choose what work they did – if and when. But, even they didn’t retire.

Retirement, like unemployment, can potentially reduce you to discussion of people, events, and lost opportunities, when great minds discuss ideas. Of course, even greater minds discuss numbers and ideas.

So if you are keen for a sea change, and are a graduate from a science or engineering discipline who enjoys problem solving, consider moving to Noosa and enrolling in a PhD or masters in weather and climate forecasting using artificial intelligence.

Applicants must be Australian citizens or permanent residents or New Zealand citizens, and must be enrolled or intending to enroll in an eligible research higher degree program at CQ University, and be based at the Noosa campus. It is expected that applicants will like problem-solving and playing with numbers; have an ability to work independently, but also be able to follow directions; and want to build a portfolio of co-authored peer-reviewed publications.

The successful applicants will each be provided with a tax-exempt living allowance scholarship for a fixed term of up to 3.5 years, with a commencing stipend of $32,000 per annum.

Jennifer Marohasy at Alexandria Bay, Noosa National Park


POSSIBLE projects include, but are not limited to, the following:

1. Forecasting El Niño-Southern Oscillation

For three decades, there has been a significant global effort to improve El Niño-Southern Oscillation (ENSO) forecasts with the focus on using fully physical ocean-atmospheric coupled general circulation models. Despite the increasing sophistication of these models, their predictive skill remains only comparable with relatively simple statistical models, with some blaming a phenomenon known as the Spring Predictability Barrier (SPB). Preliminary studies suggest that artificial neural networks can forecast through the SPB. It is possible further advances could be made through the refining of input variables building on the work of Aiming Wu (see Neural Networks, Volume 19), and possibly by also potentially considering extra-terrestrial influences including atmospheric tides (see Ken Ring, The Lunar Code).

The development of an improved method for forecasting ENSO through the elucidation of the most relevant input variables could be the focus of this project.

2. Signal processing to understand drivers of rainfall

There is a natural relationship between artificial neutral networks and signal processing. The neural network software that underpins our current prototype models was developed at the University of Florida by researchers in their department of electrical engineering with expertise in signal processing. Our prototype models, however, do not explicitly decompose the rainfall time-series signals into components. If the component signals were elucidated it would potentially aid understanding of the drivers of rainfall, and potentially improve forecasts.

Exploration of these concepts could form the central theme of a project that would best suite a graduate with a background in signal processing and/or electrical engineering.

3. Considering cyclical changes at the Antarctic to forecast rainfall in the Murray Darling

Australian farmers have long sought advice from long-range weather forecasters who operate independently of the Bureau of Meteorology, perhaps beginning with the work of astronomer Inigo Owen Jones. Modern forecasters using the same cyclical variations claims a strong relationship between higher sea ice averages in the Antarctic and periods of below average rainfall for eastern Australia and heavier late season frosts (see Kevin Long, www.thelongview.com.au). The Antarctic Oscillation (also known as the Southern Annular Mode or SAM) is also thought to be an important driver of rainfall variability in southern Australia (see Australian Bureau of Meteorology, http://www.bom.gov.au/climate/enso/history/ln-2010-12/SAM-what.shtml).

The focus of this project could be input selection and optimisation for monthly rainfall forecasting in the Murray Darling, including a consideration of the Antarctic Oscillation and changes in sea ice extent.

4. Modelling past temperatures and forecasting future temperatures – globally and locally

General circulation models, that underpin the current dominant paradigm in climate science and forecast global warming, simulate climate based on an assumed first principles understanding of the physical process. In contrast, ANNs rely on historical climate data to acquire knowledge, learn relationships, model and measure relationships and then use this information to make forecasts.

ANNs could be used to both provide an independent forecast of future temperatures, and as an independent method of GCM validation under future climate. Limited research is already occurring in this area (e.g. Kisi and Shiri, International Journal of Climatology Volume 34) and could be the focus of more than one PhD and/or Masters project. Such projects could also explore local, regional and global variability in temperatures historically and into the future.

The integrity of historical temperature data is largely irrelevant to the performance of a GCM, but critical to the operation of an ANN. So projects that focused on the use of ANN for forecasting future climate, would very likely benefit from first developing a technique for creating continuous series of high quality temperature data for individual locations as an input variable. While such temperature series theoretically already exist, they are not stable over time and often represent a modelled version of the temperatures originally recorded (see Zhang et al, Theoretical and Applied Climatology, Volume 115; Stockwell and Stewart, Energy & Environment, Volume 23; J. Nova http://joannenova.com.au/tag/homogenization-temperature-data/ T. Heller http://stevengoddard.wordpress.com/2014/07/18/nasa-hacking-australia/; B. Dedekind http://wattsupwiththat.com/2014/06/10/why-automatic-temperature-adjustments-dont-work/; Marohasy et al., The Sydney Papers Online, Issue 26).

5. Forecasting rainfall to aid mine scheduling

There is a need for more skillful medium-term rainfall forecasts for the Bowen Basin, a key coal-mining region in Queensland. Official seasonal forecasts are currently based on general circulation models, are not reliable, and do not provide adequate information in terms of timing and strength of rainfall for mine scheduling and pro-active risk management. V.S. Sharma and colleagues detail these issues in a report published by the National Climate Change Adaptation Research Facility in 2012.

The focus of a PhD or masters could include investigation of the possibility of using ANNs to generate forecasts for shorter time intervals (2 weeks and 1 week) and shorter lead times (2 weeks and 1 week) and using humidity, atmospheric pressure, cloudiness, wind direction and speed, as well as key climate indices as input variables.

John Abbot thinking at the Sunshine Beach Surf Club.


NEXT STEP, if you are interesting in applying, or just want more information, please contact me on mobile 041 887 32 22 or email jennifermarohasy at gmail.com. Closing date for applications is 30th October 2014.

THERE is more information on the scholarships at the CQ University website at:
http://www.cqu.edu.au/research/future-candidates/scholarships

General information about ANNs is taught as part of machine learning courses. Yaser Abu-Mostafa at the California Institute of Technology offers such an introductory online course, which includes some theory, algorithms and applications, available for download and viewing at https://work.caltech.edu/telecourse.html.

Our ANNs are based on software developed by Neurosolutions. More information on this software is available at http://www.neurosolutions.com .

Recent relevant publications by John Abbot and me include:

Abbot J., Marohasy J., 2015. Using artificial intelligence to forecast monthly rainfall under present and future climates for the Bowen Basin, Queensland, Australia. International Journal of Sustainable Development and Planning. In press

Abbot J., Marohasy J., 2014. Input selection and optimization for monthly rainfall forecasting in Queensland, Australia, using artificial neural networks. Atmospheric Research 128 (3), 166-178

Abbot J., Marohasy J., 2013. The potential benefits of using artificial intelligence for monthly rainfall forecasting for the Bowen Basin, Queensland, Australia, In: Brebbia, C.A. (Ed.), Water Resources Management VII, WIT Press, Southhampton, (on-line) doi:10.2495/WRM130261

Abbot J., Marohasy J., 2012. Application of Artificial Neural Networks to rainfall forecasting in Queensland, Australia. Advances in Atmospheric Science 29, 717-730

Relevant other references include:

Australian Bureau of Meteorology, 2014. The Southern Annular Mode (SAM) http://www.bom.gov.au/climate/enso/history/ln-2010-12/SAM-what.shtml

Dedekind, B. 2014. Why automatic temperature adjustments don’t work http://wattsupwiththat.com/2014/06/10/why-automatic-temperature-adjustments-dont-work/

Heller A., 2014. NASA Hacking Australia http://stevengoddard.wordpress.com/2014/07/18/nasa-hacking-australia/

Halide H., Ridd P., 2008. Complicated ENSO models do not significantly outperform very simple ENSO models. International Journal of Climatology 28, 219–233

Kisi O., Shiri J., 2014. Prediction of long-term monthly air temperatures using geographical inputs. International Journal of Climatology 34, 179-186

Long K., 2014. Current forecasts http://www.thelongview.com.au/forecast.html

Marohasy J., Abbot J., Stewart K., Jensen D., 2014. Modelling Australian and Global Temperatures: What’s Wrong? Bourke and Amberley as Case Studies. The Sydney Papers Online, Issue 26. http://www.thesydneyinstitute.com.au/paper/modelling-global-temperatures-whats-wrong-bourke-amberley-as-case-studies/

Ring K., 2006. The Lunar Code. Random House, New Zealand, pp 208

Risbey J. S., 2009. On the remote drivers of rainfall variability in Australia. Monthly Weather Review 137, 3233-3253

Sharma V.S, et al. 2012. Extractive resource development in a changing climate: Learning the lessons from extreme weather events in Queensland, Australia, National Climate Change Adaptation Research Facility, Gold Coast, pp. 110.

Stockwell D., Stewart K, 2012. Biases in the Australian High Quality Temperature Network, Energy & Environment, Vol. 23, 10.1260/0958-305X.23.8.1273

Wu A., Hsieh W.W., Tang B., 2006. Neural network forecasts of the tropical Pacific sea surface temperatures. Neural Networks 19, 145–154

Zhang L. et al. 2014. Effect of data homogenization on estimate of temperature trend: a case of Huairou station in Beijing Municipality. Theoretical and Applied Climatology 115, 365-373

Great minds discuss ideas.

Filed Under: Good Causes, News Tagged With: Rainfall forecasting, Temperatures

Finding Figures Quoted in Media in IPCC Report Released Today

March 31, 2014 By jennifer

WORKING Group II, of the Intergovernmental Panel on Climate Change (IPCC), published their contribution to the Fifth Assessment Report earlier today. The summary document begins by explaining that human interference with the climate system is occurring and climate change poses risks for humans and natural systems. The report goes on to assess the impacts, how we can adapt and why we are vulnerable.

Within an hour of the reports release the Australian Broadcasting Corporation had an article quoting CSIRO’s Dr Mark Howden…

“The world’s leading climate science organisation – the Intergovernmental Panel on Climate Change (IPCC) – has released its fifth report and warns the world is ill-prepared for risks from a changing climate.

The CSIRO’s Dr Mark Howden, who was lead author on the chapter addressing food production and food security, says the report predicts a rainfall reduction of 20 to 40 per cent in parts of southern Australia in coming decades, while rainfall will be more variable in the north.”

I need to file my The Land column this evening and I would like to put the 20 to 40 percent reduction in some context relative to the rest of the report. But I can’t find these figures in the report.

It’s a long report with many components. Can someone help me…

http://ipcc-wg2.gov/AR5/report/final-drafts/

In particular where does it say rainfall will reduce by 20 to 40 percent in southern Australia?

Filed Under: Information, Uncategorized Tagged With: Rainfall forecasting

Mega-Drought for Murray Darling, Predicted by Kevin Long

March 21, 2014 By jennifer

I began my most recent newsletter to those subscribed at ‘MythandtheMurray.org’ with reference to the Michael Crichton quote: ‘If you don’t know history, then you don’t know anything. You are a leaf that doesn’t know it is part of a tree.”

I continued by providing a link to a recent blog post where I explain how British Explorer Matthew Flinders missed the Murray River’s mouth when he was mapping the southern Australian coastline in 1802, probably because the Murray’s mouth had closed over.

In response I received an email from Kevin Long explaining that the last mega-drought in the Murray-Darling spanned the period 1790 to 1820.

Kevin Long, a long-range weather forecaster based in Bendigo, Victoria, went on to explain that he believes we are at the beginning of another mega-drought in the Basin because of the solar minimum and phase of the current lunar cycle.

While it is fashionable for many climate scientists, and also social and political commentators, to scoff at the idea that the moon could influence climate, it is not disputed by those with an understanding of conventional physics that the moon’s gravitational field along with the day/night cycle of the spinning earth creates atmospheric tides that modulate high-altitude winds that have a major influence on weather.

The complete email from Kevin Long follows.

While providing a summary of the current extra-terrestrial situation as it affects rainfall in the Murray-Darling, Kevin Long continued with my leaf-tree analogy. In particular suggesting that he is a leaf attached to the big tree of knowledge.

I agree that there exists a vast amount of information concerning astronomy and historical climate patterns. Kevin Long has an intimate knowledge of these patterns as they affect rainfall in the Murray Darling Basin.

Prior to the establishment of the current Australia Bureau of Meteorology in 1909, Australian meteorologist had a keen knowledge of astronomy and considered solar, lunar and planetary cycles in their weather forecasting. I’m told that there was some interest in what was termed ‘solar terrestrial physics’ at the Bureau until the early 1950s. Now this tree of knowledge is ignored.
I’m told modern meteorologists are instead trained in how to interpret the output from general circulation models (GCMs).

It could be that as meteorologists have moved away from a deep knowledge of astronomy, and the influence of the sun, moon and planets on climate cycles, their skill at medium and long-range rainfall forecasting has greatly deteriorated.

Email from Kevin Long…

Hi Jennifer

The historical records you included about Matthew Finders indicate the Murray mouth was closed in 1802. This all fits with the weather cycle as I understand it to be at the time.

That was the middle of the last mega-drought, brought on by the Dalton minimum cycle 1790 to 1820 (three very low and long sun spot cycles only averaging about 35 sun spot number).

The solar minimum cycle repeats every two hundred years or thereabouts.

Just a little more evidence that indicates this leaf is still attached to the big tree of knowledge.

The Murray Darling Basin is subject to long periods of well below average rainfall, this occurs when the northeast lunar air tide cycle is not peaking during the monsoon season.
It takes 9 years for the northeast lunar air tide cycle to progress backwards through the summer months, after which the dryer transition phase takes the next 9 to 10 years to progress back through the summer months, it is during this time that a long drought is most likely to develop. (This year the peak of the northeast air tide is occurring in late November so we are at the start of that long dry period.)

The southern air tide phase that follows during the next 9 year (2025 to 2034) has only a small influence on the top half of the MDB’s rainfall, so if you don’t have above average solar activity the northern half of Australia is likely to remain in a low rainfall sequence for most of the next 28 years of the 37.2-year air tide cycle. It is only when a strong La Nina cycle happens to form, that a few cyclones are likely to be forced inland providing some temporary relief during this long dry period.

Global sea ice is now above the average of the last 35 years and the Antarctic ice is presently about 20% above average for this time of the year. This indicates a dry winter/spring.

The SOI has plunged from +14 to –13 in just over a month. Even the Bureau of Meteorology is now warning of El Nino in the second half of the year. This little leaf blowing in the wind saw it coming months ago.

Cold seas are already dominating the east coast of Australia, and a big slug of cold sea is moving across under Australia, this is very likely to kill the autumn/winter rainfall that the weakening southern air tide is trying to produce. (The air tides get a little weaker every year until 2020 which is the driest part of this 18.6 year lunar declination cycle, otherwise known as the flood and drought cycle.)

Once June has passed there is very little chance of any river filling rains until the next La Nina gets organized, which is not due until 2017. That one is normally the weakest one in the 18.6-year cycle.

If the climate cycle runs true to form you will be able to walk across the Murray mouth, later this decade without getting your feet wet once again. And you will be able to see large 200 year-old dead tree stumps in many of Australia’s deepest dry holes.

Regards Kevin Long
http://www.thelongview.com.au

****
map moon sun

The map shows the position of the sun and the moon relative to the earth at about the time I made this blog post. The day and night world map can be accessed by clicking here… http://www.timeanddate.com/worldclock/sunearth.html

Filed Under: Information Tagged With: lunar cycles, Rainfall forecasting

What Drives Change in Antarctic Sea Ice Cover?

March 11, 2014 By jennifer

THE modern meteorologist relies on computer models for forecasting. Coupled atmospheric-ocean models, known as general circulation models, are favoured for medium to long-range forecasting with these models forecasting an overall and quite rapid general warming at the north and south poles. In accordance with this forecast, there has been a general decline in the extent of sea ice at the Arctic. At the Antarctic, however, sea ice has increased in extent, at least over the period of the satellite record, Figure 1.[1] Sea Ice Cover

I’m interested to know what might have driven the overall decline in the sea ice at the Arctic, and increase at the Antarctic, over the last thirty or so years. According to mainstream climate science, increasing levels of atmospheric carbon dioxide would drive the melt. But what would drive the increase?

A long-range weather forecaster who relies on a knowledge of solar and lunar cycles, rather than computer models, is Kevin Long. He claims that when there is more sea ice at the Antarctic there is generally below-average rainfall and heavier late season frosts in central Victoria.[2]

In an explanation of the origins of our understanding of the Southern Oscillation, which the mainstream climate science community believes has a major affect on rainfall over eastern Australia, Donald R. Mock from the US National Oceanic and Atmospheric Administration (NOAA) suggests early researchers dismissed any direct influence of solar activity on the phases of the Southern Oscillation, but took an interest in the possibility of a connection with the polar circulation particularly the extent of sea ice at the Antarctic [4]. Nowhere in this explanation, however, is an extraterrestrial link, whether lunar, solar or planetary, offered.

A fellow I know who takes an interest in solar-terrestrial physics because his business of installing radio and television antennae depends on it, claims a relationship between the global sea ice anomaly and lunar cycles. In particular, Siliggy claims that the global sea ice anomaly goes up when the moon is new at apogee and down when the moon is full at apogee.[3] On January 1 and January 30, 2014 there was synchrony between perigee and the new moon.[3]. I can’t see a period when there is synchronoy between new or full moons at apogee until March 5, 2015, when the moon will be full at apogee.[3]

****
[1] Ole Humlum Climate4You update for January 2014 http://www.climate4you.com/Text/Climate4you_January_2014.pdf
[2] Kevin Long summer forecast http://thelongview.com.au/documents/FORECAST-2014-No1-SUMMER-Kevin-Long.pdf
[3] The moon orbits the earth in an ellipse, not a circle, and so there are period when it is closer (perigee) and further away (apogee) in each one-month cycle. Also during this cycle there are periods when the moon is the same side of the earth as the sun (new moon) and on the opposite side of the earth to the sun (full moon). For new and full moon phases and perigees and apogees for 2014 see Lunar perigee and apogee calculator at https://www.fourmilab.ch/earthview/pacalc.html
[4] The Southern Oscillation: Historical Origins by Donald R. Mock, written 1981. http://www.esrl.noaa.gov/psd/enso/misc/hxsoi.html

Filed Under: Information Tagged With: Climate & Climate Change, Rainfall forecasting

  • Go to page 1
  • Go to page 2
  • Go to Next Page »

Primary Sidebar

Recent Comments

  • Ian Thomson on Vax-ed as Sick as Unvax-ed, Amongst My Friends
  • Dave Ross on Vax-ed as Sick as Unvax-ed, Amongst My Friends
  • Dave Ross on Vax-ed as Sick as Unvax-ed, Amongst My Friends
  • Alex on Incarceration Nation: Frightened of Ivermectin, and Dihydrogen monoxide
  • Wilhelm Grimm III on Incarceration Nation: Frightened of Ivermectin, and Dihydrogen monoxide

Subscribe For News Updates

  • This field is for validation purposes and should be left unchanged.

December 2025
M T W T F S S
1234567
891011121314
15161718192021
22232425262728
293031  
« Jan    

Archives

Footer

About Me

Jennifer Marohasy Jennifer Marohasy BSc PhD has worked in industry and government. She is currently researching a novel technique for long-range weather forecasting funded by the B. Macfie Family Foundation. Read more

Subscribe For News Updates

Subscribe Me

Contact Me

To get in touch with Jennifer call 0418873222 or international call +61418873222.

Email: jennifermarohasy at gmail.com

Connect With Me

  • Facebook
  • LinkedIn
  • RSS
  • Twitter
  • YouTube

Copyright © 2014 - 2018 Jennifer Marohasy. All rights reserved. | Legal

Website by 46digital