
THROUGH the Millennium drought of 2001 to 2009, I was optimistic that it would rain again, that the drought would end and probably with flooding rains.
The drought did break, and the aggregated average annual rainfall for the Murray Darling Basin as calculated by the Bureau of Meteorology (BOM) shows 2010 was the wettest year on record. The last time it was nearly as wet was 1956 and before that 1950.
The BOM only provides an official average annual rainfall for the Murray Darling back to 1900, but if we consider individual locations, like Bourke, the previous really wet year is 1890. That year the township of Bourke flooded, with historic photographs showing men in boats rowing down the main street.
There are exactly 60 years between 1890, 1950 and 2010.
While believers in anthropogenic global warming claim the climate is on a new trajectory with continuous warming, there is an alternative scientific literature that recognises these 60-year cycles. For example, Nicola Scafetta’s 2010 paper ‘Empirical evidence for a celestial origin of the climate oscillations and its implications’ in the Journal of Atmospheric and Solar-Terrestrial Physics (volume 72, pages 951-970).
Bendigo-based long-range weather forecaster, Kevin Long, uses such patterns for his forecasts, and is very pessimistic about rainfall in the Murray Darling.
Mr Long is predicting that from 2016 there will be a rapid return to the cooler and drier climate of the early 1800s.
Remember Charles Sturt discovered the Darling River near Bourke in 1828 as a series of stagnant, saline ponds.
Mr Long is forecasting that this drier climate may last for the duration of the solar minimum cycle or approximately 30 years. The Maunder Minimum of 1645 to 1715 and the Dalton Minimum of 1790 to 1830 are the last examples of recurring solar hibernation periods.
Theoretically the Murray Darling should be in a much better position to deal with prolonged drought, given the water infrastructure built over the 20th century and recent water reform mandating the buy back of many irrigation licenses.
But in reality water reform has done nothing to reduce the dependence of the Lower Lakes on the upstream reservoirs and this creates an unsustainable burden on the entire system, particularly during drought.
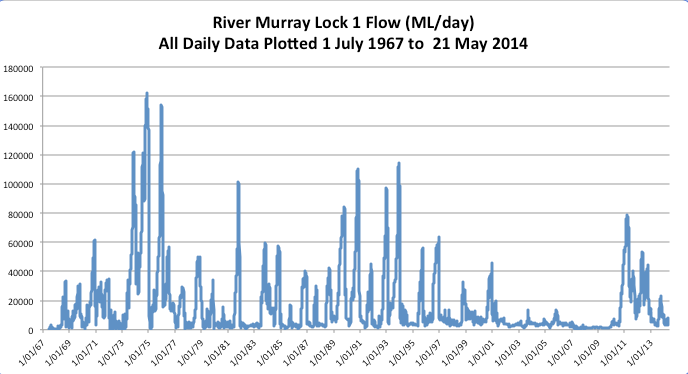
Furthermore, there should be more awareness and concern about the relatively low flow at Lock 1 – indeed diminishing flow for the same quantity of rainfall since the 1980s. This is probably a consequence of improved land management throughout the Basin meaning water soaking into the soils rather than running off, as well as more trees, and salt interceptions schemes evaporating more water.
Daily flow data for Lock 1 is available back to 1967, and it shows that while rainfall might be cyclical, flow volume has been in general decline over recent decades. Historic low volumes were recorded at Lock 1 during the Millennium drought. Even with the record rainfall in the Murray Darling during 2010, flow at Lock 1 never reached the heights it did during the early 1990 and was a long way short of the peaks during the early 1970s.
****
The text of this article was first published as one of my regular fortnightly columns in The Land newspaper on May 29, 2014. Data used to construct the chart shown in this blog post was sourced from the Murray Darling Basin Authority. Click on the chart for a better view, that begins in 1967.


 Jennifer Marohasy BSc PhD has worked in industry and government. She is currently researching a novel technique for long-range weather forecasting funded by the B. Macfie Family Foundation.