• Skip to primary navigation
  • Skip to main content
  • Skip to primary sidebar
  • Skip to footer
Jennifer Marohasy

Jennifer Marohasy

a forum for the discussion of issues concerning the natural environment

  • Home
  • About
  • Publications
  • Speaker
  • Blog
  • Temperatures
  • Coral Reefs
  • Contact
  • Subscribe

Drought

New Drought Report: Consistently Dishonest, Consistently Misleading

April 16, 2019 By jennifer

DROUGHT is cruel. The farmer doesn’t know when it is going to end, how much longer they will need to keep feeding their livestock, and how much longer they must wait until they can plant a crop.

If the Australian Bureau of Meteorology were useful, they would provide a reliable long-term rainfall forecast. But they can’t – the Bureau’s three month seasonal, and longer rainfall forecasts, show no skill at forecasting. It is one thing never to admit such incompetence, but they are also being dishonest about the real state of the climate.

Their most recent drought report is replete with colored maps suggesting that it is getting drier and drier … and rainfall trends are variously described as “downwards”. This is not so.

Fig. 1. The bureau’s latest drought report shows colored maps, not time series charts – yet in the text there are claims of downward trends.

A colored map doesn’t necessarily provide any useful information about trend. The maps in the Bureau’s new drought report are simplistic depictions of points in time – relative to arbitrarily defined intervals in the past when it was wetter. The maps are colored red, suggesting danger. This is more propaganda from the behemoth.

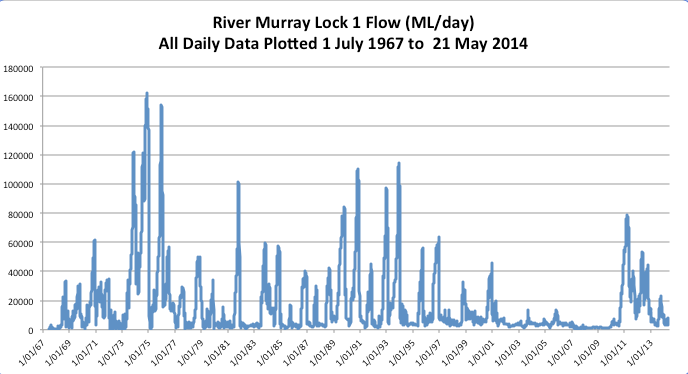
The latest drought report focuses on eastern Australia, and particularly the Murray Darling Basin.

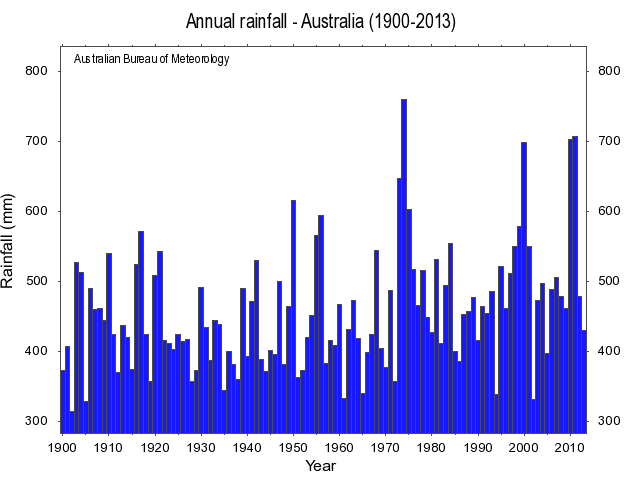
In reality the second half of the twentieth century was consistently wetter than the first half in this region of south eastern Australia. And while the last year has been desperately dry for farmers, it is not exceptionally dry considering the last 100 years of data – such statistics are obvious when annual rainfall is plotted from 1900 as a time series chart, as shown in Figure 2.

Fig. 2. This chart shows how much rain has fallen each year since 1900, as an annual average for the Murray Darling Basin region. Such a chart provides some idea of change over time, which gives an idea of the trend.

The bureau consistently refuses to provide the available data in this form.

In the most recent report, they bemoan specific seasons and time intervals as being more intense and/or more severe in rainfall deficit. But if we are to cherry-pick, then why not consider how exceptionally wet it was in September 2016, as shown in Figure 3?

Fig. 3. When rainfall is considered on the basis of just one month, specifically, September, it is apparent that 2016 was exceptionally wet. Why was it exceptionally wet in September 2016?

Of course, the Bureau is run by “Science Managers” wedded to the theory of catastrophic anthropogenic global warming – so they only show intervals when it is drier than average consistent with their theory that Australia will experience below average rainfall because of elevated levels of carbon dioxide. They show no curiosity when it comes to exceptionally wet periods in the recent record.

The managers at the Bureau are consistently dishonest in how they present the data, and the conclusions that they draw from it.

It is also fake news for the Bureau to claim that the drought is “exacerbated by record high temperatures” – and repeat that this last summer (2018-19) was Australia’s hottest. Considering the last 100 years, the hottest summer in the Murray-Darling Basin was probably the summer of 1938-39. In rural Victoria, the summer of 1938-1939 was on average at least two degrees hotter than anything measured with equivalent equipment since, as shown in Figure 4.

Fig. 4. It is possible to rank time intervals in different ways … by day, month, summer, year etcetera. Considering ‘summer’ as the three months of December, January and February then the summer of 1938-1939 was probably hotter than any other summer since records began.

The Bureau now measures temperatures as spot one-second readings from custom built electronic probes with unknown time constants*. So, there is no way of knowing how hot it was last summer relative to the very hot summers of say 1938-39, when temperatures were measured with mercury thermometers.

The use of electronic probes without averaging will give higher temperatures for the same weather, as I explain in a letter to the Chief Scientist.

_______________

*Some explanation of time constants, and why averaging is so important is included in three blog posts, with links following …

1. Explanation with worked theoretical examples

https://jennifermarohasy.com.dev.internet-thinking.com.au/2017/10/averaging-convention-not/

“The sensors can respond much more quickly to changes in temperature, and on a hot day, the air is warmed by turbulent streams of ground-heated air that can fluctuate by more than 2 degrees on a scale of seconds. So, if the Bureau simply changed from mercury thermometers to electronic sensors, it could increase the daily range of temperatures, and potentially even generate record hot days simply because of the faster response time of the sensors.

Except to ensure consistency with measurements from mercury thermometers there is an international literature, and international standards, that specify how spot-readings from sensors need to be averaged – a literature and methodology being ignored by the Bureau.

To be clear, the UK Met office takes 60 x 1 second samples each minute from its sensors, and then averages these. In the US, they have decided this is too short a period, and the standard there is to average over a fixed 5-minute period. In Australia, however, the Bureau takes not five-minute averages, nor even one-minute averages, but just one second spot-readings.

Check temperatures at the ‘latest observations’ page at the Bureau’s website and you would assume the value had been averaged over perhaps 10 minutes. But it is dangerous to assume anything when it comes to our Bureau. The values listed at the ‘observations’ page actually represent the last second of the last minute. The daily maximum (which you can find at a different page) is the highest one-second reading for the previous 24-hour period: a spot one-second reading in contravention of every international standard. There is absolutely no averaging.

Then again, how many of you knew that the mean daily temperature as reported by meteorological offices around the world is not an average of temperatures recorded through the day and night but rather the highest and the lowest divided by two – as is the convention?

This convention developed because (surface) temperature measurements were originally instantaneous measurements from mercury thermometers recorded manually each morning (providing the minima) and afternoon (providing the maxima).

So, in the UK the daily maximum from a weather station with an electronic sensor will be the highest value derived from the averaging of 60 samples over that one-minute interval, while in Australia, the daily maximum will be the highest one-second spot reading.

2. Explanation in context of record temperatures at Mildura, explaining how first probe recorded cooler than mercury thermometer

https://jennifermarohasy.com.dev.internet-thinking.com.au/2017/11/law-unto-australian-bureau-meteorology/

“The Bureau have since acknowledged that their method of recording temperatures from electronic sensors is not accredited, though they claim it nevertheless gives readings equivalent to mercury thermometers. Interestingly, your office emailed a journalist, backing them up – claiming that a single electronic sensor can “mirror the behaviour of liquid in glass thermometers”. This is nonsense, because mercury and alcohol thermometers have different time constants. This is one reason the World Meteorological Organisation (WMO) insist on numerical averaging: alcohol thermometers (that measure temperature minima) have longer time constants than mercury thermometers (that measure temperature maxima).

3. Explanation in context of Mildura, how next/current probe records consistently warmer than a mercury thermometer

https://jennifermarohasy.com.dev.internet-thinking.com.au/2018/02/bom-blast-dubious-record-hot-day/

“Considering days when there is parallel data available in the temperature band of interest (the claimed-record hot day in September 2017 measured 37.7 degrees Celsius) the new probe has been found to measure up to 0.4 degrees hotter (e.g. 26 February 2013 the recording for the probe is 37.3, while the mercury thermometer recorded 36.9 on the A8 form) …

Filed Under: Information, News Tagged With: Drought

Solar Cycle Could Point to Mega-Drought

June 1, 2014 By jennifer

THROUGH the Millennium drought of 2001 to 2009, I was optimistic that it would rain again, that the drought would end and probably with flooding rains.

The drought did break, and the aggregated average annual rainfall for the Murray Darling Basin as calculated by the Bureau of Meteorology (BOM) shows 2010 was the wettest year on record. The last time it was nearly as wet was 1956 and before that 1950.

The BOM only provides an official average annual rainfall for the Murray Darling back to 1900, but if we consider individual locations, like Bourke, the previous really wet year is 1890. That year the township of Bourke flooded, with historic photographs showing men in boats rowing down the main street.

There are exactly 60 years between 1890, 1950 and 2010.

While believers in anthropogenic global warming claim the climate is on a new trajectory with continuous warming, there is an alternative scientific literature that recognises these 60-year cycles. For example, Nicola Scafetta’s 2010 paper ‘Empirical evidence for a celestial origin of the climate oscillations and its implications’ in the Journal of Atmospheric and Solar-Terrestrial Physics (volume 72, pages 951-970).

Bendigo-based long-range weather forecaster, Kevin Long, uses such patterns for his forecasts, and is very pessimistic about rainfall in the Murray Darling.

Mr Long is predicting that from 2016 there will be a rapid return to the cooler and drier climate of the early 1800s.

Remember Charles Sturt discovered the Darling River near Bourke in 1828 as a series of stagnant, saline ponds.

Mr Long is forecasting that this drier climate may last for the duration of the solar minimum cycle or approximately 30 years. The Maunder Minimum of 1645 to 1715 and the Dalton Minimum of 1790 to 1830 are the last examples of recurring solar hibernation periods.

Theoretically the Murray Darling should be in a much better position to deal with prolonged drought, given the water infrastructure built over the 20th century and recent water reform mandating the buy back of many irrigation licenses.

But in reality water reform has done nothing to reduce the dependence of the Lower Lakes on the upstream reservoirs and this creates an unsustainable burden on the entire system, particularly during drought.

Furthermore, there should be more awareness and concern about the relatively low flow at Lock 1 – indeed diminishing flow for the same quantity of rainfall since the 1980s. This is probably a consequence of improved land management throughout the Basin meaning water soaking into the soils rather than running off, as well as more trees, and salt interceptions schemes evaporating more water.

Daily flow data for Lock 1 is available back to 1967, and it shows that while rainfall might be cyclical, flow volume has been in general decline over recent decades. Historic low volumes were recorded at Lock 1 during the Millennium drought. Even with the record rainfall in the Murray Darling during 2010, flow at Lock 1 never reached the heights it did during the early 1990 and was a long way short of the peaks during the early 1970s.

flow data

****
The text of this article was first published as one of my regular fortnightly columns in The Land newspaper on May 29, 2014. Data used to construct the chart shown in this blog post was sourced from the Murray Darling Basin Authority. Click on the chart for a better view, that begins in 1967.

Filed Under: Information, News, Opinion Tagged With: Drought, Murray River

Not a Natural Disaster, Just another Rainfall Deficit

February 27, 2014 By jennifer

In announcing yesterday’s $320 million drought assistance package for farmers there was some mention of the situation out west being akin to a natural disaster. A more accurate description would be that its part of a natural cycle – not a natural disaster.

There are many reasons why landholders may be particularly vulnerable to this drought, but they mostly relate to government initiatives that have over the last couple of decades significantly eroded the resilience of farming communities, rather than exceptional climate.

We live in a land of highly variable rainfall that has historically experienced regular drought often broken with big floods.

The Bureau of Meteorology has been defining the drought as a rainfall deficient for a 16-month period (October 2012-January 2014) relative to a long-term average defined as the years 1961-1990. So according to the Bureau there has been a severe rainfall deficiencies (lowest 10% to 5% of records) in place across much of inland Queensland, central northern New South Wales and in a small area on the coast of Western Australia near Shark Bay. Also, most of Queensland west of the ranges, northern New South Wales, northeastern South Australia and the southeastern Northern Territory has received less than 65% of the long-term (1961–1990) average rainfall for the 16-month period.

While I am sympathetic to farmers struggling to make ends meet, and I don’t begrudge anyone some government support when the chips are really down, to suggest there is a natural disaster because rainfall is less than 65% of what it was during the period 1961-1990 for a period of a bit over a year is absurd. Australian rainfall

[Read more…] about Not a Natural Disaster, Just another Rainfall Deficit

Filed Under: Information, News Tagged With: Drought

It Never Rains

March 5, 2011 By jennifer

“POETRY, said Auden, makes nothing happen. Usually it doesn’t, but sometimes a poem gets quoted in a national argument because everybody knows it, or at least part of it, and for the occasion a few lines of familiar poetry suddenly seem the best way of summing up a viewpoint…

“Before the floods, proponents of the Catastrophic Anthropogenic Global Warming (CAGW) view had argued that there would never be enough rain again, because of Climate Change. When it became clear that there might be more than enough rain, the view was adapted: the floods, too, were the result of Climate Change. In other words, they were something unprecedented. Those opposing this view — those who believed that in Australia nothing could be less unprecedented than a flood unless it was a drought — took to quoting Dorothea Mackellar’s poem ‘My Country’… 

Read more from Clive James here http://www.standpointmag.co.uk/node/3743/full

[Via Neville]

Filed Under: History, Opinion Tagged With: Climate & Climate Change, Drought, Floods

Market Research and Unhealthy Rivers: David Boyd

December 18, 2010 By jennifer

The market researchers/analysts tell me that you wont win a “counter-intuitive” argument. Because people have been conditioned by repetitive claims of a particular point of view, to forthrightly state the opposite is likely to be dismissed out of hand. So they advise coming at the issue in a more subtle or different way. Sorry,but I am just not built that way! I like to think that I seek after truth and get emotionally upset when I see claims that I regard as untruthful. I do understand that there are deep philosophical arguments about what is truth, but let’s keep it simple.

The debate about our inland rivers is a good example. It seems to me that the (conditioned) starting point for most commentators is that it is taken as a given that “our rivers are unhealthy and that this is due to taking too much water out of them”. The MDB Plan certainly starts from that accepted position. I think that both the lack of health and the excessive extraction claims, are untrue. (And this is where your counter-intuition is triggered and I’ve lost you!) But, please read on…

at David Boyd’s Blog

Filed Under: News, Opinion Tagged With: Drought, Floods, Murray River, Philosophy

Save the Murray: Remove the Barrages

September 19, 2010 By jennifer

The release of a new Murray Darling Basin plan on October 8, 2010, is likely to reignite debate over how best to solve the problems of the Murray River. It will further pit some environmentalists and some South Australians against upstream irrigators as a debate over how to fix the two very large freshwater lakes at the very bottom of the Murray River rages. Lake Alexandrina and Lake Albert are situated behind the narrow expanse of water known as the Coorong, beyond the Coorong is the Southern Ocean and upstream of the lakes is the River proper. 

Few understand how different ecologically this region was before European settlement and the impacts of agriculture and the construction of barrages designed to keep salt water out. Oral histories from local families and the diaries of the first European explorers paint a different picture of the Lakes than that shaping the debate today. If we look back to what the river was like before the barrages then there is a much different solution than that currently being proposed. A solution that may not be as palatable to the South Australian Government or those communities who have grown used to life behind the barrages but a much cheaper and more environmentally sustainable solution in the longer term.  

Many academics and bureaucrats deny that the lakes were ever estuarine. But families that have lived in the region for generations explain, for example, that in 1915, before the barrages and during a period of prolonged drought, sea water penetrated beyond Lake Alexandrina up the River Murray as far as Mannum with the sightings of a shark at Tailem Bend and a dolphin at Murray Bridge.

Since 1941 and the completion of the barrages blocking 90 percent of flows between the lakes and the South Ocean a new history and geography of the Lower Lakes, Coorong and Murray mouth has been created…

Read more here at Quadrant Online.

Filed Under: Opinion Tagged With: Drought, Murray River, Water

  • Go to page 1
  • Go to page 2
  • Go to page 3
  • Interim pages omitted …
  • Go to page 5
  • Go to Next Page »

Primary Sidebar

Recent Comments

  • Ian Thomson on Vax-ed as Sick as Unvax-ed, Amongst My Friends
  • Dave Ross on Vax-ed as Sick as Unvax-ed, Amongst My Friends
  • Dave Ross on Vax-ed as Sick as Unvax-ed, Amongst My Friends
  • Alex on Incarceration Nation: Frightened of Ivermectin, and Dihydrogen monoxide
  • Wilhelm Grimm III on Incarceration Nation: Frightened of Ivermectin, and Dihydrogen monoxide

Subscribe For News Updates

  • This field is for validation purposes and should be left unchanged.

November 2025
M T W T F S S
 12
3456789
10111213141516
17181920212223
24252627282930
« Jan    

Archives

Footer

About Me

Jennifer Marohasy Jennifer Marohasy BSc PhD has worked in industry and government. She is currently researching a novel technique for long-range weather forecasting funded by the B. Macfie Family Foundation. Read more

Subscribe For News Updates

Subscribe Me

Contact Me

To get in touch with Jennifer call 0418873222 or international call +61418873222.

Email: jennifermarohasy at gmail.com

Connect With Me

  • Facebook
  • LinkedIn
  • RSS
  • Twitter
  • YouTube

Copyright © 2014 - 2018 Jennifer Marohasy. All rights reserved. | Legal

Website by 46digital