• Skip to primary navigation
  • Skip to main content
  • Skip to primary sidebar
  • Skip to footer
Jennifer Marohasy

Jennifer Marohasy

a forum for the discussion of issues concerning the natural environment

  • Home
  • About
  • Publications
  • Speaker
  • Blog
  • Temperatures
  • Coral Reefs
  • Contact
  • Subscribe

Climate & Climate Change

Part 2 of IPCC Fifth Assessment Report

March 23, 2014 By jennifer

The Intergovernmental Panel on Climate Change’s Fifth Assessment Report (AR5) is being released in four parts with Working Group II due to officially release their contribution on “Impacts, Adaptation and Vulnerability” in Yokohama, Japan, on Monday 31 March.

Comments on the IPCC report, and pre-release publicity, are welcome in the following thread.

For an alternative perspective on climate change the Nongovernmental International Panel on Climate Change (NIPCC) will be posting their second report in the next week or so. In the meantime their March 2014 Archive of Scientific Literature Reviews can be accessed here http://www.nipccreport.org/issues/2014/mar.html

Filed Under: Information Tagged With: Climate & Climate Change

What Drives Change in Antarctic Sea Ice Cover?

March 11, 2014 By jennifer

THE modern meteorologist relies on computer models for forecasting. Coupled atmospheric-ocean models, known as general circulation models, are favoured for medium to long-range forecasting with these models forecasting an overall and quite rapid general warming at the north and south poles. In accordance with this forecast, there has been a general decline in the extent of sea ice at the Arctic. At the Antarctic, however, sea ice has increased in extent, at least over the period of the satellite record, Figure 1.[1] Sea Ice Cover

I’m interested to know what might have driven the overall decline in the sea ice at the Arctic, and increase at the Antarctic, over the last thirty or so years. According to mainstream climate science, increasing levels of atmospheric carbon dioxide would drive the melt. But what would drive the increase?

A long-range weather forecaster who relies on a knowledge of solar and lunar cycles, rather than computer models, is Kevin Long. He claims that when there is more sea ice at the Antarctic there is generally below-average rainfall and heavier late season frosts in central Victoria.[2]

In an explanation of the origins of our understanding of the Southern Oscillation, which the mainstream climate science community believes has a major affect on rainfall over eastern Australia, Donald R. Mock from the US National Oceanic and Atmospheric Administration (NOAA) suggests early researchers dismissed any direct influence of solar activity on the phases of the Southern Oscillation, but took an interest in the possibility of a connection with the polar circulation particularly the extent of sea ice at the Antarctic [4]. Nowhere in this explanation, however, is an extraterrestrial link, whether lunar, solar or planetary, offered.

A fellow I know who takes an interest in solar-terrestrial physics because his business of installing radio and television antennae depends on it, claims a relationship between the global sea ice anomaly and lunar cycles. In particular, Siliggy claims that the global sea ice anomaly goes up when the moon is new at apogee and down when the moon is full at apogee.[3] On January 1 and January 30, 2014 there was synchrony between perigee and the new moon.[3]. I can’t see a period when there is synchronoy between new or full moons at apogee until March 5, 2015, when the moon will be full at apogee.[3]

****
[1] Ole Humlum Climate4You update for January 2014 http://www.climate4you.com/Text/Climate4you_January_2014.pdf
[2] Kevin Long summer forecast http://thelongview.com.au/documents/FORECAST-2014-No1-SUMMER-Kevin-Long.pdf
[3] The moon orbits the earth in an ellipse, not a circle, and so there are period when it is closer (perigee) and further away (apogee) in each one-month cycle. Also during this cycle there are periods when the moon is the same side of the earth as the sun (new moon) and on the opposite side of the earth to the sun (full moon). For new and full moon phases and perigees and apogees for 2014 see Lunar perigee and apogee calculator at https://www.fourmilab.ch/earthview/pacalc.html
[4] The Southern Oscillation: Historical Origins by Donald R. Mock, written 1981. http://www.esrl.noaa.gov/psd/enso/misc/hxsoi.html

Filed Under: Information Tagged With: Climate & Climate Change, Rainfall forecasting

Myth and the Bureau of Meteorology

March 5, 2014 By jennifer

WE know that the Australian Bureau of Meteorology can’t forecast weather more than a few days out. So why should we believe a climate forecast to 2030?

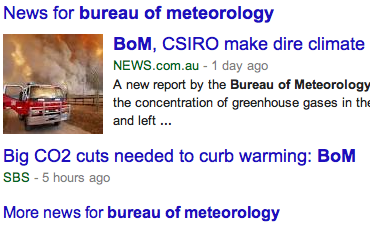
According to Sara Phillips, writing for the Australian Broadcasting Corporation, the Bureau’s new State of the Climate 2014 report is a reliable source of information because it distils hundreds of experiments into three consistent reports.BOM

In fact there are few if any experiments that have been distilled in the writing of the reports. Rather Bureau staff have ran some computer simulations designed to produce a particular output, and combined this with homogenised and adjusted historical records again designed to produce a particular result. Conclusions include:

1. Australia’s climate has warmed by 0.9°C since 1910, and the frequency of extreme weather has changed, with more extreme heat and fewer cool extremes.

2. Global mean temperature has risen by 0.85°C from 1880 to 2012.

When I wrote to the Bureau in January asking why the national average is only calculated back to 1910, I received a reply explaining that data prior to 1910 “is often fragmented and of uncertain or low quality”. If this were the case, it begs the question how a global mean temperature can be calculated back to 1880?

This is one of seven questions I’ve put to Greg Hunt, Minister for the Environment, in a letter dated 4th March 2014. Minister Hunt is ultimately responsible for the operations of the Bureau and I’m of the opinion their operations deserve close scrutiny.

There is this myth that the Bureau is comprised of hard working scientists providing, like the Australian Broadcasting Corporation, information without bias or agenda. More likely the Bureau, like the mainstream climate science community more generally, has become somewhat compromised.

Of particular concern to me, is the Bureau’s decision of last June, to discard the statistical models that had been used to generate seasonal rainfall forecasts in favour of a general circulation model that has no predictive skill at all. I have documented the absence of skill in the general circulation model in a peer-reviewed paper recently published in the journal Atmospheric Research (Volume 138, Pages 166-178).

I conclude my letter to Minster Hunt with comment that:

If the temperature record for Australia can be extended back to 1860, providing an additional 50 years of data, then this should be a priority. This information is more important than the calculation of a national average temperature. If data is to be adjusted and homogenized then the methodology applied needs to be clearly stated. Indeed having access to all the available records as far back as possible is important because it helps unravel the true features of the natural climate cycle, a goal that meteorologists and astronomers were working towards well before the establishment of the Bureau in 1908.

In arriving at theories that explain the natural world, the best scientists always use all the available data, not just the data that happens to fit a particular viewpoint. Furthermore, long historical data series are critical for statistical methods of rainfall forecasts, including the application of artificial neural networks that can currently provide more skillful forecasts than POAMA, the general circulation model currently used by the Bureau to produce the official forecasts. That the Bureau persists with POAMA, while failing to disclose to the Australian public the absence of any measurable skill in its monthly and seasonal forecasts, should be of grave concern to the Australian parliament.

My letter to the Minister can be read in its entirety here: https://jennifermarohasy.com.dev.internet-thinking.com.au/questions-for-the-australian-bureau-of-meteorology/

Filed Under: Information, News, Opinion Tagged With: Climate & Climate Change, Rainfall forecasting, Temperatures

Peer-Reviewed Papers Supporting Skeptical Arguments Against AGW Alarmism

February 14, 2014 By jennifer

Wanting to find a list of peer-reviewed papers supporting an alternative perspective on climate change? It’s just been compiled by the geeks at popular technology.net

http://www.populartechnology.net/2009/10/peer-reviewed-papers-supporting.html#Preface

So much for the false statement by Al Gore in 2000 that:

“There was a massive study of every scientific article in a peer reviewed article written on global warming in the last ten years. They took a big sample of 10 percent, 928 articles. And you know the number of those that disagreed with the scientific consensus that we’re causing global warming and that is a serious problem out of the 928: Zero. The misconception that there is disagreement about the science has been deliberately created by a relatively small number of people.”

The list includes 1350 plus papers on a range of topic: [Read more…] about Peer-Reviewed Papers Supporting Skeptical Arguments Against AGW Alarmism

Filed Under: Information Tagged With: Climate & Climate Change

Last Year, 2013: A Hot Year for Australia

January 7, 2014 By jennifer

ANOTHER year, and another announcement from the Australian Bureau of Meteorology that it is getting hotter. Indeed on January 3, 2014, David Jones, Manager of Climate Monitoring and Predictions at the Bureau, explained in a radio interview that: “We know every place across Australia is getting hotter, and very similarly almost every place on this planet. So, you know, we know it is getting hotter and we know it will continue to get hotter. It’s a reality, and something we will be living with for the rest of this century.”

I’m not sure that its going to continue to get hotter, but last year was hot.

According to Dr Jones, the hottest place in 2013 was Moomba in South Australia where a temperature of 49.6°C was recorded in January. What Dr Jones didn’t explain, however, is that temperatures have only been recorded at Moomba since 1995. So we don’t actually know how hot it was at Moomba during the federation drought or in 1939.

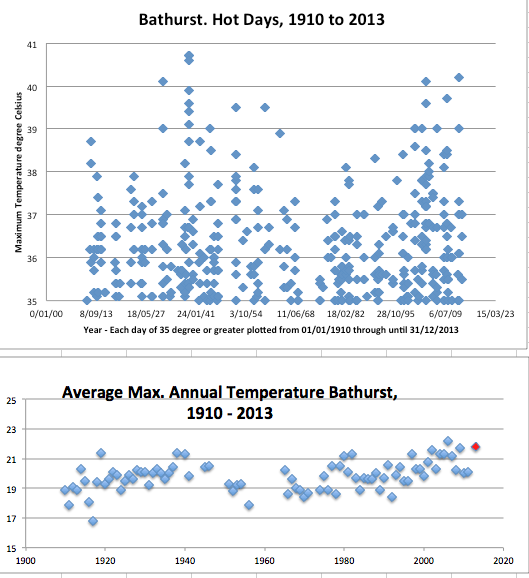
I’ve been following trends at Bathurst where temperatures have been recorded at the jail since 1858 and at the agricultural college since 1908. In October, after plotting days when maximum temperatures exceeded 35 degree Celsius, I indicated that there has been no increase in hot days at Bathurst, http://www.mythandthemurray.org/no-increase-in-hot-days-at-bathurst-or-the-misguided-politics-of-attributing-bushfires-to-global-warming/ .

But after plotting the really hot days through until the end of 2013, I’m happy to concede that it’s virtually as hot now as it was back in 1939, Chart 1. On 11th January 1939 temperatures climbed to 40.7 degrees at the Bathurst agricultural station. In January last year it reached 40.2 degrees. Furthermore, when averages maximum temperatures are combined for each year, there appears to be a slight warming trend, Chart 2.

Charts 1 n 2

Unfortunately, the average for the year 1939 is not shown in Chart 2 as maximum daily temperatures are not available in the digitized record for May through to September of that year for this site. The hottest year at the Bathurst agricultural college according to this statistic (whereby maximum daily temperatures are averaged for the year) was 2006 with an annual average maximum daily temperature of 22.2 degrees compared to an average maximum for 2013 of 21.8 degrees.

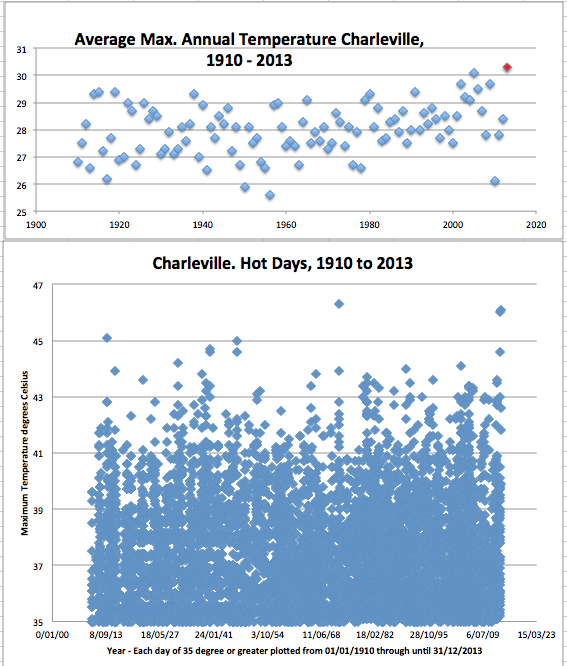
If we go further north to western Queensland and consider the long temperature trend for Charleville, then last year appears to be a record hot year, Chart 3. All years are shown from 1910 based on my averaging of the available daily maximum values from the Bureau’s homogenized ACORN* data set to the end of 2012. I’ve relied on the raw daily values for 2013. I’ve made no adjustments for missing values in this record and have not compared the raw data to the end of 2012 with the ACORN-SAT adjusted data.*

When individual hot days are plotted for Charleville, the hottest day at 46.3 degree Celsius shows as 4th January 1973, Chart 4. This is closely followed by 46.0 degrees recorded just last year on 29th December 2013. And just a few days ago, on 3rd January 2014, it was 46.1 degrees at Charleville.

Charts 3 and 4 revised

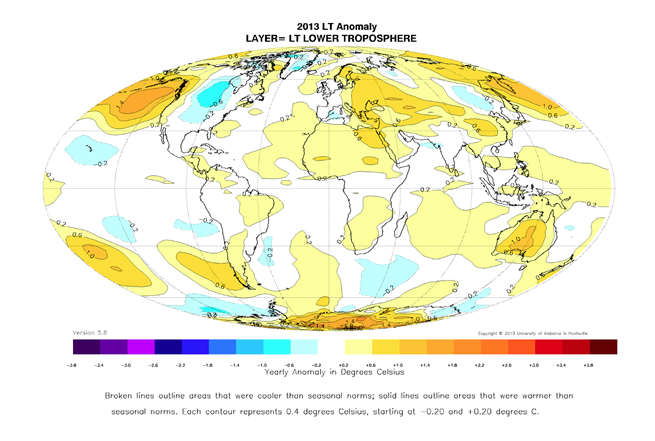
The hotter than average conditions in Australia for 2013 show up in the satellite record as published by the University of Alabama in Huntsville, Chart 5. According to this record, globally 2013 was the fourth warmest year since measurements began in 1978, http://wattsupwiththat.com/2014/01/03/global-temperature-report-december-2013/ .

Satellite Temps 2013

*****

ACORN-SAT is the Australian Climate Observations Reference Network – Surface Air Temperature. Data can be downloaded here http://www.bom.gov.au/climate/change/acorn-sat/ .

Ken Stewart, John Sayers, Jo Nova and others have shown up many issues with this database, for example, http://joannenova.com.au/2012/06/threat-of-anao-audit-means-australias-bom-throws-out-temperature-set-starts-again-gets-same-results/ . It nevertheless remains a useful source of information. For the Bathurst agricultural station the long unadjusted data set (recently purchased by me from the Bureau) accords well with the publically available ACORN dataset. I have no particular opinion on the reliability of the Charleville ACORN data as I do not have access to the unadjusted Charleville data before 1948.

Filed Under: Information, News Tagged With: Climate & Climate Change, Temperatures

When Is the Right Time to Abandon Ship?

December 30, 2013 By jennifer

IN September, Patrick J. Michaels likened the Intergovernmental Panel on Climate Change to a treed cat. He wrote, “Instead of closing its eyes and scurrying to the ground, it climbs onto even higher and thinner branches, while yowling ever louder.”

Dr Michaels then went on to ask, how does the IPCC back down from a quarter-century of predicting a quarter of a degree (Celsius) of warming every decade, when there’s been none for 17 years now?

Chris Turney, professor of climate change at the University of New South Wales, could be described as a cat stuck on a high branch tweeting, but he’s actually at the Antarctic and should be considering abandoning ship, except that there is no clear water into which to launch a life raft.

According to the website Boatsafe.com it can be a difficult decision knowing just when to make the call and it is quite common for captains to wait too long to successfully get clear of a floundering foundering boat.

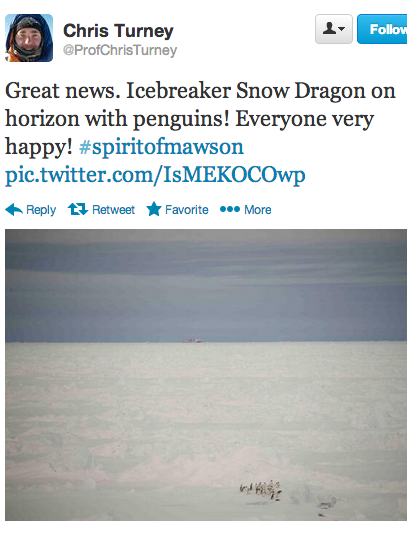
Four days ago the Professor Captain tweeted: “Great news. Icebreaker Snow Dragon on horizon with penguins! Everyone very happy!”Penguins_n_SnowDragon

Happy because the Chinese ice-breaking vessel Snow Dragon was expected to clear a path for the stricken ship by Friday night, avoiding the need to abandon ship.

That was after this 233-foot-long Russian-flagged ship sent out a distress signal on Christmas Eve, which was picked up by the Falmouth Maritime Rescue Coordination Center, in the U.K. As the floundering ship is in the Australian search-and-rescue region, the message was passed on to AMSA, and three ice-breaking ships were sent to the rescue.

So far there has been no mention of the climate by the professor of climate change.

But some positive reporting of the weather.

When it looked like the Snow Dragon would be unsuccessful in its bid to cut through 20 kilometres of sea ice frozen to an average depth of perhaps 10 metres, Professor Captain Turney explained that the weather had improved and the ship was no longer in a blizzard.

So, presumably no need to abandon ship.

Next day the Professor Captain tweeted that the ice was cracking. Still no mention of climate. But this time he did report that the weather had deteriorated with snowfalls and stronger winds.

Still no suggestion they abandon ship. In fact Turney tweeted confidently that the second ice-breaker, an Australian ship the Aurora, would be able to successfully rescue them. This despite reports that there was a growing distance between their floundering stricken ship and open water.

Oh. And wind conditions were putting a lot of strain on one side. Turney added that, “The build-up of ice on one side has given it quite a tilt.”

Not the climate, but the ship.

In fact must be five days stranded now, no clear water, and no mention of climate change.

I am surprised because there is surely potential for some simple climate change type calculations that could be done by the many scientists onboard.

For example, Professor Captain Turney has explained that sea ice can buildup fast because of high winds. Note. High winds, no mention of climate change.

But let me continue.

When the Captain Professor first realized there was no open channel through the ice they were only about two nautical miles from open water. Next thing, more than 20 miles of ice had built up. Now it’s apparently closer to 50 kilometers.

As someone genuinely interested in climate change I ask, “Given the tilting ship, is about 2,800 kilometres south of Hobart, if this catastrophic cooling trend continues, how many days before it is possible to skate across Bass Strait, from Hobart to Melbourne?”

But I digress. Back to the key issue: When is the right time to abandon ship?

As I write the distance between open water with the ice breakers and the tilting ship is somewhere in the vicinity of 50 kilometres. I don’t know how many penguins.

Of possible significance they are running out of coffee.

***
Sources of information
http://www.cato.org/publications/commentary/ipcc-political-suicide-pill

http://worldnews.nbcnews.com/_news/2013/12/27/22059393-great-news-rescue-vessel-within-sight-of-explorer-ship-stuck-in-antarctic-ice

http://www.news.com.au/travel/travel-updates/rescue-vessel-near-university-nsw-professor-chris-turneys-icetrapped-cruise-ship/story-fnizu68q-1226790782675

http://worldnews.nbcnews.com/_news/2013/12/27/22068563-icebergs-blizzards-and-a-creaking-ship-antarctic-explorers-tense-wait-for-rescue?lite

http://www.iol.co.za/scitech/science/environment/vessel-still-stuck-in-antarctic-ice-1.1627313#.UsFrbf2Tqro

Filed Under: Humour, Information Tagged With: Climate & Climate Change

  • « Go to Previous Page
  • Go to page 1
  • Go to page 2
  • Go to page 3
  • Go to page 4
  • Go to page 5
  • Interim pages omitted …
  • Go to page 226
  • Go to Next Page »

Primary Sidebar

Recent Comments

  • Ian Thomson on Vax-ed as Sick as Unvax-ed, Amongst My Friends
  • Dave Ross on Vax-ed as Sick as Unvax-ed, Amongst My Friends
  • Dave Ross on Vax-ed as Sick as Unvax-ed, Amongst My Friends
  • Alex on Incarceration Nation: Frightened of Ivermectin, and Dihydrogen monoxide
  • Wilhelm Grimm III on Incarceration Nation: Frightened of Ivermectin, and Dihydrogen monoxide

Subscribe For News Updates

  • This field is for validation purposes and should be left unchanged.

November 2025
M T W T F S S
 12
3456789
10111213141516
17181920212223
24252627282930
« Jan    

Archives

Footer

About Me

Jennifer Marohasy Jennifer Marohasy BSc PhD has worked in industry and government. She is currently researching a novel technique for long-range weather forecasting funded by the B. Macfie Family Foundation. Read more

Subscribe For News Updates

Subscribe Me

Contact Me

To get in touch with Jennifer call 0418873222 or international call +61418873222.

Email: jennifermarohasy at gmail.com

Connect With Me

  • Facebook
  • LinkedIn
  • RSS
  • Twitter
  • YouTube

Copyright © 2014 - 2018 Jennifer Marohasy. All rights reserved. | Legal

Website by 46digital