• Skip to primary navigation
  • Skip to main content
  • Skip to primary sidebar
  • Skip to footer
Jennifer Marohasy

Jennifer Marohasy

a forum for the discussion of issues concerning the natural environment

  • Home
  • About
  • Publications
  • Speaker
  • Blog
  • Temperatures
  • Coral Reefs
  • Contact
  • Subscribe

Climate & Climate Change

The Need for a New Paradigm, Including for Rainfall Forecasting

July 11, 2014 By jennifer

The following paper was delivered by Jennifer Marohasy at the Ninth International Conference on Climate Change in Las Vegas on Wednesday 9th July 2013 in Panel 13.

Jennifer Marohasy at 9ICCC

SCIENTIFIC disciplines are always underpinned by theories that collectively define the dominant paradigm. In the case of modern climate science that paradigm is anthropogenic global warming (AGW). It defines the research questions asked, and dictates the methodology employed by the majority of climate scientists most of the time. AGW may be a paradigm with little practical utility and tremendous political value, but it’s a paradigm none-the-less. The world’s most powerful and influential leaders also endorse AGW. Even Australia’s Prime Minister Tony Abbott said in June, “I don’t think people should run around pretending there is disagreement when none exists. President Obama and myself both take climate change very seriously.”

AGW has even dictated the question for this session, “How is climate change affecting sea level, rainfall and water availability? Will a warming planet complicate or alleviate water challenges?”

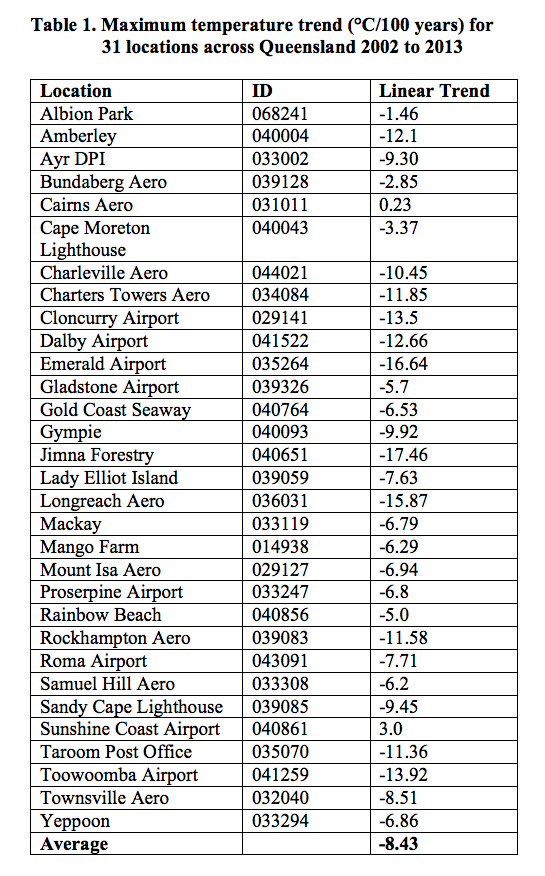
But what is the utility of such a question, particularly given there is growing evidence that planet earth has already entered what could become a protracted period of cooling? This is not what we hear in the mainstream media, but this view is supported by evidence in the unadjusted temperature data for my state of Queensland in Australia, and is also what some astrophysicists have been forecasting for some time.

If mainstream science operated under a different paradigm, one where researchers believed it was possible to forecast weather and climate not just 3 days in advance, but with a high level of skill 3 months, or 3 years in advance, and if their primary focus was not justice, equity and curbing greed, but rather the provision of useful information to Joe Citizen, the question for this session might have been very different. “How much rain is forecast to fall on California’s Central Valley each and every month for the next 2 years?” Answering such a question could not only aid food production, but also facilitate planning for floods and drought. The work I have been undertaking with Professor John Abbot, Central Queensland University, is attempting to address this type of question for Queensland, Australia.

The General Circulation Models (GCMs) that underpin the paradigm of AGW have difficulty generating rainfall forecasts with any real level of skill more than 4 days in advance. If a fraction of the billions spent developing these simulation models, had instead been invested in a theory of climate underpinned with state-of-the-art statistical models based on an understanding of natural climate cycles, I believe we would be much closer to being able to mitigate climate variability across the globe through better rainfall forecasts with very significant benefits for all of mankind, but particularly subsistence farmers in places like India. In short, what we really need is a new paradigm for climate science, underpinned by new tools with some utility.

So, what I will do in the limited time available today is tell you something about how artificial neural networks (ANNs), a form of Artificial Intelligence (AI), have potential as a new tool for a new paradigm, and in particular their application to rainfall forecasting. I will then be in a position to better answer the question for this session concerning rainfall and water availability in a warming world.

ANNs are massive, parallel-distributed, information-processing systems with characteristics resembling the biological neural networks of the human brain. Imagine a computer with the capacity to search and find the complex linear, and also nonlinear relationships, which may exist between local temperature, rainfall, and Pacific Ocean phenomena including changing patterns of sea surface temperatures and pressure. Image a computer with a powerful and versatile data-modelling tool that is able to capture and represent input and output relationships acquiring knowledge, through learning from multiple examplars deciphered from vast arrays of historical data, storing this knowledge within inter-neuron connections strengths known as synaptic weights. A computer that can learn relationships, model and measure relationships, then use this information to forecast rainfall.

This is essentially what the ANN that John Abbot and I built to forecast rainfall for 17 locations across Queensland can do. In a paper by us published two year ago by the Chinese Academy of Sciences’ journal Advances in Atmospheric Science (Volume 29) we detail the model and demonstrate how much more skilful medium-term monthly forecasts from this model are, relative to forecasts from the Australian Bureau of Meteorology’s best GCM. In a more recent publication in the journal Atmospheric Research (Volume 138) we show how forecasts for Queensland are improved with inclusion of the Inter-decadal Pacific Oscillation. In a conference paper presented a year ago in Southampton (River Basin Management VII, WIT Press) we show the potential of ANN to forecast extreme rainfall, specifically the devastating flooding that submerged Queensland’s capital Brisbane, in January 2011.

We have another paper currently in press at the International Journal of Sustainable Development and Planning, which considers the affect of a 3 degree C increase in temperature on rainfall, a component of the question for this panel. What did we find? In our cast study when maximum and minimum temperatures were increased by 3 degree Celsius there was a decline in summer rainfall and an increase in winter rainfall at a placed called Nebo in central Queensland.

The bottom-line is that ANNs can already provide better medium-term rainfall forecasts for Queensland, Australia. This has a real practical value. ANNs can also provide an independent method of GCM validation under future climates with results from Nebo suggesting a smoothing of the annual variability in rainfall rather than more climatic extremes assuming global warming.

ANNs use the existence of recurrent patterns in historical data to inform the rainfall forecast. That our rainfall forecasts drawing in most cases on about 85 years of temperature data show considerable skill, means natural climate cycles must persist. Climate is not on a new trajectory as suggested by many proponents of AGW.

A great advantage of using ANNs is that they can easily be adapted to test and incorporate additional input data series, as climatic knowledge develops. If the relationship can be quantified it can be modelled by an ANNs, including potentially lunar, solar and planetary cycles.

While AGW is a demonstrably failed paradigm, it will be replaced only when a critical number of practicing scientists start working on something new. New paradigms always have their own questions and their own tools. In the same way that GCMs underpin AGW theory, ANNs could underpin a new paradigm based on better quantifying the drives of natural climate cycles.

Henry David Thoreau wrote, “In the long run, men only hit what they aim at.” What are we as a community of sceptics aiming for? Just the overthrow of AGW, or can we aim much higher, including for skilful rainfall forecasts?

Thank you.

Acknowledgements

I would like to thank The Heartland Institute for the opportunity to present at the Ninth International Conference on Climate Change. All the research on the application of artificial neural networks to medium-term rainfall forecasting detailed here has been done in collaboration with Professor John Abbot funded by the B. Macfie Family Foundation.

A video of the talk can be found at this link… http://climateconferences.heartland.org/breakout-1-streaming/
Scroll to find image of me in red, click on the link. The tiny URL for this blog post is http://tinyurl.com/m6fbq9p.

Filed Under: Information Tagged With: Artificial Neural Networks, Climate & Climate Change

Cooling Temperature Trend Establishing Across Northeastern Australia

June 11, 2014 By jennifer

The Hon Greg Hunt MP,
Minister for the Environment.

Dear Minister Hunt,

I wrote to you on 4th March 2014 with concerns that the claims made by the Bureau of Meteorology that 2013 was Australia’s hottest year on record, are somewhat deceptive. In that letter I explained that the official temperature record has been truncated to begin in 1910 (thereby excluding the hot years of the Federation drought) and that the method used to calculate the annual average temperature for Australia is not transparent.

I’ve since come to understand that the annual average temperature for 2013, which the Bureau claimed was a record, is in fact a wholly contrived valued based on modeling of temperatures, rather than the averaging of actual recorded values. That is, careful scrutiny of the Bureau’s methodology shows that recorded temperatures at locations across Australia are submitted to a two-step homogenization process that can have the effect of changing the entire temperature trend at specific locations. A weighted mean of these ‘homogenized’ values is then used in the calculation of the Australian annual mean temperature. In turn, the ‘homogenized’ values are used by the Intergovernmental Panel on Climate Change (IPCC), which gives advice back to the Australian government on global and Australian temperature trends.

A problem with this approach is that it can deliver an impression of climate change which accords wholly with expectations. But, it is reality that Australians should be planning for, so it would be better if the Bureau used real data, rather than modeled output when reporting temperature trends. Indeed to quote Aldous Huxley, ‘Facts don’t cease to exist because they are ignored.’

At the invitation of the Sydney Institute, I will be giving a talk on 25th June 2014, that shows the detail of how this methodology is applied, using the locations of Bourke in western NSW and Amberley in Queensland as case studies. I encourage attendance from the Bureau to scrutinize my presentation for accuracy. Indeed, all Australians should have a clear understanding of the nature of the data used in the calculation of important and highly publicized temperature statistics. All Australians should also have access to a realistic assessment of current temperature trends.

Very recently it was brought to my attention that Graham Williamson wrote to Rob Vertessy, Director of Meteorology at the Bureau, also querying the claimed increase in temperatures. Mr Williamson, in his letter of 27th May 2014, specifically asked why the Bureau of Meteorology did not acknowledge the 15-year hiatus in global warming as detailed in the recent report from the Intergovernmental Panel on Climate Change (IPCC, Chapter 10, AR5). In reply to Mr Williamson, Neil Plummer from the Bureau has suggested that the IPCC is simply referring to a slow down in the rate of global warming, rather than a pause as such. Given the IPCC reports are based on temperature trends derived from ‘homogenized’ data, rather than real observational records, I am concerned that they may also not be giving a true picture of recent climate change. To reiterate, even the IPCC is using modeled output rather than real data.

As part of ongoing research into natural rainfall patterns in Queensland, Professor John Abbot and I have been studying the temperature record for northeastern Australia, as temperature is a key input variable in our neural network models (e.g. Abbot and Marohasy 2014). Considering the data from the late 1800s until 1960, a cooling trend is evident, followed by warming between 1960 and 2001. In contrast, the last 12 years show quite dramatic cooling, Table 1. All three periods have occurred while greenhouse gases, particularly carbon dioxide, have been increasing in concentration in the atmosphere.

temps

Our analysis of the maximum temperature trend for the years 2002 to 2013 is based, not on the modeled temperature values used to generate official temperature statistics, but on the unadjusted observed temperatures also available from the Bureau of Meteorology website. The thirty-one sites across Queensland were chosen on the basis that there is a continual temperature record for the period 2002 to 2013 at each of the locations. We choose 2002 as the start date, as the data suggests a change in trend at about this year from warming to cooling. This is consistent with published studies by astrophysicists and physicists (e.g. Nicola Scafetta 2010, Abdussamatov 2012, and Lu 2013) and closely follows the timing of the last solar maximum (eg. NASA update 02/05/2014, http://solarscience.msfc.nasa.gov/predict.shtml). While Table 1 is limited to Queensland, preliminary assessment of data from NSW, Victoria and the Northern Territory also suggests the onset of a cooling trend.

This information is in stark contrast to the information in the State of the Climate Report 2014 recently published by the Bureau and also CSIRO. The report states that “warming over Australia has been consistent” and temperatures are “projected to continue to increase, with more hot days and fewer extremely cool days.”

In order to reconcile the information in Table 1, with the claims in the State of the Climate Report 2014, it is important to realize that, like the calculation of the annual mean temperature for Australia, data present in the report is based wholly on modeled output. That is observed temperature values have been first passed through a two-step homogenization process involving the application of complex mathematical algorithms.

It is important to make a distinction between output from a computer model and real data. In his book Science and Public Policy: The virtuous corruption of virtual environmental science Aynsley Kellow, Professor and Head of the School of Government at the University of Tasmania, shows through many examples, including from climate science, how a reliance on computer models over the last 30 years as well as the infusion of values, has produced a preference for virtual over observational data. But the Australian public and Australian industry deserve much better from the Bureau.

As an Australian scientist with a keen interest in public policy and temperature records, I ask you as the Minister ultimately responsible for the activities of the Australian Bureau of Meteorology, to consider how you might reconcile increasing atmospheric concentrations of carbon dioxide with a falling temperature trend, and what needs to be done if we are to adequately prepare as a nation for the possible onset of a period of sustained cooling.

Yours sincerely

Dr Jennifer Marohasy
Adjunct Research Fellow
Central Queensland University

Links/References

Letter from Jennifer Marohasy to Minister Greg Hunt, 4th March 2014
https://jennifermarohasy.com.dev.internet-thinking.com.au/questions-for-the-australian-bureau-of-meteorology/

John Abbot and Jennifer Marohasy, 2014. Input Selection and optimization for monthly rainfall forecasting in Queensland, Australia, using artificial neural networks, Atmospheric Research, Volume 138, Pages 166-178.

Nicola Scafetta, 2010. Empirical evidence for a celestial origin of the climate oscillations and its implications, Journal of Atmospheric and Solar-Terrestrial Physics, Volume 72, Pages 951-970.

Habibullo I. Abdussamatov, 2012. Bicentennial decrease of the total solar irradiance leads to unbalanced thermal budget of the Earth and the Little Ice Age, Applied Physics Research, Volume 4. DOI: 10.5539/apr.v4n1p178

Qing-Bu Lu, 2013. Cosmic-ray driven reaction and greenhouse effect of halogenated molecules: culprits for atmospheric ozone depletion and global climate change, International Journal of Modern Physics B, Volume 27, DOI: 10.1142/S0217979213500732

Bureau of Meteorology and CSIRO 2014, State of the Climate 2014 http://www.bom.gov.au/state-of-the-climate/documents/state-of-the-climate-2014_low-res.pdf?ref=button

Filed Under: Information Tagged With: Climate & Climate Change, Temperatures

Corrupting Australia’s Temperature Record

May 17, 2014 By jennifer

Following is the text of a letter that I just this morning sent to Australia’s Chief Scientist, Alan Finkel…

Dear Dr Finkel,

For some years I have been asking for an open, honest and independent inquiry into the operations of the Australian Bureau of Meteorology. In 2015, I wrote to the Auditor-General of Australia suggesting a performance audit with terms of reference to include: consistency with its own policies, and reliability of methodology. At the time my primary concern was the remodelling of raw data through a process known as homogenisation.

In response, it was suggested I direct my concerns to Dr Ron Sandland AM, who at that time was chairing a Technical Advisory Forum to review these same issues, that I had previously raised with then Minister for the Environment, Hon. Greg Hunt MP. It was already clear to me that Dr Sandland and his team were undertaking a most cursory review and not working through a single example of homogenisation. I nevertheless made a submission to Dr Sandland’s Forum that has never been acknowledged.

To be clear, my issues continue to be less with the actual policies, protocols and best practice manuals already in place, but with increasing evidence these are being systematically ignored.

The one issue that I would like to bring to your immediate attention concerns the way temperatures are currently measured in automatic weather stations by electronic probes. This goes to the heart of the integrity and reliability of temperature measurements recorded by the Bureau, which are subsequently homogenised, and incorporated into international databases – including those relied upon by the United Nation’s Intergovernmental Panel on Climate Change (IPCC).

Historically maximum air temperature was measured by mercury thermometers – worldwide. But over recent decades there has been a transition to electronic probes in automatic weather stations.

There is a lot of natural variability in air temperature (particularly on hot sunny days at inland locations), which was smoothed to some extent by the inertia of mercury thermometers. In order to ensure some equivalence between measurements from mercury thermometers and electronic probes it is standard practice for the one-second readings from electronic probes to be averaged over a one-minute period – or in the case of the US National Weather Service the averaging of the one-second readings is over 5 minutes.

The Australian Bureau began the change-over to electronic probes as the primary instrument for the measurement of air temperatures in November 1996.

The original IT system for averaging the one-second readings from the electronic probes was put in place by Almos Pty Ltd, who had done similar work for the Indian, Kuwaiti, Swiss and other meteorological offices. The software in the Almos setup (running on the computer within the on-site shelter) computed the one-minute average (together with other statistics). This data was then sent to what was known as a MetConsole (the computer server software), which then displayed the data, and further processed the data into ‘Synop’, ‘Metar’, ‘Climat’ formats. This system was compliant with World Meteorological Organisation (WMO) and the International Civil Aviation Organisation (ICAO) standards. The maximum daily temperature for each location was recorded as the highest one-minute average for that day.

This was the situation until at least 2011 – I have this on good advice from a previous Bureau employee. It is likely to have been the situation through until perhaps February 2013 when Sue Barrell from the Bureau wrote to a colleague of mine, Peter Cornish, explaining that the one-second readings from the automatic weather station at Sydney Botanical Gardens were numerically-averaged. At some point over the last five years, however, this system has been disbanded. All, or most, of the automatic weather stations now stream data from the electronic probes directly to the Bureau’s own software. This could be an acceptable situation, except that the Bureau no-longer averages the one-second readings over a one-minute period.

Indeed, it could be concluded that the current system is likely to generate new record hot days for the same weather – because of the increased sensitivity of the measuring equipment and the absence of any averaging/smoothing. To be clear, the highest one-second spot reading is now recorded as the maximum temperature for that day at the 563 automatic weather stations across Australia that are measuring surface air temperatures.

This is not generally understood. Most meteorologists and university professors in Australia appear to be working from the wrong assumption that the old system is still in place. Given this data is also used by thousands of other scientists and technologists, not just in Australia but across the world, I urge you to investigate.

My investigations have included scrutiny of actual measurements from the current probe at Mildura, in north western Victoria. This data was made available to me following a directive from the Minister for the Environment, Hon Josh Frydenberg MP, to Andrew Johnson, CEO and Director of Meteorology at the Bureau. This has enabled me to confirm that the automatic weather station at Mildura is logging:
1. The last one-second reading in each one-minute period;
2. The highest one-second reading for the previous 60 seconds, and
3. The lowest one-second reading for the previous 60 seconds.

I have corresponded with the Bureau’s CEO, Andrew Johnson, about the current situation. He has assured me that because the electronic probe is housed in a metal sheath which provides thermal mass, each measurement is actually the integration of the previous 40 to 80 seconds. If this is indeed the case, that the electronic probes have been weighted, then the Bureau should perhaps just sample the lowest one-¬second and the highest one¬-second for the agreed interval? Indeed, why log a single last one-second value from each minute – particularly given the equipment is capable of averaging all seconds, or averaging a subsample of all the one-second readings?

I have requested the manufacturer’s specifications, specifically for the probe at Mildura (Rosemount ST2401 S/N – 654). Dr Johnson has not provided this information, insisting that this is not available because the probes are purpose-designed: “The Bureau purpose-designed the temperature sensors to closely mirror the behavior of mercury in glass thermometers, including the time constant. The manufacturer then manufactured the sensors to the Bureau’s design.”

There is no publicly available documentation for any of the custom-built electronic probes currently used by the Bureau to measure air temperature across Australia.

Furthermore, there are no published studies that provide any indication of the equivalence of measurements from the electronic probes with mercury thermometers, which were used to measure maximum temperatures at all weather stations until at least November 1996.

In order to assess the extent to which the Bureau’s probes actually mirror the behavior of mercury thermometers, I have requested the relevant internal reports that presumably detail the results from field and laboratory trials. These have not been provided. My husband, Dr John Abbot, has requested the same and this information is the subject of an ongoing freedom-of-information (FOI) request by him, which may yet end-up in the Administrative Appeal Tribunal.

Following two interviews I did with radio broadcaster Alan Jones last year, and at the directive of Minister Frydenberg, I was provided with some information enabling me to obtain parallel data from Mildura late last year. This was provided as thousands of photographed A8 forms with each form including hand-written daily values as recorded from the electronic probe and mercury thermometer in the same equipment shelter at Mildura.

The first years of parallel recordings onto the A8 forms (from November 1996) indicate that the electronic probe first installed at Mildura was recording temperatures that were statistically significantly cooler than the mercury thermometer. This should be of concern, as it would indicate that the extent of global warming was being under estimated – and that there was no equivalence between the electronic probes and mercury thermometers with this data incorporated into international databases.

A new probe, the current probe, was installed on 27 June 2012. This is the same probe that measured a much-acclaimed record hot day for the state of Victoria on 23 September 2017- sparking my initial interest in Mildura.

I had initially hoped that there would be parallel data to enable some verification of this record – I had been told by a whistle-blower that Mildura was a site with parallel data. I was subsequently told by Anthony Rea from the Bureau – after the directive given to the Bureau by Minister Frydenberg – that there was parallel data only available through until January 2015.

After scrutiny of the A8 forms actually provided, however, it appeared that the extent of parallel readings for the probe installed on 27 June 2012 would be limited to just the eight months July 2012 to February 2013… except that Dr Rea omitted to provide me with the data for September 2012 – the one month that could provide a direct measure of the equivalence of the relevant probe for that time of year at that location. The residual available parallel data from Mildura as measured by the current electronic probe is missing recordings from the mercury thermometer for the very hottest days as measured by the electronic probe (30 November 2012, 18 January 2013, 5 January 2013, 8 January 2013, 6 January 2013, 1 December 2013, highest to lowest).

In short, it appears that on the hottest days in Mildura – during the period that manual readings were being taken after installation of the most recent probe – no one was turning-up to take the manual reading from the mercury thermometer. As a consequence, the data for this period from the mercury thermometer is not normally distributed. This makes statistical analysis using standard techniques impossible as assumptions implicit, for example in a standard paired T-test, are violated.

The limited parallel data that I have from this probe (currently recording temperatures at Mildura) indicates that, on average, it records temperatures warmer than the mercury thermometer – often up to 0.4 degrees Celsius warmer than the mercury thermometer.

I have communicated this information to Dr Johnson, and he has replied that my sample is inadequate to conclude very much.

Exactly, and this is because the Bureau is not providing me with all the data! So, I would appreciate it if you could ask that he please make the relevant internal reports available and/or provide data from other weather stations for which there is parallel data to enable some proper comparisons and assessment of the Australian-wide system.

I have been reliably informed that there is parallel data (measurements from a mercury thermometer and electronic probe recording in the same shelter) for a further 37 sites, additional to Mildura. I have further been told that this data provides parallel reading to the present for some of these sites. But the Bureau is withholding this information.
In summary, given the intense political interest in climate change with far reaching economic implications, and the relatively recent transition to a very different methods of measuring temperatures (mercury thermometer to electronic probe), it would be assumed that there are dozens of reports published by the Bureau that document how comparable the measurements have proven at different locations, and under different conditions.
Yet there are none! Without independent verification, these temperature recordings of the Bureau are open to dispute and the integrity of the Bureau and the Government is degraded.
I have heard you lament that there is an overwhelming consensus of scientific support for global warming and so we should just get on with solutions. But, without an independent verification of the Bureau’s temperature measurements then those who doubt global warming can easily dismiss the Bureau’s reports as unreliable and incorrect. To help resolve this issue I request that you provide me with the opportunity to present my findings – my evidence – to a relevant committee for proper scrutiny.

Yours sincerely
Jennifer Marohasy BSc PhD
Senior Fellow at the Institute of Public Affairs, and
Owner-operator at the ClimateLab.com.au

3.15PM AEST, FRIDAY MAY 4TH 2018

To download this letter as a pdf, click here: Marohasy-to-Finkel-20180504

ENDS
****

FROM THE ORIGINAL BLOG POST… FROM 2014… CONTINUED

WHILE the average Australian, being sentimental and having a nationalistic streak, would like to believe their Bureau of Meteorology is honestly recording and reporting temperatures, in reality the science managers are corrupting the official record.

Following is another example, another story, to add to the litany as detailed in my unanswered letter to Minister Hunt and recent series of blog posts on Bourke.

KEN Stewart, a retired school principal, became interested in global warming some years ago. After the Bureau released their new so-called High Quality temperature dataset, he decided he would audit it – out of curiosity. He found that changes made to the original data could account for as much as one third of the reported global warming in Australia.

His queries to David Jones, Head of Climate Monitoring and Prediction at the Bureau, were dismissed with comment that the “adjustments” have “a near zero impact on the all Australian temperature”. Which would beg the question, why make the “adjustments” at all. Except that they do change the temperature, they create a significant warming trend.

Eventually, on 20th December 2010, Ken joined Jo Nova, Senator Cory Bernardi and several others to lodge a request to the Auditor-General for a formal audit of the Bureau’s climate data and advice.

But rather than defend the new dataset, the Bureau ditched it, in effect preventing the audit from going ahead.

Then in March 2012, the Bureau announced a new official temperature series this time called the Australian Climate Observations Reference Network- Surface Air Temperatures (ACORN-SAT).

This is the data series used by David Jones from the Bureau to announce in January that last year, 2013, was the hottest year on record ever in Australia.

This “record hot year” is in large part a consequence of the methodology used to construct ACORN-SAT. Ken’s most recent analysis shows that in the creation of ACORN-SAT the Bureau has “adjusted” temperatures both up and down, with almost all the “adjustments” down occurring before 1971, and all the “adjustments” up occurring after 1971. In other words the record before 1971 is cooled, and after 1971 warmed.

The mean difference in the minima trend (ACORN-SAT minus original data), according to Ken, is +0.37 degrees Celsius. Interestingly the difference in the maxima trend is much less, +0.09 degrees. This has the effect of exaggerating warming of the minima, creating a pattern consistent with anthropogenic global warming theory expectations.

The most extreme example that Ken found of data corruption was at Amberley, near Brisbane, Queensland, where a cooling minima trend was effectively reversed, Figure 1.

Amberley 3

Read the full article at http://kenskingdom.wordpress.com/2014/05/16/the-australian-temperature-record-revisited-a-question-of-balance/

*****
Ken Stewart is a retired school principal with a deep-seated scepticism for anything produced by governments, political parties, religious organisations, big business and Greenpeace. Ken believes in family, the power of learning, the importance of asking good questions and finding answers for yourself.

Filed Under: Information Tagged With: Climate & Climate Change, Temperatures

Lunar Modulation of Weather and Climate: Piers Corbyn

May 14, 2014 By jennifer

Long-range weather forecaster Piers Corbyn explains that in order to predict world temperature we need to better understand solar activity, magnetic connections and lunar modulation of the same.

Interestingly, towards the end of this presentation Mr Corbyn, who has a first-class honours degree in physics from Imperial College, London, states that it was as hot in the 1930s and 1940s as it is now. Indeed, this is also what the unadjusted raw temperature data for many places in Australia shows.

Filed Under: Information Tagged With: Climate & Climate Change

Antarctic Wind Change: What has Really Caused It?

May 12, 2014 By jennifer

A farmer near Orange in New South Wales emailed me last month lamenting the lack of interest shown by the national media in SAM – the Southern Annular Mode. He explained that SAM was a key driver of rainfall over southern Australia and changes in the extent of Antarctic sea ice. Rather than report on this real weather phenomenon he wrote, the media carried on about carbon dioxide and global warming.

In fact the national media have today been talking about SAM, but not naming it as such. There has been comment about a new paper in the journal Nature by Australian researchers, Nerillie J. Abram and colleagues that describes how changing wind patterns have affected rainfall across Southern Australia and how these same winds, by contracting around the Antarctic, have caused a reduction in the rate of polar ice melt.

The paper is entitled ‘Evolution of the Southern Annular Mode during the past millennium’ and it attributes changes in the phenomenon to global warming.[1]

So SAM finally gets a mention, but in a story to promote global warming. According to Abram et al., SAM is the highest it has been for at least 1,000 years. SAM, driven by carbon dioxide is causing the main Antarctic continent to cool, and is now displacing ozone depletion as a cause of future ruin.

Yet not so long ago it was published in Nature, and reported by the same media, that global warming would cause Antarctica to melt.

There are alternative explanations.

Kevin Long from Bendigo, Victoria, explains the growth in Antarctic sea ice and the changing position of the westerly wind belt in terms of changes in the 18.6-year Lunar Declination Cycle.

In particular, Mr Long explains that as we approach the next Lunar Minimum Standstill, which will occur in October 2015, there will be weaker lunar air tides, because the moon is not travelling as far south or north as it orbits the earth. This, according to Mr Long, has result in the accelerated growth of ice at the Antarctic.[2]

While it is fashionable to scoff at the possibility that the moon has a major affect on climate, we can see the affect of the gravitational-pull of the moon in the ocean tides. In the same way, the moon’s gravitational-pull creates atmospheric tides that modulate high-altitude winds including the westerly winds.

Antarctica

***
Links/Notes

1. Nature Climate Change (2014) doi:10.1038/nclimate2235
http://www.nature.com/nclimate/journal/vaop/ncurrent/full/nclimate2235.html

2. Rapid Global Cooling Forecast for 2017
http://www.thelongview.com.au/documents/RAPID-GLOBAL-COOLING-FORECAST-IN-2017-Kevin-Long.pdf

For more information on variations in lunar declination and lunar standstills you can always visit Wikipedia http://en.wikipedia.org/wiki/Lunar_standstill . But if you want to be able to relate this information to the weather consider reading Ken Ring http://www.predictweather.co.nz/ShopProducts.aspx?ID=1

Filed Under: Information Tagged With: Climate & Climate Change

Bigots, Climate Change Deniers and George Orwell

April 19, 2014 By jennifer

GEORGE Brandis says it is “deplorable” deniers are being excluded from the climate change debate and people who say the science is settled are ignorant and medieval.

The attorney general called the leader of the opposition in the Senate, Penny Wong, the “high priestess of political correctness” and said he did not regret his comment that everyone has the right to be a bigot in an interview with the online magazine Spiked.

He said one of the main motivators for his passionate defence of free speech has been the “deplorable” way climate change has been debated and he was “really shocked by the sheer authoritarianism of those who would have excluded from the debate the point of view of people who were climate-change deniers”.

“One side [has] the orthodoxy on its side and delegitimises the views of those who disagree, rather than engaging with them intellectually and showing them why they are wrong,” he said…

“The moment you establish the state as the arbiter of what might be said, you establish the state as the arbiter of what might be thought, and you are right in the territory that George Orwell foreshadowed.”

And I’m quoting from Bridie Jabour writing in the The Guardian!

Filed Under: Opinion Tagged With: Climate & Climate Change, Philosophy

  • « Go to Previous Page
  • Go to page 1
  • Go to page 2
  • Go to page 3
  • Go to page 4
  • Interim pages omitted …
  • Go to page 226
  • Go to Next Page »

Primary Sidebar

Recent Comments

  • Ian Thomson on Vax-ed as Sick as Unvax-ed, Amongst My Friends
  • Dave Ross on Vax-ed as Sick as Unvax-ed, Amongst My Friends
  • Dave Ross on Vax-ed as Sick as Unvax-ed, Amongst My Friends
  • Alex on Incarceration Nation: Frightened of Ivermectin, and Dihydrogen monoxide
  • Wilhelm Grimm III on Incarceration Nation: Frightened of Ivermectin, and Dihydrogen monoxide

Subscribe For News Updates

  • This field is for validation purposes and should be left unchanged.

November 2025
M T W T F S S
 12
3456789
10111213141516
17181920212223
24252627282930
« Jan    

Archives

Footer

About Me

Jennifer Marohasy Jennifer Marohasy BSc PhD has worked in industry and government. She is currently researching a novel technique for long-range weather forecasting funded by the B. Macfie Family Foundation. Read more

Subscribe For News Updates

Subscribe Me

Contact Me

To get in touch with Jennifer call 0418873222 or international call +61418873222.

Email: jennifermarohasy at gmail.com

Connect With Me

  • Facebook
  • LinkedIn
  • RSS
  • Twitter
  • YouTube

Copyright © 2014 - 2018 Jennifer Marohasy. All rights reserved. | Legal

Website by 46digital