• Skip to primary navigation
  • Skip to main content
  • Skip to primary sidebar
  • Skip to footer
Jennifer Marohasy

Jennifer Marohasy

a forum for the discussion of issues concerning the natural environment

  • Home
  • About
  • Publications
  • Speaker
  • Blog
  • Temperatures
  • Coral Reefs
  • Contact
  • Subscribe

Blog

Cooper Creek Wilderness in Direct Path of Ita – UPDATED

April 10, 2014 By jennifer

SEVERE Tropical Cyclone Ita, Category 5, is expected to move in a general southwest direction towards the far north Queensland coast tonight and into Friday, while possibly intensifying further. That’s the advice at the Bureau of Meteorology website. cyclone ita

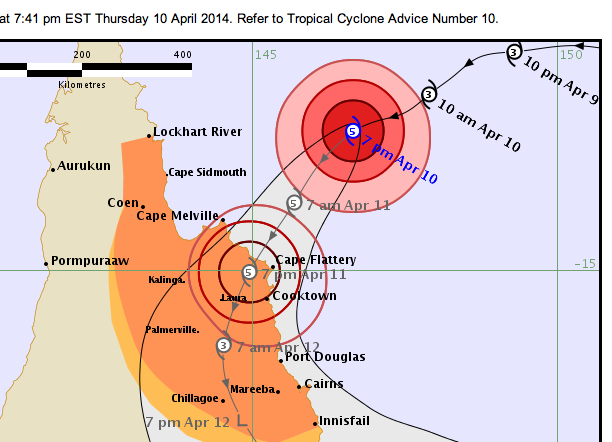
Neil Hewett, who has contributed so many beautiful photographs to this website, and his beloved Cooper Creek Wilderness, are in the anticipated path of the cyclone.

I know Neil built the family home, nestled in the the oldest surviving rainforest on earth, with a cyclone bunker: a specially reinforced windowless pantry. That is where Neil and his family sheltered through Cyclone Yasi, a category five that hit the Daintree Rainforest in 2011.

Anyway, my thoughts will be with the Hewett family over the next couple of days.

Update: Hewett family and cassowaries survived Ita! Walking trails have already been cleared of debris and Cooper Creek Wilderness is back open for business. Neil expects that there will be increased flowering and fruiting over the next year, and perhaps even two breeding periods for the cassowaries, in response to the cyclone. More here…http://www.ccwild.com/enews/display.php?M=1776&C=46f0d1866283fd3d64930902be67673c&S=366&L=14&N=114

Filed Under: Information Tagged With: Wilderness

Rewriting the History of Bourke: Part 3, Shortening an Already Shortened Record

April 9, 2014 By jennifer

AT Bourke temperatures were carefully recorded at the post office for 125 years, from 1871 to 1996. But this record is ignored by those announcing new temperature records on local Bourke radio. They rely on a record that only goes back to 1998!

From about 1952 through until 1996 the Postal Service staff carefully read and recorded the weather in the Stevenson screen at 9am, 12noon, 3pm, 6pm and then went back to the post office each evening at 9pm, 3am – yes the temperature was read manually at 3am by Postal Service staff – and then again at 6am. This information was immediately relayed to the Bureau in Melbourne.

But go to weatherzone.com.au and it suggests that temperatures at Bourke have only been recorded since 1998. What a travesty. Weatherzone_

http://www.weatherzone.com.au/climate/station.jsp?lt=site&lc=48245

There have been complaints to the local radio station that keeps announcing record hot days on the basis of this much-truncated record; temperatures for Bourke back to 1998. The radio station says that it relies on weatherzone.com.au for its information. Complaints to weatherzone have resulted in comment that the Bureau are unable to merge data, and can only provide Weatherzone with information on a station by station basis with the ‘Bourke Airport’ the current open weather station for Bourke.

Meanwhile, when it comes to the generation of contrived temperature data for Australia’s annual average temperature anomaly the Bureau have merged the airport and the post office, in fact the post office has been subsumed by the airport. This data has also been shortened, from 1871 to 1910, and of course ‘homogenized’.

https://jennifermarohasy.com.dev.internet-thinking.com.au/2014/04/rewriting-the-history-of-bourke-part-2-adjusting-maximum-temperatures-both-down-and-up-and-then-changing-them-altogether/

Another travesty.

Filed Under: Information Tagged With: temp

Rewriting the History of Bourke: Part 2, Adjusting Maximum Temperatures Both Down and uP, and Then Changing Them Altogether

April 6, 2014 By jennifer

Anyone who doesn’t take truth seriously in small matters cannot be trusted in large ones either. Albert Einstein.

THE Australian Bureau of Meteorology extrapolates from the particular to the general in the development of their annual climate statements, but with a complete lack of fidelity to the original recorded temperature values at many locations. Indeed scrutiny of their methodology shows that the annual average temperature for Australia is a totally contrived value achieved through the rewriting of history at iconic locations including Bourke in north western New South Wales.

The Bureau’s claim that last year, 2013, was the hottest on record is based on the compilation of data from over 100 individual weather stations, including the station of Bourke, but only back to 1910 and with this data significantly truncated and adjusted.

Bourke has an exceptionally long temperature record, with recordings made at the post office from 1871 until 1996. Then the weather station was moved to the airport.

In part 1 of this series, I explain how individual hot days recorded by the Bourke postmaster have been expunged from the official temperature record and how the data series is significantly truncated. Now let’s consider how adjustments are made to the remaining mean maximum temperature series so that a cooling trend, Chart 1, becomes a warming trend, Chart 2.

Digitised Bourke 2

Chart 1. Mean annual maximum temperature for Bourke post office (1871 to 1996) based on unadjusted digitised data, minus the record hot days. Click on the chart for a larger better view. Find more information and a link to this chart at the Bureau’s website by clicking here.

Official temp data Bourke

Chart 2. The official mean annual maximum ACORN-SAT temperature data for Bourke including more recent temperature data recorded at the airport, but excluding data collected at the post office before 1910. There is more information, and a link to this chart at the Bureau’s website here.

The change from a cooling trend to a warming trend of 0.01 degree Celsius per decade is achieve in part through the following three modification to the original data:

1. Two dramatic adjustments to the original temperatures record: an adjustment down between 1911 and 1915 and an adjustment up between 1951 and 1953.

Adjustments Mean Annual Max. Ken S

Chart 3. Difference between annual mean maximum temperature for ACORN-SAT series minus the original digitised data for Bourke post office 1910-1996. Data compiled and chart drawn by Ken Stewart.

It is reasonable to adjust temperature data to correct for discontinuities caused by changes in site location and exposure. But from August 1908 through until 1996 the Bourke post office did not move and the temperature thermometers continued to be housed in a first class Stevenson screen. It is also reasonable to consider changes in observation time, and changes to metric measurements, even the introduction of automatic weather stations. But none of these potential reasons for adjusting a temperature data series can be used to explain the dramatic adjustments between 1911 and 1915 and 1951 to 1953 to the Bourke post office temperature data, Chart 3.

Rather a perfectly good data series appears to have been butchered to achieve a particular political end.

2. Substituting values recorded at the Bourke Post Office with values from other weather stations.

Jan 1939 Adjusted

Table 1. Recorded maximum daily temperatures at Bourke versus ACORN-SAT maximum daily temperatures at Bourke for January 1939

In a report entitled ‘Techniques involved in developing the Australian Climate Observation Reference Network – Surface Air Temperature (ACORN-SAT) dataset’ (CAWCR Technical Report No. 049), Blair Trewin explains that up to 40 neighbouring weather stations can be used for detecting inhomogeneities and up to 10 can be used for adjustments. What this means is that temperatures, ever so diligently recorded in the olden days at Bourke by the postmaster, can be change on the basis that it wasn’t so hot at a nearby station that may in fact be many hundreds of kilometres away, even in a different climate zone.

Consider the recorded versus adjusted values for January 1939, Table 1. The recorded values have been changed. And every time the postmaster recorded 40 degrees, Dr Trewin has seen fit to change this value to 39.1 degree Celsius. Why?

In the original data the number of consecutive hot days over 40 degree Celsius is 17, Table 1. In January 1896 there were 22 consecutive days over 40 degrees Celsius. But neither of these two series of hot days exist in the current official Bureau record for Bourke because of the all truncating and adjusting.

Ian George, a regular contributor at this blog, has done a comparison of temperatures at Bourke with temperatures at the ‘nearby’ stations of Cobar, Tibooburra and Walgett to see how ‘nearby’ stations could influence Bourke’s temperature for January 1939. These are all ACORN-SAT stations. Ian George noted that after looking at the long-term average maxima for January, Bourke has the highest at 36.3 degree C.
 After checking the original temperature maxima Bourke had the highest for January 1939 at 40.4 degree C.
 After then checking the ACORN-SAT temperature for the same period, however, Bourke dropped to fourth place. Why?

3. Truncating the data by discarding the full 39 years of data from 1871 to 1910.

The postmaster at Bourke started recording temperatures on 25th April 1871, but the first 39 years of data is discarded on the basis the thermometers were not housed in a standard Stevenson screen. The early thermometers may have been housed in a non-standard Stevenson screen or at worst at Glaisher stand that can record temperatures up to 1 degree Celsius warmer in summer and 0.2 degree Celsius warmer in winter.

There are many peer-reviewed publications that show how to adjust temperature data based on the shelter used to house the thermometers.

A standard Stevenson screen was installed at Bourke in August 1908. Rather than adjusting the data before this month in the development of the ACORN-SAT official data series the Bureau has chosen to discard the earlier full 39 years of data. And then proceeds to adjust the data after the installation of the Stevenson screen.

To read more on this topic…
Part 1, Hot days
Part 3, Shortening an already shortened record
******

This blog post draws on comments in earlier threads from Ian George and Bob Fernley-Jones and email correspondence with Lance Pidgeon and Ken Stewart.

In future posts in this series I intend to show how adjustments have been made to the minima and how the official adjusted data is incorporated into global temperature databases.

Filed Under: Information Tagged With: Temperatures

Tolerate Assaults on the Truths You Hold Dear

April 3, 2014 By jennifer

Today, the online magazine spiked launched Free Speech Now!, a brand new campaign for ‘unfettered’ freedom of speech, with no ifs and no buts.

The editor of spiked, Brendan O’Neill, says:

‘”Every man should think what he likes and say what he thinks.” It is 350 years since Spinoza wrote those profound words. And yet every man (and woman) is still not at liberty to think what he or she likes, far less say it. It is for this reason that, today, spiked is kicking off a transatlantic online magazine and real-world campaign called Free Speech Now! – to put the case for unfettered freedom of thought and speech.’

‘Freedom of speech is in a bad way’, says O’Neill. ‘Ours is an age in which a pastor, in Sweden, can be sent to jail for preaching to his own flock in his own church that homosexuality is a sin. In which British football fans can be arrested for referring to themselves as Yids. In which those who too stingingly criticise the Islamic ritual slaughter of animals can be convicted of committing a hate crime.’

‘This new illiberalism commits the double offence of shutting up those who have something to say and shutting down the critical faculties of everyone else, discouraging debate in favour of promoting only those ideas that small groups of people have predetermined to be good, right, scientifically or politically correct, and safe for the little people to consume.’

The Free Speech Now! campaign is necessary challenge to this new illiberalism. Combining an online hub, providing free-speech lovers with the sharpest, most insightful articles, interviews and podcasts around, with plans for a series of live events in the US and Europe, Free Speech Now! will mount a vital defence of this most important of liberties.

O’Neill says:

‘We need a renewed commitment to the freedoms of thought and speech, and one which is consistent – which defends these freedoms not only for writers and the right-on, but also for so-called deniers, for the politically weird, for those who are offensive or outrageous. For it is only by having unfettered freedom of speech that we can guarantee an open and lively public sphere in which bad claims or ideas might be intellectually beaten, and the truth, arrived at.’

View Free Speech Now! here: http://www.spiked-online.com/

****
Media Release

Filed Under: Information Tagged With: Philosophy

Stop the Whaling

April 1, 2014 By jennifer

THE United Nations’ Hague-based International Court of Justice yesterday ruled that Japan’s annual Antarctic whale hunt must stop because it is not scientific.

I wonder how much trouble the Japanese did have getting their research on skinny whales published… remember the blog post back in 2008.

Japan has said it will honour the ruling.

It is my understanding that Japan labelled its current harvest in the Antarctic scientific exercise after it became illegal to hunt whales commercially. That ruling was made by the United Nation’s International Whaling Commission that was originally established to oversee a more sustainable whaling industry.

If the Japanese want to continue whaling, they will perhaps have to label it ‘Aboriginal subsistence whaling’, because only this form of killing is currently permitted under international law. It may result in the application of less humane methods, and certainly will exclude the application of any scientific principles.

Bowhead Whale Harvest

For more information on ‘aboriginal subsistence whaling’ there is a somewhat dated article written by me for Cosmos magazine in 2006, and of course information at the whaling thread at this blog.

****
The photograph is of a Bowhead whale being harvested in northern Quebec in August 2008, via Iceclass. Unlike the Japanese who use grenade tipped harpoons in the Southern Ocean, indigenous hunters use more basic methods.

Filed Under: Information Tagged With: Whales

Finding Figures Quoted in Media in IPCC Report Released Today

March 31, 2014 By jennifer

WORKING Group II, of the Intergovernmental Panel on Climate Change (IPCC), published their contribution to the Fifth Assessment Report earlier today. The summary document begins by explaining that human interference with the climate system is occurring and climate change poses risks for humans and natural systems. The report goes on to assess the impacts, how we can adapt and why we are vulnerable.

Within an hour of the reports release the Australian Broadcasting Corporation had an article quoting CSIRO’s Dr Mark Howden…

“The world’s leading climate science organisation – the Intergovernmental Panel on Climate Change (IPCC) – has released its fifth report and warns the world is ill-prepared for risks from a changing climate.

The CSIRO’s Dr Mark Howden, who was lead author on the chapter addressing food production and food security, says the report predicts a rainfall reduction of 20 to 40 per cent in parts of southern Australia in coming decades, while rainfall will be more variable in the north.”

I need to file my The Land column this evening and I would like to put the 20 to 40 percent reduction in some context relative to the rest of the report. But I can’t find these figures in the report.

It’s a long report with many components. Can someone help me…

http://ipcc-wg2.gov/AR5/report/final-drafts/

In particular where does it say rainfall will reduce by 20 to 40 percent in southern Australia?

Filed Under: Information, Uncategorized Tagged With: Rainfall forecasting

  • « Go to Previous Page
  • Go to page 1
  • Interim pages omitted …
  • Go to page 40
  • Go to page 41
  • Go to page 42
  • Go to page 43
  • Go to page 44
  • Interim pages omitted …
  • Go to page 607
  • Go to Next Page »

Primary Sidebar

Recent Comments

  • Ian Thomson on Vax-ed as Sick as Unvax-ed, Amongst My Friends
  • Dave Ross on Vax-ed as Sick as Unvax-ed, Amongst My Friends
  • Dave Ross on Vax-ed as Sick as Unvax-ed, Amongst My Friends
  • Alex on Incarceration Nation: Frightened of Ivermectin, and Dihydrogen monoxide
  • Wilhelm Grimm III on Incarceration Nation: Frightened of Ivermectin, and Dihydrogen monoxide

Subscribe For News Updates

  • This field is for validation purposes and should be left unchanged.

December 2025
M T W T F S S
1234567
891011121314
15161718192021
22232425262728
293031  
« Jan    

Archives

Footer

About Me

Jennifer Marohasy Jennifer Marohasy BSc PhD has worked in industry and government. She is currently researching a novel technique for long-range weather forecasting funded by the B. Macfie Family Foundation. Read more

Subscribe For News Updates

Subscribe Me

Contact Me

To get in touch with Jennifer call 0418873222 or international call +61418873222.

Email: jennifermarohasy at gmail.com

Connect With Me

  • Facebook
  • LinkedIn
  • RSS
  • Twitter
  • YouTube

Copyright © 2014 - 2018 Jennifer Marohasy. All rights reserved. | Legal

Website by 46digital