• Skip to primary navigation
  • Skip to main content
  • Skip to primary sidebar
  • Skip to footer
Jennifer Marohasy

Jennifer Marohasy

a forum for the discussion of issues concerning the natural environment

  • Home
  • About
  • Publications
  • Speaker
  • Blog
  • Temperatures
  • Coral Reefs
  • Contact
  • Subscribe

Blog

Snowy Hydro responsible for cooling at Rutherglen?

September 14, 2015 By jennifer

I’VE just had a paper published in the international climate science journal Atmospheric Research (volume 166, pages 141-149), in which I show there was significant cooling in the maximum temperatures at the Cape Otway and Wilsons Promontory lighthouses, south eastern Australia, from 1921 to 1950.  This cooling is even more pronounced in temperature records from the Riverina, including at Rutherglen and Deniliquin.  Indeed, while temperatures at the lighthouses (and most Australian east coast locations) show cooling from about 1880 to about 1950, they then show quite dramatic warming from at least 1960 until about 2002.  In the Riverina, however, minimum temperatures continued to fall through the 1970s and 1980s.  Pondering this issue, it occurred to me that Snowy Hydro may be responsible.

This hydroelectricity and irrigation scheme was a major feat of engineering facilitating the ongoing diversion of about 1,000 gigalitres of water per year, which once flowed east to the Pacific, west to the Riverina.  Much of the land brought under irrigation is used to grow rice, with water pooled.  The cooling could thus be the direct result of evaporation which removes latent heat from the surface from which evaporation occurs.  This is the physical basis of industrial and domestic cooling systems, and also of sweating.

The main distribution channels are just to the west of Rutherglen, and resulted in 800,000 hectares of new land under irrigation, not just for rice but also pastures for dairy, and more.

The largest dip in the minimum temperature record for Deniliquin occurs just after the Snowy Hydro scheme came online.   Of course the Australian Bureau of Meteorology denies this cooling: everywhere must show global warming!  So their ACORN-SAT team jump down the minimum temperature record at Deniliquin by a massive 1.5 degree Celsius before 1971 in an attempt to mask the cooling.

If you want to better understand the level of incompetence at work in remodelling the Deniliquin temperature series, and also understand more about this temperature record, and the proximity of Rutherglen to the major water infrastructure developments, read my latest correspondence with the Bureau of Meteorology, which follows.


*******   14th September 2015

Dr Louise Minty
Acting Deputy Director, Environment and Research Division
Head Office Melbourne, Bureau of Meteorology
GPO Box 1289, Melbourne VIC 3001

Dear Dr Minty

Re:  The temperature time series for Deniliquin, and your letter contains basic errors of fact

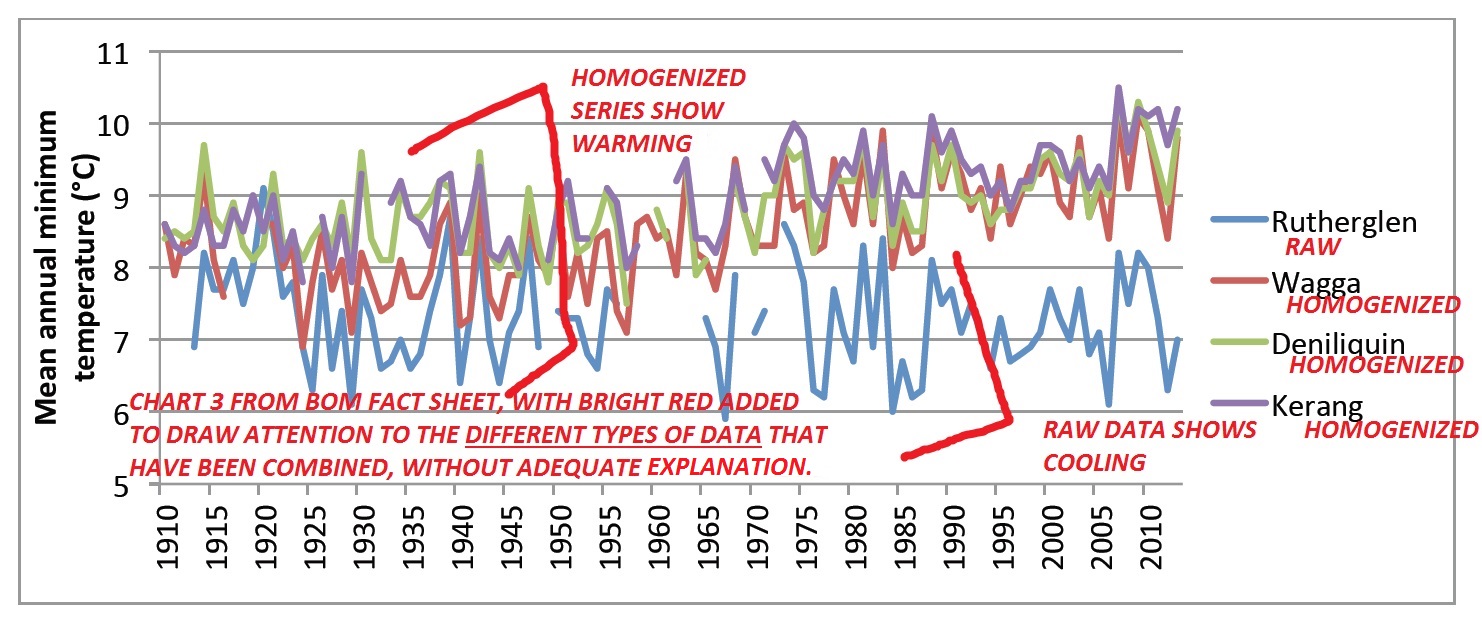
Thank you for your letter of 3rd September, 2015, in response to my letter to Ms Middleton in which I  explained that the temperature record for Deniliquin shows statistically significant cooling, and drew attention to the chart in your key ‘fact sheet’ which confounds homogenized and raw temperature data.   While I appreciate you taking the time to write to me, there are basic factual errors in your letter

I note that you advise that that if I have ongoing concerns I should submit these to a reputable journal.  The detail of my analysis of both the maximum and minimum temperature time series for Deniliquin and Rutherglen will soon be publically available in the peer-reviewed scientific literature.  This contrasts with the publication history of the ‘adjustments’ for Deniliquin and Rutherglen by the Bureau which have not been published in any peer-review literature, and which do not accord with actual discontinuities in the individual raw temperature series.

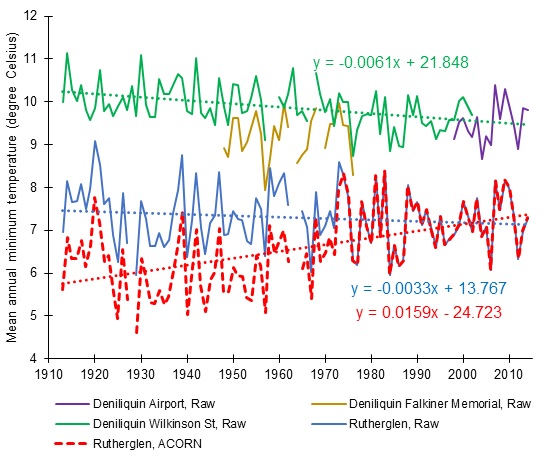
You state in your letter that there is no continuous temperature record for Wilkinson Street Deniliquin which shows a cooling trend since 1910.  You suggest that I have confounded the Wilkinson Street record for Deniliquin with the record from the airport and Falkiner Memorial (the CSIRO facility).  If you read my letter you would see it clearly showed the three series, in green, mustard, and purple.  I will reproduce them again for you here as Figure 1:

Figure 1.

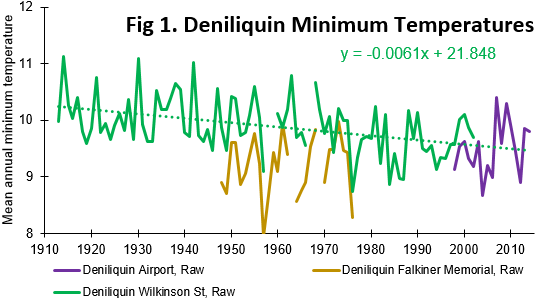
You suggest I made a concatenation of these records into a single temperature series. You are in error. I did not.

Clearly there is a long continuous record for Wilkinson Street and it shows cooling.

In your letter you state that adjustments had to be made to the Deniliquin record in order to combine the series from Wilkinson Street and the airport.  I did not combine these series in my correspondence to you, but the Bureau has combined them as part of the development of the Australian Climate Observation Network – Surface Temperatures (ACORN-SAT) dataset.

You suggest that adjustments were made for September 1984 to ‘merge’ the airport and Wilkinson Street series. You are incorrect. Your ACORN-SAT team made adjustments in July 1997 to account for the move to the airport, and also assigned the record a new site number.

Your adjustments involve dropping down all temperatures between January 1910 and June 1997 by -0.51 degree Celsius.   But this huge manipulation is not even the largest correction your team makes.  The largest ‘correction’ is made in 1971 dropping temperatures by 0.99 degrees. The cumulative effect is a cooling of all temperatures as recorded at Deniliquin before August 1971 by 1.5 degrees.  As I am sure you are aware, dropping all previous historical temperatures makes the present appear relatively hotter.  These changes alone manage to almost double the amount of global warming over the 20th Century, typically reported as 0.9 degree Celsius!

The only justification presented for the correction in your online note is: ‘site move’. The Bureau’s policy for dealing with significant site moves when they actually occur is to award a new site number. The Bureau did not do this.

You claim in your letter the site move caused a discontinuity in the data. But a check of the site code used when this same temperature series was homogenized by Simon Torok and Neville Nicolls* indicates that there was no discontinuity detected in 1971.

Furthermore, if the site move caused a discontinuity in the data then this would be evident in the numbers, specifically in the monthly values. But when the Wilkinson Street monthly minimum temperature series (1910 to 2002) is run through a simple control chart there is no exceedance of upper and lower control limits set at three standard deviations from the overall mean as shown in Figure 2.

Figure 2.  I-MR-R/S control chart showing minimum temperatures as recorded at Wilkinson Street, Deniliquin, between January 1910 and December 2002.  The subgroup mean (top chart) represents the mean for each year eliminating the within subgroup component of variation (i.e. the seasons), thus tracking process location (i.e. annual temperature change).  The moving range (MR) of the subgroup mean (middle chart) tracks between year variation.  The standard deviation (bottom chart) plots process variation within subgroups (i.e. within each year).
Figure 2


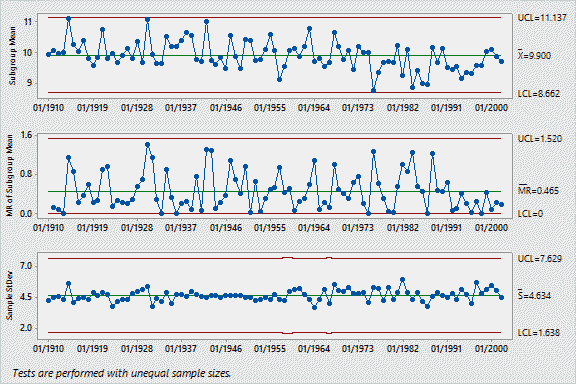
You claim homogenization is required to correct for discontinuities created by equipment and site changes. Control charts are a measure of the within-and-between year variation, and as such they clearly show when a discontinuity has occurred. A major discontinuity appears as a step-change resulting in exceedance of upper and/or lower control limits, while a minor discontinuity appears as a step-change in the position of the subgroup mean above or below the center line.

You suggest discontinuation in the minimum temperature record at 1971. There is none. There is consistent cooling over the period of the record, and particularly after 1975, which corresponds with the Snowy Mountains hydroelectricity and irrigation scheme coming online.

You attribute cooling in the data to a non-existent discontinuity. As I establish above this discontinuity is fictional. Cooling in the data is likely associated with local land use change in particular over 800,000 hectares (nearly 2 million acres) of land newly under irrigation in the immediate vicinity of Deniliquin as shown schematically in Figure 3.

Figure 3
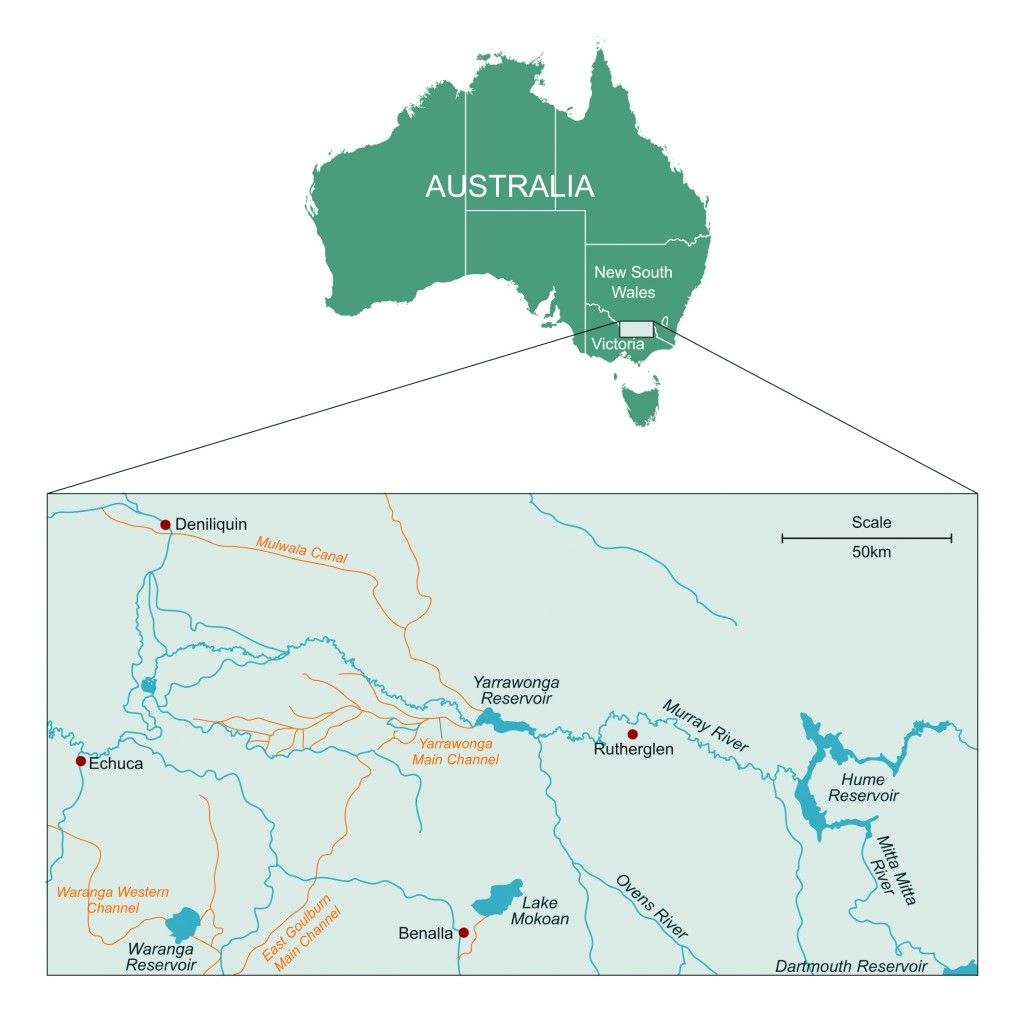
Figure 3.  Locations of Deniliquin and Rutherglen relative to main irrigation channels associated with development of irrigated agriculture in the Riverina, Australia

The Deniliquin temperature series is not an isolated instance of the Bureau making unsubstantiated claims regarding temperature series. The entire historical temperature record for Australia is being re-written by your ACORN-SAT team with fictitious justifications.

I am happy to provide further examples. You have indicated that you would prefer this information as a reprint, which I will forward as soon as it is available.  If you are interested in discussing anything aforementioned, I would be happy to arrange a time.

Yours sincerely

Dr Jennifer Marohasy
Independent Scientist

*Torok, SJ and Nicholls, N 1996. A historical annual temperature dataset for Australia. Aust. Met. Mag., 45, 251-260.

___________________

This blog posts continues the Rutherglen saga.  You can read some background information here… https://jennifermarohasy.com.dev.internet-thinking.com.au/temperatures/rutherglen/ . The next most recent Rutherglen blog post is here… https://jennifermarohasy.com.dev.internet-thinking.com.au/2015/08/bureau-just-makes-stuff-up-deniliquin-remodelled-then-rutherglen-homogenized/ .   I still believe that someone should be sacked for making up global warming at Rutherglen…  https://jennifermarohasy.com.dev.internet-thinking.com.au/2014/08/whos-going-to-be-sacked-for-making-up-global-warming-at-rutherglen/ .   But alas the progressives who set the national agenda want to believe in global warming, even if it requires rewriting the climate history of Rutherglen.  So much for evidence based public policy. What did George Orwell write… he who controls the present, controls the past.

Filed Under: Information

Bureau Just Makes Stuff Up: Deniliquin Remodelled so Rutherglen can be Homogenized

August 11, 2015 By jennifer

The Australian Bureau of Meteorology just makes stuff up.    You may remember Rutherglen, that town in north eastern Victoria, Australia, where the Bureau changed a slight cooling trend in the minimum temperatures to catastrophic global warming?  After they were caught-out, they claimed the “adjustments” were necessary because there had been a site move.  That’s right, moving a weather station between paddocks changed a cooling trend of 0.35 degree Celsius per century into a warming trend of 1.7 degree Celsius!

That didn’t seem so convincing on reflection.  And there has always been the issue of evidence.  That’s right.  Where is it documented that the weather station was ever moved?

More recently, the Bureau has been claiming that it had to change the temperatures at Rutherglen because they were different from temperatures at near-by locations.  Of course, a real scientist wouldn’t tamper with data because it showed an unusual trend.   Rather the unusual result might be investigated.

But not the Bureau.  It changes the trend at Rutherglen so it matches neighboring stations, but only after first changing the trend at neighboring stations so it matches the global warming trend.

In protest I’ve sent an email to the CEO, Vicki Middleton.

Dear Ms Middleton,

Re: Deniliquin shows statistically significant cooling, Rutherglen just shows cooling

I am writing to request that you correct a Bureau of Meteorology fact sheet*, which shows remodelled (homogenized) data for Wagga, Deniliquin and Kerang with actual physical temperature measurements (raw data) for Rutherglen.

Several members of the public, seeking clarification regarding adjustments to the temperature record for Rutherglen, have been advised by you in recent correspondence that the adjustments at Rutherglen are necessary to make temperature trends at Rutherglen more consistent with neighboring sites.   In particular, you have directed them to this fact sheet* that shows minimum temperatures at Rutherglen cooling, while temperatures at Wagga, Deniliquin and Kerang are warming.  What you have failed to point out, however, is that the Wagga, Deniliquin and Kerang series represent homogenized time series.   That is, the data have been substantially remodelled.

CHART3-WITH EXPLAINATION-Ver2

There is no single, long, continuous, raw minimum temperature record from the same site for either Kerang or Wagga.   Recordings were made at Wilkinson Street, Deniliquin, from February 1867 to June 2003, providing a record comparable in length to the raw series from Rutherglen.

I have plotted the raw temperature series for three Deniliquin locations below, including the data from Wilkinson Street from 1913, which is when the Rutherglen series begins.

Chart3-Revised-Deni-Rutherglen

The top green squiggly line represents data from Wilkinson Street, Deniliquin, the short purple squiggle is data from the airport at Deniliquin, and the mustard-colored squiggle is from a site referred to as Falkiner Memorial, Deniliquin.

Also shown in this chart are both homogenized and raw data for Rutherglen, as the red and blue squiggly lines, respectively.

The three dotted-lines represent the linear trends from Wilkinson Street (green), the raw (blue) series for Rutherglen, and the homogenized (red) series for Rutherglen.

The cooling trend in the Wilkinson Street, Deniliquin series of 0.6 degree Celsius per century is statistically significant (p<0.05).

I appreciate that you may have been misled by your employees into believing that the cooling trend at Rutherglen (represented by the blue line in the above chart) is erroneous.   This is not the case.

I recognize that this cooling trend evident in the minimum temperature record for much of the twentieth century at many rural locations in south eastern Australia is inconsistent with official Australian and also global trends.   Nevertheless, it does appear to be real, and is statistically significant for some locations.   Of course, real scientists are concerned with the interpretation of real data, rather than remodeling to generate constructs that fit popular political agendas.

Yours sincerely,
Jennifer Marohasy BSc PhD
Independent Scientist

9th August, 2015

Copy Maurice Newman, chairman of the Prime Minister’s Business Advisory Council.

*The following document is cited in Bureau correspondence as a Fact Sheet:

Bureau of Meteorology, 2014. ACORN-SAT station adjustment summary – Rutherglen (as at 24 September 2014), Accessed 8 August 2015.  http://www.bom.gov.au/climate/change/acorn-sat/documents/station-adjustment-summary-Rutherglen.pdf

Filed Under: News Tagged With: homogenization, Temperatures

Remembering, the Day After Tomorrow

July 13, 2015 By jennifer

So, it may be difficult to remember a time in the future!  But do you remember the movie ‘The Day after Tomorrow’ when New York froze over?  That ice age was caused by changes in the circulation of warm water in the Atlantic Ocean, in particular the Gulf Stream closed down because of melting in the Arctic because of carbon dioxide.  Well, that was Hollywood!  Now, a mathematician, Professor Valentina Zharkova, is claiming an imminent big freeze, not because of carbon dioxide, but because of out of synch solar cycles.  DayAfterTomorrow

“In cycle 26, the two waves exactly mirror each other – peaking at the same time but in opposite hemispheres of the sun,” Zharkova told the Daily Mail.

So, I understand that when the number of sunspots is at a minimum, the sun’s general magnetic field is nearly dipolar.  What causes this?

I keep on intending to read-up more on the influence of the gravitational pull of the larger planets on the sun’s magnetism.  I would be interested in best references…

Meanwhile, here’s something from YouTube to amuse those who enjoy virtual horror with a real historical dimension.

Filed Under: Information, News Tagged With: ice age

The Minority is Always Right

June 28, 2015 By jennifer

THANK YOU to everyone who heard Maria Pita and sent a letter off to their favorite politician or editor, or made comment in the long thread online at The Australian, highlighting the many inadequacies in the recent report by the Technical Advisory Forum into the homogenization of historical temperature data by the Australian Bureau of Meteorology.

I've been travelling, and reading my Kindle, including a great book by Christopher Booker.
I’ve been travelling, and reading my Kindle, including a great book by Christopher Booker.

I haven’t seen any of the many letters copied to me over the last week published anywhere, but sometimes it takes time for the majority to see that The Emperor really has no clothes. This realization can sometimes be hastened when we point out the missing detail, for example, I like the following letter sent to Bob Baldwin by Peter Rees of Geelong.

Sir,

While there are some encouraging recommendations from the Bureau of Meteorology (BOM)’s Technical Advisory Forum, it is extremely frustrating that they haven’t mentioned anything about the BOM providing FULL details of why they altered stations like Rutherglen so dramatically.

The 1973 minimum temperature was reduced by 0.5 Degrees C and working backwards increased this until there was a massive 1.8 Degrees C reduction between the recorded and homogenized temperatures in 1913.

This changed a slightly cooling trend to a warming trend and the BOM refuse to provide detailed information on why it was done.

I quote from Dr J. Marohasy:
“The Bureau has provided information at its website suggesting that there was a need to make adjustments to Rutherglen for the period prior to 1966 and that this “was determined from an objective statistical test that showed an artificial jump in the data during this period.” But what was the statistical test actually performed on the data? Why is this not documented? The raw temperature record for Rutherglen has a virtually identical trend to its six neighbouring comparison sites, while the homogenized ACORN-SAT temperature series for Rutherglen is strongly biased towards warming”

If the BOM are not compelled to provide this information then the question has to be asked, why not? If they have valid reasons for the “objective statistical test”, then surely it would be in everyone’s interest if it were made known.

It is surely within your authority that you instruct the advisory committee do this or else add it to the terms of reference.

I would appreciate a reply to this email and please specifically address the Rutherglen issue with your comments on why or why not it should be addressed.

Regards, Peter Rees, Geelong

HAVING been traveling for the last month or so, I’ve had an opportunity to spend more time than usual reading my Kindle. I have particularly enjoyed reading ‘The Seven Basic Plots: Why We Tell Stories’ by Christopher Booker.

Christopher Booker is perhaps better known to us as the columnist for The Sunday Telegraph who writes about how future generations will look back on the global-warming scare with shock at both how gullible the general public were, and how the official temperature records were systematically “adjusted” to show the Earth having warmed much more than actually justified by the data. He’s also written about story telling more generally, and from a Jungian perspective. Let me reproduce some pages from this book, so relevant to the problem of getting the alternative perspective heard:

THE RULING CONSCIOUSNESS

The real problem with the ego, as the only part of our psyche through which we can be conscious of the world, is that it is so structured that its awareness must always be limited. However much we may try to eliminate its distortions and to dissolve its conflict with the objective unconscious, some element of subjective distortion and blindness must inevitably remain. And just as this applies to the consciousness of the individual ego, so it equally applies to that collective consciousness which tends to develop in any human group or society. Of course no group of human beings can establish a single, undifferentiated consciousness, through which each member of the group views the world in exactly the same way. But in any group or society it is possible to discern certain prevailing tendencies of view, even if the views of a minority of members of the group may conflict with them. Groups of human beings develop a sense of common identity, shared values, shared assumptions of what they believe to be true or important. And in this respect they develop a collective ego-consciousness.

We see this most obviously when they are swept up in some great shared emotion, as in the collective state of hysteria which grips a crowd at a football match or the sense of collective unity associated with times of war. But in any group it is possible to discern what may be called its ruling state of consciousness: that which determines what views, values and behaviour are at any time generally considered acceptable, and those which are regarded as beyond the pale, condemned as disruptive, eccentric, alien or mad. And one has only to consider what extraordinary changes come over the state of consciousness prevailing in any society through different times in history (the dramatic variations in what is considered acceptable that we see in everything from patterns of moral behaviour to fashions in clothes) to see that there cannot be any time when the ruling consciousness is objectively right, by some absolute standard, in everything it holds to be important or true.

It is naturally easiest to appreciate this in societies where the prevaling consciousness is furthest removed from our own. Until the fifteenth and sixteenth centuries, for instance, the ruling consciousness decreed that the earth was flat and that the sun went round xanax it. To challenge that consciousness, even though it had no basis in fact, was virtually unthinkable. As the old song had it, `They all laughed at Christopher Columbus, when he said the world was round’.

For challenging the received wisdom that it was the sun which moved while the earth stood still, Galileo faced such duress from the Papal inquisition that publicly he conceded the point (even though, as he did so, he was said to have muttered under his breath `but it still moves’).
We may today laugh knowledgeably at the blindness and arrogance of those inquisitors, because we have inherited the new prevailing wisdom which Galileo helped to shape; just as we may express moral outrage at all those who became rich from the eighteenth-century slave trade in the days before moral perceptions changed and the inhuman cruelty of the slave-system became obvious for all to see. But what we may not recognise is just how many firmly-held convictions making up the prevailing consciousness of our own time are just as ill-founded as the belief in a flat earth or the social acceptability of slavery: because the point about any state of ruling consciousness is that it is based on unconscious assumptions so deep and all-pervading that they are taken for granted. In any society, organisation or group, the unconscious psychological pressure to accept those assumptions is so great that only a few outsiders have the clarity of vision to perceive from `below the line’ how baseless and unjustified they are.

In fact the ruling consciousness of any group with a sense of common identity provides an exact parallel to the state of consciousness in individual human beings. Because it is centred on a collective ego, it can exhibit precisely the same tendency to distortion and subjectivity that we see in human individuals. As we see in, say, a political party, there will thus be a significant element of unconsciousness in the way that group behaves, whereby it remains collectively unaware of its own deficiencies. Just as we see in an individual, the more one-sided the ruling consciousness becomes, the greater the area of shadow its one-sidedness creates. And the denser those shadows, the more we are likely to find within them people who represent those values and that wider awareness which, `above the line, in the ruling consciousness, have gone missing.

It was his perception of this psychological characteristic of human groups which Ibsen summarised in those words from An Enemy of the People quoted at the head of this chapter: `the majority is always wrong’ and `the minority is always right’. This is an observation which on the face of it might seem perverse, contrary to common sense, inviting the ridicule of all received opinion. But it is precisely `received opinion, the ruling consciousness, which by definition can never grasp the subtle truth of the point Ibsen was trying to make. He is not of course saying that whenever the majority of the human race agree on something they must in all cases be wrong. Most people accept, for instance, that it is undesirable for human beings to go around killing each other. They are not misguided in this belief just because they are a majority. There are many issues on which the majority of people hold similar beliefs and are right to do so. But at any given time, in any human group, large or small, there will be a generally prevailing state of consciousness which in very significant respects will be blind; which will be unable to see the world objectively. It is in this sense that, as Ibsen put it, the `majority, the ruling consciousness, is always wrong. And there should be nothing particularly surprising about this, since it is self-evident that in any collection of human beings there will be only a minority who have achieved that degree of self-understanding which can allow them to see the world without their perception being in some way fogged or skewed by unconscious subjectivity.

********************

Filed Under: Good Causes, Philosophy Tagged With: Climate & Climate Change, Temperatures

Remember Rutherglen, & “Whoever has Honor Follow Me!”

June 20, 2015 By jennifer

Maria Pita was a Galician heroine who rallied the ordinary citizens of Corunna in 1589.
Maria Pita is a Galician heroine who rallied the ordinary citizens of Corunna in 1589 with the battle cry ‘Whoever has honor, follow me!”.

The results of an independent ­review of the Bureau of Mete­or­ology’s national temperature records should “ring alarm bells” for those who had believed the bureau’s methods were transparent, says a key critic, Jennifer ­Marohasy.  So, begins an article by Graham Lloyd in The Weekend Australian.

Lloyd goes on to write:

Dr Marohasy said the review panel, which recommended that better statistical methods and data handling be adopted, justified many of the concerns raised.

However, the failure to ­address specific issues, such as the exaggerated warming trend at Rutherglen in ­northeast Victoria after homogeni­sation, had left ­important questions ­unresolved, she said.

The review panel report said it had stayed strictly within its terms of reference.

Given the limited time available, the panel had focused on big-picture issues, chairman Ron Sandland said.

The panel was confident that “by addressing our recommend­ations, most of the issues raised on the submissions would be ­addressed”, Dr Sandland said.

The panel is scheduled to meet again early in the next year.

Dr Sandland said that, overall, the panel had found the Australian Climate Observations Reference Network — Surface Air Temperature was a “complex and well-maintained data set that has some scope for further improvements”.

It had made five recommend­ations that would boost transparency of the data set.

Although the panel reviewed 20 public submissions, Dr Marohasy said it had failed to address specific concerns.

“While the general tone of the report suggests everything is fine, many of the recommen­dations (are) repeat requests made by myself and others over the last few years,” Dr ­Marohasy said.

“Indeed, while on the one hand the (bureau’s technical ­advisory) forum reports claims that the bureau is using world’s best practice, on the other hand its many and specific recommend­ations evidence the absence of most basic quality controls in the many adjustments made to the raw data in the development of the homogenised temperature series.”

BoM said it welcomed the conclusion that homogenisation played an essential role in eliminating artificial non-clim­ate ­systematic errors in temperature observations, so that a meaningful and consistent set of records could be maintained over time.

In suggesting that the review was about the legitimacy of homogenization as a technique, the BoM is continuing to play politics.  As I explained in my initial comments in response to the release of the report, we acknowledge that there are times when it is necessary to make adjustments to raw temperature data in the creation of long, continuous, high quality records.  But, we object to the way in which the Bureau makes changes to every temperature series incorporated into ACORN-SAT, and from which the official Australian historical temperature record is constructed.

Indeed, it is curious that while on the one-hand the Forum reports claims that the Bureau is using world’s best practice, on the other-hand its many and specific recommendations evidence the absence of most basic quality controls in the many adjustments made to the raw data in the development of the homogenized temperature series.   For example, the Forum report acknowledges that there is a need to publish, “a brief, plain-language (as far as possible) description of the criteria for adjustment and the basis for adjustment itself.”

This must be a priority, especially for many of the more contentious locations, including Rutherglen in north eastern Victoria.   Indeed, the Forum has obfuscated by not addressing the key issue of why the Bureau has made such dramatic changes to the temperature record for Rutherglen.  If there is nothing wrong with current methodologies, beyond the need for better documentation, then why didn’t the Forum provide its own plain English description of the criteria used to make the adjustments for Rutherglen, which turn a slight overall cooling trend into dramatic warming.

So far, the Bureau has provided lots of documentation, but no actual evidence to support the many adjustments made in the homogenization of the temperature record for Rutherglen.

The warming trend at Rutherglen is essentially achieved by progressively dropping down the minimum temperatures starting in 1973 by 0.5 degree C.  The amount by which the temperatures is ‘adjusted’ down increases back through time to 1913 when there is a massive 1.8 degree Celsius difference between the recorded temperature and the homogenised value.

The homogenised values are then incorporated into the official record that is used to calculate temperature trends for the state of Victoria, and also Australia.  The Bureau has provided information at its website suggesting that there was a need to make adjustments to Rutherglen for the period prior to 1966 and that this “was determined from an objective statistical test that showed an artificial jump in the data during this period.”  But what was the statistical test actually performed on the data?  Why is this not documented?  The raw temperature record for Rutherglen has a virtually identical trend to its six neighbouring comparison sites, while the homogenized ACORN-SAT temperature series for Rutherglen is strongly biased towards warming.

As I explained to Graham Lloyd yesterday, in not answering any of our specific questions, including those concerning the homogenization of the temperature record for Rutherglen, the Forum’s report in many ways should ring alarm bells for those who have previously believed that the Bureau’s methods were transparent.

I’m currently overseas, in north western Spain,  in the town of Corunna, and  I’m inspired by the local heroine Maria Pita, to ask you to join with me in campaigning for change.  Maria Pita is a Galician heroine who rallied the ordinary citizens of Corunna in 1589 with the battle cry ‘Whoever has honor, follow me!”

Leave a comment of support in the thread following the  article by Graham Lloyd in The Weekend Australian.

It is totally unacceptable that the Bureau can essentially rework temperature data until it accords with the theory of anthropogenic global warming.

Also consider writing a letter to The Australian newspaper, and perhaps also other news outlets.  Explain the issue.  I’ve draft something below to get your started.   Next you could write to your local politician, again explaining the issue, and also asking that they read the actual report from the forum, and also the many submissions made by myself and colleagues.   It is extraordinary with all the evidence so far provided, that absolutely nothing is being done right now to get some integrity back into the official historical temperature record for Australia.

*******

Ideas for your own letter:

Dear Editor/Politician/Tony Jones

Following the release of the review of the Bureau of Meteorology’s national temperature records, I agree with Jennifer Marohasy that “alarm bells” should be ringing for those who had previously believed the bureau’s methods were transparent.

It is concerning that the expert panel still cannot explain the exaggerated warming in the official record for Rutherglen.   It seems the only thing wrong with the original observed values is that they did not accord with global warming theory, and so they were homogenized.

 I concur with Dr Marohasy, that to the extent possible, the Bureau should retain the actual recorded temperature values.  If it has to manipulate the data, then strict rules should be adhered to. In particular, the Bureau must not homogenize temperature series, changing actual recorded values, unless there is a documented equipment change or site move creating a statistically significant discontinuity in the data.

The Bureau should start the official temperature record in 1880, not 1910, and not add hotter stations into later years.

Yours sincerely

Maria Pita/Your name

Filed Under: Good Causes, Information Tagged With: Temperatures

Response to ‘Yes Minister’ report by Ron Sandland

June 18, 2015 By jennifer

FOLLOWING  are my initial comments in response to the release of the report by the Technical Advisory Forum on the Australian Climate Observations Reference Network (ACORN-SAT):

Dr Sandland chairs 'The Forum' that has so far refused to hold an open forum.
Dr Sandland chairs ‘The Forum’ that has so far refused to hold an open forum.

I NOTE that The Forum, chaired by Dr Ron Sandland formerly of the CSIRO, concurs with the Bureau that:

“There is a need to adjust the historical temperature record to account for site changes, changes in measurement practices and identifiable errors in measurement…  To this end, the Forum supports the need for the Bureau’s homogenisation process to incorporate both metadata-based adjustments and adjustments based on the statistical detection of atypical observations. In the opinion of the Forum members, unsolicited submissions received from the public did not offer a justification for contesting the overall need for homogenisation or the scientific integrity of the Bureau’s climate records.”

As a member of the public who made an unsolicited submission, I would like to clarify that at no time did I suggest there was no need for adjustments, rather I have queried why there are adjustments made when, in fact, there are no documented site changes, no changes in measurement practices, and no identifiable errors.  Yet adjustments are still made.

The Forum appears to have overlooked many examples of this provided in the public submissions, and published by The Australian newspaper late in 2014.  For example, the Forum has completely ignored the notorious example of Rutherglen, where a slight cooling trend was converted into a warming trend, despite an absence of any metadata providing justification.

The Forum has also made no comment on the actual choice of stations for inclusion in ACORN-SAT, nor how the selection of stations has changed in recent years.  For example, in his submission to the panel, retired chartered accountant Merrick Thomson showed how the choice of ACORN-SAT stations changed from 2012 to 2013 and, how this could generate a large increase in global warming.

The Forum has suggested that the Bureau consider pre-1910 data in its analysis of climatic trends.

“Recommendation 5: Further, the possible availability of pre-1910 data at south-eastern sites may allow for a comparative analysis to be performed for south-eastern Australia to assess whether the inclusion of pre-1910 data is worthwhile in attempting to understand current temperature patterns.”

This is currently listed as a low priority by The Forum, but its inclusion is nevertheless welcome, and was a key recommendation in my submission.  I also recommended that all temperature series start at the same date.  For example, I provided the example, in my submission, of the Bureau adding in the very hot town of Wilcannia only from 1957, when there is data available from the late 1800s.

I also welcome the recommendation that the Bureau:

“Address two key aspects of ACORN-SAT, namely: a) improving the clarity and accessibility of information provision—in particular, explaining the uncertainty that is inherent to both raw and homogenised datasets, and b) refining some of the Bureau’s data handling and statistical methods through appropriate statistical standardisation procedures, sensitivity analyses, and alternative data fitting approaches.”

I note that The Forum state in their report that:   “It is not currently possible to determine whether the improvements recommended by the Forum will result in an increased or decreased warming trend as reflected in the ACORN-SAT dataset.”

I would suggest that if the committee’s recommendations were properly implemented, and the Bureau abandoned some of its more creative accounting practices (e.g. adding in particularly hot locations for later years in the time series), then it would become apparent that there has been an overall trend of cooling over much of central and eastern Australia from 1880 to 1960, more dramatic warming than previously documented from 1960 through to about 2002, while more recently temperatures have plateaued, with some evidence of a cooling trend establishing in north eastern Australia since 2002.

I note The Forum intends to operate for another two years, and urge them to be honest to their title of “The Forum” and actually meet with some of those who have so far provided unsolicited public submissions.  Indeed, I urge Dr Sandland to immediately set up an open and transparent Forum process whereby these submissions can be presented allowing any accusations of scientific misconduct by the Bureau to be both defended and contested before the Australian public, and media.

The committee makes five recommendations, but puts emphasis on the importance of the first two components of the first recommendation.

I applaud the first component of the first recommendation of the committee that in full states:

“Expediting the Bureau’s current work on developing uncertainty measures in closer consultation with the statistical community. The Forum recommends the Bureau seek to better understand the sources of uncertainty and to include estimates of statistical variation such as standard errors in reporting estimated and predicted outcomes, including: quantifying the uncertainty for both raw and adjusted data; prioritising the provision of explicit standard errors or confidence intervals, which should further inform the Bureau’s understanding and reporting of trends in all temperature series maintained by the Bureau; examining the robustness of analyses to spatial variation; and articulating the effect of correcting for systematic errors on the standard error of resulting estimates.”

Of course, that such basic statistical information is not currently available is impossible to reconcile with the overall conclusion in the report that, “the analyses conducted by the Bureau reflect good practice in addressing the problem of how to adjust the raw temperature series for systematic errors.”   Then again, the executive summary of The Forum’s report appears to have been written by someone straight out of the BBC television series ‘Yes Minister’.

The second component of the first recommendation is also applauded, which reads in full:

“Developing a clearer articulation of the purpose for the ACORN-SAT exercise to enhance public understanding of the program, and communicating processes for developing and using ACORN-SAT in a way that is appropriately clear, broad and supported by graphics and data summaries. In particular, the central focus on the Australian annual mean temperature anomaly as the primary end point of the ACORN-SAT exercise should be reconsidered and a broader narrative around including regional effects should be developed.”

Indeed, it has become apparent over the years that the entire focus of the work of the small ACORN-SAT unit is not the provision of higher quality individual temperature series, but the remodeling of the raw data, and the compilation of a select few station, to suggest that it is getting hotter and hotter across the Australian landmass with such announcements made with great fanfare by the Bureau’s David Jones at the beginning of each year.

Recommendation No. 2, has several components including comment that:

“Releasing the Python computer code for ACORN-SAT as a downloadable link along with all supporting documentation and listing of the technical requirements for the software. The Bureau should also monitor and gather download statistics to gauge demand for this software.”

Of course, without access to this software it has been impossible to reproduce any of the adjustments made by the Bureau. Yet if the method is scientific, it should be reproducible.   For many years, the Bureau has erroneously claimed its methods are transparent.   It should be noted, however, that even with the provision of this software, it will be impossible to justify ACORN-SAT because it is unclear why the Bureau chooses some stations above others for its comparisons.  For example, despite endless requests for clarification, the Bureau has never explained why it uses the distant location of Hillston to make comparison, and then changes, to the raw temperature data for Rutherglen in north eastern Victoria.

Recommendation 2 also includes comment that:  “Publishing a brief, plain-language (as far as possible) description of the criteria for adjustment and the basis for adjustment itself.”    Of course this should have been available since the very first adjustment was made in the development of ACORN-SAT.  That such a document still does not exist is evidence that ACORN-SAT is poorly documented.  So, how could The Forum endorse the Bureau’s claims that it represents world’s best practice?

Dr Jennifer Marohasy
A Coruna, Spain
18th June, 2015

Filed Under: Uncategorized Tagged With: climate, Temperatures

  • « Go to Previous Page
  • Go to page 1
  • Interim pages omitted …
  • Go to page 27
  • Go to page 28
  • Go to page 29
  • Go to page 30
  • Go to page 31
  • Interim pages omitted …
  • Go to page 607
  • Go to Next Page »

Primary Sidebar

Recent Comments

  • Ian Thomson on Vax-ed as Sick as Unvax-ed, Amongst My Friends
  • Dave Ross on Vax-ed as Sick as Unvax-ed, Amongst My Friends
  • Dave Ross on Vax-ed as Sick as Unvax-ed, Amongst My Friends
  • Alex on Incarceration Nation: Frightened of Ivermectin, and Dihydrogen monoxide
  • Wilhelm Grimm III on Incarceration Nation: Frightened of Ivermectin, and Dihydrogen monoxide

Subscribe For News Updates

  • This field is for validation purposes and should be left unchanged.

December 2025
M T W T F S S
1234567
891011121314
15161718192021
22232425262728
293031  
« Jan    

Archives

Footer

About Me

Jennifer Marohasy Jennifer Marohasy BSc PhD has worked in industry and government. She is currently researching a novel technique for long-range weather forecasting funded by the B. Macfie Family Foundation. Read more

Subscribe For News Updates

Subscribe Me

Contact Me

To get in touch with Jennifer call 0418873222 or international call +61418873222.

Email: jennifermarohasy at gmail.com

Connect With Me

  • Facebook
  • LinkedIn
  • RSS
  • Twitter
  • YouTube

Copyright © 2014 - 2018 Jennifer Marohasy. All rights reserved. | Legal

Website by 46digital