• Skip to primary navigation
  • Skip to main content
  • Skip to primary sidebar
  • Skip to footer
Jennifer Marohasy

Jennifer Marohasy

a forum for the discussion of issues concerning the natural environment

  • Home
  • About
  • Publications
  • Speaker
  • Blog
  • Temperatures
  • Coral Reefs
  • Contact
  • Subscribe

Uncategorized

No QA of bureau temperature data by CSIRO bushfire modellers

October 27, 2016 By jennifer

Despite an exceptionally cool end to this October, the CSIRO and Bureau of Meteorology have just put out a joint report claiming that there is going to be an increase in the number of hot days and thus an increased risk of devastating bushfires — based on homogenised (remodelled) temperatures, of course.

CSIRO experts forecast bushfire risk based on Bureau temperature data, but they don’t first undertake any quality assurance of the Bureau’s data.

If we consider one of the best long and continuous temperature series for southern Australia, which is the Rutherglen raw temperature data, and just maximum temperatures in summer: the hottest summer was back in 1938-1939, as shown in this chart.

Mean Maximum temperatures as measured at Rutherglen during summer (December 1912 to February 2016). Full report at http://climatelab.com.au/newclimate/10.22221/nc.2016.001/
Mean Maximum temperatures as measured at Rutherglen during summer (December 1912 to February 2016). More more information see http://dx.doi.org/10.22221/nc.2016.001.

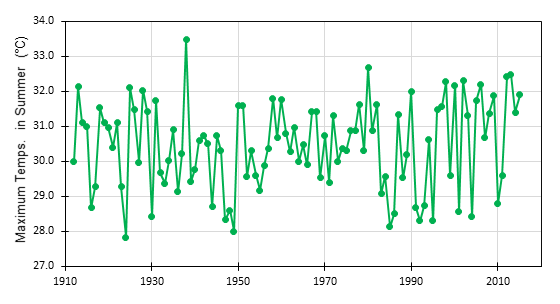
On 13 January 1939 this region experienced one of the worst bushfire disasters in Australia’s history; it became known as Black Friday.

At 33.5°C, the summer of 1938–39 was 2.2°C hotter than the average maximum temperature during the ten most recent summers at Rutherglen, and a full 3°C hotter than the average maximum summer temperature at Rutherglen for the entire period of the record.

And yet today the Bureau and CSIRO are suggesting we should be concerned by a 1°C increase in average temperature over the last 100 years.

Rather than fear mongering, the CSIRO would do well to actually consider the actual integrity of the data being provided by its partner – the Bureau of Meteorology.

In a recent article published by On Line Opinion, I explained that the difference between the official-adjusted maximum temperature for Rutherglen on 13th January 1939 versus the actual measured value is rather large– more than 5 °C. Historical temperature data is used to model and forecast the likely impact of future bushfires, with Fire Danger Indices sensitive to small changes in temperature.

********************
1. The BOM-CSIRO State of the Climate report is here http://media.bom.gov.au/releases/308/state-of-the-climate-2016-delivers-the-latest-science-on-our-changing-climate/ , some media is here http://www.abc.net.au/news/2016-10-27/bom-csiro-forecast-more-hot-days-fire-season-climate-change/7968992

2. Homogenised temperatures, and planning for bushfires
http://www.onlineopinion.com.au/view.asp?article=18490&page=1

Filed Under: Information, Uncategorized Tagged With: Bushfires

Response to ‘Yes Minister’ report by Ron Sandland

June 18, 2015 By jennifer

FOLLOWING  are my initial comments in response to the release of the report by the Technical Advisory Forum on the Australian Climate Observations Reference Network (ACORN-SAT):

Dr Sandland chairs 'The Forum' that has so far refused to hold an open forum.
Dr Sandland chairs ‘The Forum’ that has so far refused to hold an open forum.

I NOTE that The Forum, chaired by Dr Ron Sandland formerly of the CSIRO, concurs with the Bureau that:

“There is a need to adjust the historical temperature record to account for site changes, changes in measurement practices and identifiable errors in measurement…  To this end, the Forum supports the need for the Bureau’s homogenisation process to incorporate both metadata-based adjustments and adjustments based on the statistical detection of atypical observations. In the opinion of the Forum members, unsolicited submissions received from the public did not offer a justification for contesting the overall need for homogenisation or the scientific integrity of the Bureau’s climate records.”

As a member of the public who made an unsolicited submission, I would like to clarify that at no time did I suggest there was no need for adjustments, rather I have queried why there are adjustments made when, in fact, there are no documented site changes, no changes in measurement practices, and no identifiable errors.  Yet adjustments are still made.

The Forum appears to have overlooked many examples of this provided in the public submissions, and published by The Australian newspaper late in 2014.  For example, the Forum has completely ignored the notorious example of Rutherglen, where a slight cooling trend was converted into a warming trend, despite an absence of any metadata providing justification.

The Forum has also made no comment on the actual choice of stations for inclusion in ACORN-SAT, nor how the selection of stations has changed in recent years.  For example, in his submission to the panel, retired chartered accountant Merrick Thomson showed how the choice of ACORN-SAT stations changed from 2012 to 2013 and, how this could generate a large increase in global warming.

The Forum has suggested that the Bureau consider pre-1910 data in its analysis of climatic trends.

“Recommendation 5: Further, the possible availability of pre-1910 data at south-eastern sites may allow for a comparative analysis to be performed for south-eastern Australia to assess whether the inclusion of pre-1910 data is worthwhile in attempting to understand current temperature patterns.”

This is currently listed as a low priority by The Forum, but its inclusion is nevertheless welcome, and was a key recommendation in my submission.  I also recommended that all temperature series start at the same date.  For example, I provided the example, in my submission, of the Bureau adding in the very hot town of Wilcannia only from 1957, when there is data available from the late 1800s.

I also welcome the recommendation that the Bureau:

“Address two key aspects of ACORN-SAT, namely: a) improving the clarity and accessibility of information provision—in particular, explaining the uncertainty that is inherent to both raw and homogenised datasets, and b) refining some of the Bureau’s data handling and statistical methods through appropriate statistical standardisation procedures, sensitivity analyses, and alternative data fitting approaches.”

I note that The Forum state in their report that:   “It is not currently possible to determine whether the improvements recommended by the Forum will result in an increased or decreased warming trend as reflected in the ACORN-SAT dataset.”

I would suggest that if the committee’s recommendations were properly implemented, and the Bureau abandoned some of its more creative accounting practices (e.g. adding in particularly hot locations for later years in the time series), then it would become apparent that there has been an overall trend of cooling over much of central and eastern Australia from 1880 to 1960, more dramatic warming than previously documented from 1960 through to about 2002, while more recently temperatures have plateaued, with some evidence of a cooling trend establishing in north eastern Australia since 2002.

I note The Forum intends to operate for another two years, and urge them to be honest to their title of “The Forum” and actually meet with some of those who have so far provided unsolicited public submissions.  Indeed, I urge Dr Sandland to immediately set up an open and transparent Forum process whereby these submissions can be presented allowing any accusations of scientific misconduct by the Bureau to be both defended and contested before the Australian public, and media.

The committee makes five recommendations, but puts emphasis on the importance of the first two components of the first recommendation.

I applaud the first component of the first recommendation of the committee that in full states:

“Expediting the Bureau’s current work on developing uncertainty measures in closer consultation with the statistical community. The Forum recommends the Bureau seek to better understand the sources of uncertainty and to include estimates of statistical variation such as standard errors in reporting estimated and predicted outcomes, including: quantifying the uncertainty for both raw and adjusted data; prioritising the provision of explicit standard errors or confidence intervals, which should further inform the Bureau’s understanding and reporting of trends in all temperature series maintained by the Bureau; examining the robustness of analyses to spatial variation; and articulating the effect of correcting for systematic errors on the standard error of resulting estimates.”

Of course, that such basic statistical information is not currently available is impossible to reconcile with the overall conclusion in the report that, “the analyses conducted by the Bureau reflect good practice in addressing the problem of how to adjust the raw temperature series for systematic errors.”   Then again, the executive summary of The Forum’s report appears to have been written by someone straight out of the BBC television series ‘Yes Minister’.

The second component of the first recommendation is also applauded, which reads in full:

“Developing a clearer articulation of the purpose for the ACORN-SAT exercise to enhance public understanding of the program, and communicating processes for developing and using ACORN-SAT in a way that is appropriately clear, broad and supported by graphics and data summaries. In particular, the central focus on the Australian annual mean temperature anomaly as the primary end point of the ACORN-SAT exercise should be reconsidered and a broader narrative around including regional effects should be developed.”

Indeed, it has become apparent over the years that the entire focus of the work of the small ACORN-SAT unit is not the provision of higher quality individual temperature series, but the remodeling of the raw data, and the compilation of a select few station, to suggest that it is getting hotter and hotter across the Australian landmass with such announcements made with great fanfare by the Bureau’s David Jones at the beginning of each year.

Recommendation No. 2, has several components including comment that:

“Releasing the Python computer code for ACORN-SAT as a downloadable link along with all supporting documentation and listing of the technical requirements for the software. The Bureau should also monitor and gather download statistics to gauge demand for this software.”

Of course, without access to this software it has been impossible to reproduce any of the adjustments made by the Bureau. Yet if the method is scientific, it should be reproducible.   For many years, the Bureau has erroneously claimed its methods are transparent.   It should be noted, however, that even with the provision of this software, it will be impossible to justify ACORN-SAT because it is unclear why the Bureau chooses some stations above others for its comparisons.  For example, despite endless requests for clarification, the Bureau has never explained why it uses the distant location of Hillston to make comparison, and then changes, to the raw temperature data for Rutherglen in north eastern Victoria.

Recommendation 2 also includes comment that:  “Publishing a brief, plain-language (as far as possible) description of the criteria for adjustment and the basis for adjustment itself.”    Of course this should have been available since the very first adjustment was made in the development of ACORN-SAT.  That such a document still does not exist is evidence that ACORN-SAT is poorly documented.  So, how could The Forum endorse the Bureau’s claims that it represents world’s best practice?

Dr Jennifer Marohasy
A Coruna, Spain
18th June, 2015

Filed Under: Uncategorized Tagged With: climate, Temperatures

Open Thread

August 8, 2014 By jennifer

Russia is set to ban about $400 million in agriculture imports from Australia. In the past Russia has been a large importer of kangaroo. Screen Shot 2014-08-08 at 8.07.15 AM

Filed Under: Uncategorized

Open Thread

July 21, 2014 By jennifer

From the poem Desiderata:grass flower

Go placidly amid the noise and haste, and remember what peace there may be in silence.

As far as possible without surrender be on good terms with all persons.

Speak your truth quietly and clearly; and listen to others, even the dull and ignorant; they too have their story.

Avoid loud and aggressive persons, they are vexations to the spirit.

by Max Ehrmann, 1927.

Filed Under: Uncategorized

Open Thread

July 21, 2014 By jennifer

THIS THREAD IS ALREADY CLOSED.

According to Larry Fields: I really like the Open Thread. I don’t have the energy to keep up with the long articles at WUWT and elsewhere. Commenters who provide links in the Open Thread help me prioritize my reading.
first step

Filed Under: Uncategorized

Warming Never Completely Negated Earlier Cooling: Some Thoughts on NSW Temperature Trends

June 26, 2014 By jennifer

Last night I presented a paper for the Sydney Institute entitled ‘Modelling Australian and global temperatures: what’s wrong? Bourke and Amberley as case studies’. The paper written with Ken Stewart, Dennis Jensen and John Abbot concludes with some thoughts on the New South Wales annual mean maximum temperature record. In particular we suggest that the record can be thought of as showing a cooling trend of -1.95 degree per century to 1960, and a warming trend of 2.48 degree per century since, Table 1.

Table 1

Taking these values and thinking about them in terms of a rate of cooling for approximately 70 years (1890 to 1960) and then a rate of warming for 54 year (1960 to 2013), we can estimate how much New South Wales cooled and then warmed. The sum of these values gives us the net change, a value that if we then multiple by a total period of 124 years, gives an indication of the rate of cooling per century.

This trend of -0.021 degree C per century suggests that the earlier cooling was almost, but not completely, negated by the later warming. To be clear, the overall temperature trend for New South Wales, calculated from the unhomogenized maximum temperatures as recorded at locations with long series, is one of cooling.

Filed Under: Uncategorized

  • « Go to Previous Page
  • Go to page 1
  • Go to page 2
  • Go to page 3
  • Go to page 4
  • Interim pages omitted …
  • Go to page 334
  • Go to Next Page »

Primary Sidebar

Recent Comments

  • Ian Thomson on Vax-ed as Sick as Unvax-ed, Amongst My Friends
  • Dave Ross on Vax-ed as Sick as Unvax-ed, Amongst My Friends
  • Dave Ross on Vax-ed as Sick as Unvax-ed, Amongst My Friends
  • Alex on Incarceration Nation: Frightened of Ivermectin, and Dihydrogen monoxide
  • Wilhelm Grimm III on Incarceration Nation: Frightened of Ivermectin, and Dihydrogen monoxide

Subscribe For News Updates

  • This field is for validation purposes and should be left unchanged.

November 2025
M T W T F S S
 12
3456789
10111213141516
17181920212223
24252627282930
« Jan    

Archives

Footer

About Me

Jennifer Marohasy Jennifer Marohasy BSc PhD has worked in industry and government. She is currently researching a novel technique for long-range weather forecasting funded by the B. Macfie Family Foundation. Read more

Subscribe For News Updates

Subscribe Me

Contact Me

To get in touch with Jennifer call 0418873222 or international call +61418873222.

Email: jennifermarohasy at gmail.com

Connect With Me

  • Facebook
  • LinkedIn
  • RSS
  • Twitter
  • YouTube

Copyright © 2014 - 2018 Jennifer Marohasy. All rights reserved. | Legal

Website by 46digital