• Skip to primary navigation
  • Skip to main content
  • Skip to primary sidebar
  • Skip to footer
Jennifer Marohasy

Jennifer Marohasy

a forum for the discussion of issues concerning the natural environment

  • Home
  • About
  • Publications
  • Speaker
  • Blog
  • Temperatures
  • Coral Reefs
  • Contact
  • Subscribe

Opinion

Homogenisation of Williamtown temperatures, draws attention to hot Newcastle in 1878

September 15, 2014 By jennifer

WINSTON Churchill famously said that, democracy is the worst form of government except for all the others. Indeed when everyone has the opportunity to have a say it can be difficult to keep everyone marching together in the same direction, at the same speed, repeating the same mantra.

Of course, getting to the truth often requires alternative opinions to be heard, and perhaps now, finally, the mainstream media will start to allow those sceptical of the theory of anthropogenic global warming to have their say. Indeed just today the Newcastle Herald published the opinion of Anthony Cox explaining how the Australian Bureau of Meteorology homogenise the data. It’s a good article, but was not published in full, and published without a key chart showing the affect of homogenisation on the temperature trend.

Williamtown

What the chart actually shows is that for the Williamtown RAAF, near Newcastle, the minimum temperature series that begins in 1951 has been homogenised. That is, in the creation of the official temperature series temperatures have been changed from what was originally recorded. Like for Rutherglen in Victoria, and Amberley in Queensland, the temperatures are dropped down starting in about 1971. This has an affect on the overall trend, changing what was a mild warming of 0.4 degree C per century from 1951 to 2012, into dramatic warming of 1.6 degree C per century.

Ignoring this new example of homogenisation at Williamtown RAAF, and the 28-pages of ‘adjustments’ released by the Bureau just last week that show most, if not all the weather stations that make-up the official station network are corrupted, the first person to comment at the thread that is now open at the Newcastle Herald is suggesting that I am “cherry picking” and that the overall trend for Australia is surely one of warming.

In fact I’ve hardly started with my criticisms, and the overall trend for Newcastle, like the rest of Australia, is very much one of cooling.

Let me explain, Williamston RAAF is one of the 112 stations that is used to calculate national trends, but it’s not the best temperature series for the Newcastle region. It only starts in about 1951. A much more comprehensive record, but one that is conveniently ignored by the Bureau in the development of the official temperature network, comes from the Nobby’s Signal Station, Newcastle. This record starts way back in 1862, and guess what, like most of the really long records it shows that it was much warmer in the late 1800s than for any time since. In fact the hottest years on record are 1877 and 1878.

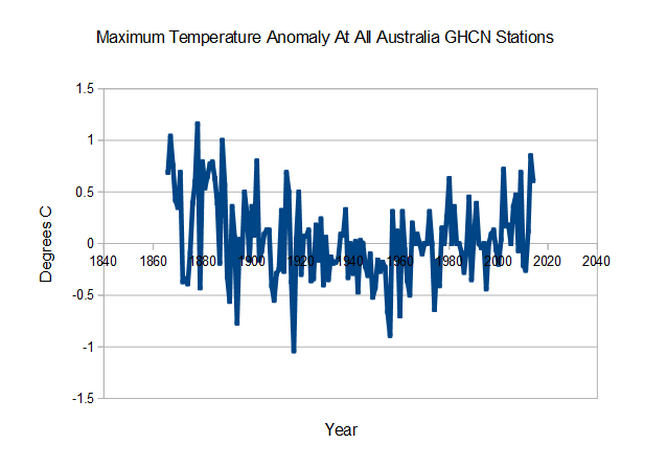
We have been conditioned to believe that temperature have been gradually warming, but this is not what the data shows.

Newcastle

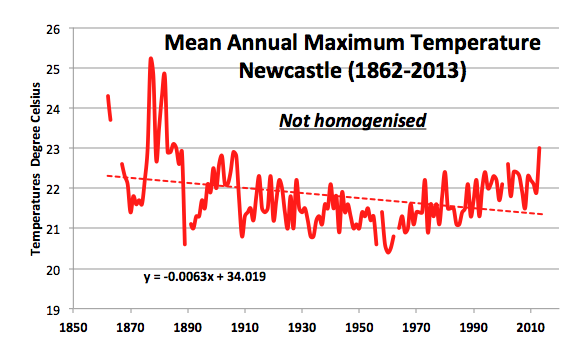
When those early records are taken into account, it is clear that New South Wales experienced cooling from the late 1800s to about 1960. After 1960, temperatures across the state and the nation started to increase. This warming continued until it reached a plateau in 2002. Because the warming of the late twentieth century never completely negated the cooling of the early twentieth century, the overall net trend is actually one of cooling. In the case of Newcastle, its a cooling of 0.63 degree Celsius per century.

****
Also today, Graham Young has republished an earlier blog post by me, ‘Bureau caught in own tangled web of homgenisation’ at On Line Opinion…
http://www.onlineopinion.com.au/view.asp?article=16680

Any comments you can make in this comment thread would be appreciated.

And perhaps also at the Newcastle Herald thread here… http://www.theherald.com.au/story/2558481/opinion-adjusted-temperatures-need-explaining/?cs=308

After all, in a democracy your vote, your opinion, does count even if it does not accord with popular opinion.

If you want to Tweet this, I’ve made a new tiny URL.. http://tinyurl.com/nbm54ts

Filed Under: Information, News, Opinion Tagged With: Temperatures

Open Thread

September 14, 2014 By jennifer

“Whenever a theory appears to you as the only possible one, take this as a sign that you have neither understood the theory nor the problem which it was intended to solve.”
Karl Popper, 1902-1994.

 Karl Popper

Filed Under: Opinion

Open Thread

September 5, 2014 By jennifer

Some things worth remembering …
We are persuaded not by truth, but by fidelity to evidence and context.
It is important to understand the difference between propaganda and information.
Objectivity is a research method, not a philosophy.

Photograph by Lyndon Mechielson

Filed Under: Information, News, Opinion

Go Boldly and Smash all Preconceptions: Steve Goddard

September 4, 2014 By jennifer

WE all have heroes. British biologist Thomas Henry Huxley (1825-1895) is one of mine. The contemporary of Charles Darwin wrote: “Sit down before facts as a little child, be prepared to give up every conceived notion, follow humbly wherever and whatever abysses nature leads, or you will learn nothing.”

I have done this for many temperature series: especially maximum temperature series and for many different localities around Australia, even the Bathurst jail because it has an exceptionally long record beginning in 1857. I have also trawled through some archives boxes, and wished I had time to examine more.

I have slowly developed a picture in my mind of what an amalgamation of all the records might look like. I like to develop my ideas slowly and from the bottom-up. I like detail and am often convinced, until I double check again, that I might have got something wrong.

Then along comes well-known American cyclist, blogger, geologist and electrical engineer, oh and also sceptic, Steve Goddard aka Tony Heller. He announced on Twitter a couple of days ago: I am bored with US temperatures, and have turned my attention to climate fraud in Oz.

He starts with a few odd charts at his Twitter feed. I provided some feed back and then he posts ‘Australian Afternoons Used to Be Much Hotter’. The title and the chart excited me like only an entomologist can get excited when someone has suddenly completed the collection for them.

The chart is as I imaged the maximum temperature trends for, at least eastern Australia, would look like after all my station data was amalgamated. Steve’s methodology is very straightforward: There are 1,655 Australian stations in the GHCN (Global Historical Climatology Network) database that include temperature data. The database is located here: ftp://ftp.ncdc.noaa.gov/pub/data/ghcn/daily/all/. The station list is at bottom. The database includes maximum temperatures. He averages the daily data for each month at each station over the lifespan of the station to generate a monthly mean, and then calculates anomalies from the monthly mean. The numbers in his charts are the average anomaly across all stations for all records during a year.

Screen Shot 2014-09-04 at 9.40.01 PM

What Steve’s chart shows is that it was much hotter in the late 1800s, than at any time since and by a significant margin. He has suggested that 1878 is the hottest year on record. Coincidentally my scrutiny of data from the Bathurst jail weather station had already turned-up the hottest day in that record as being January 12, 1878.

There is a cooling trend to about 1960, and then temperatures start to warm again. But they never reach the highs of the late 1800s and early 20th Century.

Ten years ago, when I started this blog, my daughter wanted to be the first to leave a comment and she wrote: “Do not go where the path may lead, go instead where there is no path, and leave a trail.” Ralph Waldo Emerson.

Steve Goddard has just done this with the Australian temperature record. He has gone where no-one has dared go before. Thank you, Steve.

Filed Under: Information, Opinion Tagged With: Temperatures

So much Conversation, so little evidence

September 2, 2014 By jennifer

I’VE never meet Jo Nova in person. But she can write a good headline, and she cares about the truth. Her blog has never received any government funding, but it includes a lot of interesting facts and evidence on science-related topics.

Jo Nova in conversation.  But not at the public's expense.
Jo Nova in conversation. But not at the public’s expense.

Meanwhile ‘The Conversation’ is a government-funded blog for university researchers that got $6 million dollars just a couple of years ago to employee staff to spout opinion.

Yesterday The Conversation was, as always, short on evidence, but its government-funded scribes could vouch for the Bureau of Meteorology. In particular, Andy Pitman and Lisa Alexander, both part of the global warming industry, authored a long piece about how you should trust them and the Bureau. But the discerning reader might be left wondering why?

Because, as Jo Nova explains at her blog today, they didn’t actually explain how and why it was necessary to change a cooling trend at Rutherglen into a warming trend.

Meanwhile, I’ve been reading a peer-reviewed paper by Blair Trewin, which details how the homogenisation technique employed by the Bureau is meant to work. The only problem is, the methodology as detailed in this paper published in the International Journal of Climatology (Volume 33, Pages 1510-1529) doesn’t actually seem to accord with the methodology as implemented by Dr Trewin at the Bureau of Meteorology. What I mean is, the peer-reviewed paper says one thing, but the output from the homogenisation technique shown in the ACORN-SAT reconstructions suggests something entirely different.

Something that is worth noting in the paper, is comment from Dr Trewin that, “but negative adjustments are somewhat more numerous for minimum temperatures, which is likely to result in ACORN-SAT minimum temperatures showing a stronger warming trend than the raw data do.” What he is saying, in plain English, is that ACORN-SAT may exaggerate the warming trend somewhat as a consequence of artificially dropping down the minimum temperatures. In fact, as I explained with reference to the Rutherglen temperature trends, the Bureau progressively drops down the minimum values from 1973 back through to 1913. For the year 1913 the difference between the raw temperature and the ACORN-SAT temperature is a massive 1.8 degree C.

The apologists, Pitman and Alexander, in their conversation suggest that, “the warming trend across Australia looks bigger when you don’t homogenise the data than when you do”. But this is not what the peer-reviewed literature says. And yet the take home message from their article is believe only this same peer-reviewed literature.

****
More on Rutherglen, Pitman and Alexander in today’s The Australian.

Filed Under: Information, Opinion Tagged With: Temperatures

The ABC of Rutherglen

August 28, 2014 By jennifer

IF global warming is the greatest moral issue of our time, then the truth really does matter. But this morning, I felt that I had been shut outside, or at least cut-off, without having a chance to tell the whole story.

Jennifer Marohasy feeling left out.

Bronwen O’Shea the host of an ABC radio program for the Goulburn Murray, a region that includes the town of Rutherglen, was interviewing me.

Bronwen invited me on to her program, and also someone from the Australian Bureau of Meteorology to discuss the temperature record for Rutherglen. The Bureau declined.

Bronwen began the interview by suggesting that Bureau have only tweaked the figures for Rutherglen. I disagreed. I explained that the Bureau has actually completely trashed the temperature record by changing what had been a slight cooling trend into warming of 1.73 degree C for the last 100 years.

I also explained that this had been achieved by progressively dropping down the original temperatures from 1973. I wanted to explain that the largest change was back in 1913, with the difference between the actual recorded temperature, and the new official temperature a massive 1.8 degree C.

I was cut-off, before I got to explain too much.

I waited, assuming the line had dropped out. But after no one phoned me back I rang back myself. I phoned ABC Goulburn Murray and was put on hold. Guess whom Bronwen was now interviewing?

Answer: the infamous John Cook, a faux sceptic from the University of Queensland.

    Answer: Someone who mentioned the blog site ‘Sceptical science’ and who I assumed was John Cook.**

Mr Cook

    This person

was telling Bronwen that the temperature record for Rutherglen had to be corrected because it was different from everywhere else.

But that is just not true. I haven’t looked at all the weather stations for Victoria. But I have looked at trends for all the stations with long continuous records for the state of New South Wales, which is just across the Murray River from Rutherglen.

Most of the inland records show a very similar trend to Rutherglen. In fact, if we consider the raw data for Deniliquin from 1913 through until the end of the record in 2003 we see a similar pattern of cooling.

Deniliquin is not some random choice of my own. It is listed in the Bureau’s official station catalogue as being one of three nearest sites to Rutherglen, the other two sites listed are Wagga Wagga and Cabramurra. I will look at the data for these locations in due course.

As detailed in my recent paper to the Sydney Institute: after considering all the locations in New South Wales where there are long continuous temperature records available, I have calculated that the net temperature change for New South Wales shows cooling of 0.021 degree per century. That is the net change for the entire state.

In contrast the BOM claims for NSW that there has been a 1 degree C per century warming.

Before I start doing the calculations for all of Victoria, I suggest you get the complete picture for Rutherglen.

To this end I’ve just created a dedicated page for Rutherglen and dedicated it to a real trooper and truth seeker, Judy Ryan.

Here’s the page…

https://jennifermarohasy.com.dev.internet-thinking.com.au/temperatures/rutherglen/

Now. Before anyone makes comment at this thread, could I suggest they at least scan the information as provided… sort of the ABC of Rutherglen that I wasn’t quite able to communicate this morning on the ABC.

* I have been contacted at my Twitter account to say that it was not John Cook. He apparently even has an alibi. So, sorry for misleading anyone. After I phoned back I was put on hold, and could hear Bronwen talking with someone. I wondered who that was. I heard them recommend the website Sceptical Science and assumed, it now appears incorrectly, that it was John Cook.

—————
Photograph by Lyndon Mechielsen.

Filed Under: Humour, Information, Opinion Tagged With: Temperatures

  • « Go to Previous Page
  • Go to page 1
  • Go to page 2
  • Go to page 3
  • Go to page 4
  • Interim pages omitted …
  • Go to page 132
  • Go to Next Page »

Primary Sidebar

Recent Comments

  • Ian Thomson on Vax-ed as Sick as Unvax-ed, Amongst My Friends
  • Dave Ross on Vax-ed as Sick as Unvax-ed, Amongst My Friends
  • Dave Ross on Vax-ed as Sick as Unvax-ed, Amongst My Friends
  • Alex on Incarceration Nation: Frightened of Ivermectin, and Dihydrogen monoxide
  • Wilhelm Grimm III on Incarceration Nation: Frightened of Ivermectin, and Dihydrogen monoxide

Subscribe For News Updates

  • This field is for validation purposes and should be left unchanged.

December 2025
M T W T F S S
1234567
891011121314
15161718192021
22232425262728
293031  
« Jan    

Archives

Footer

About Me

Jennifer Marohasy 
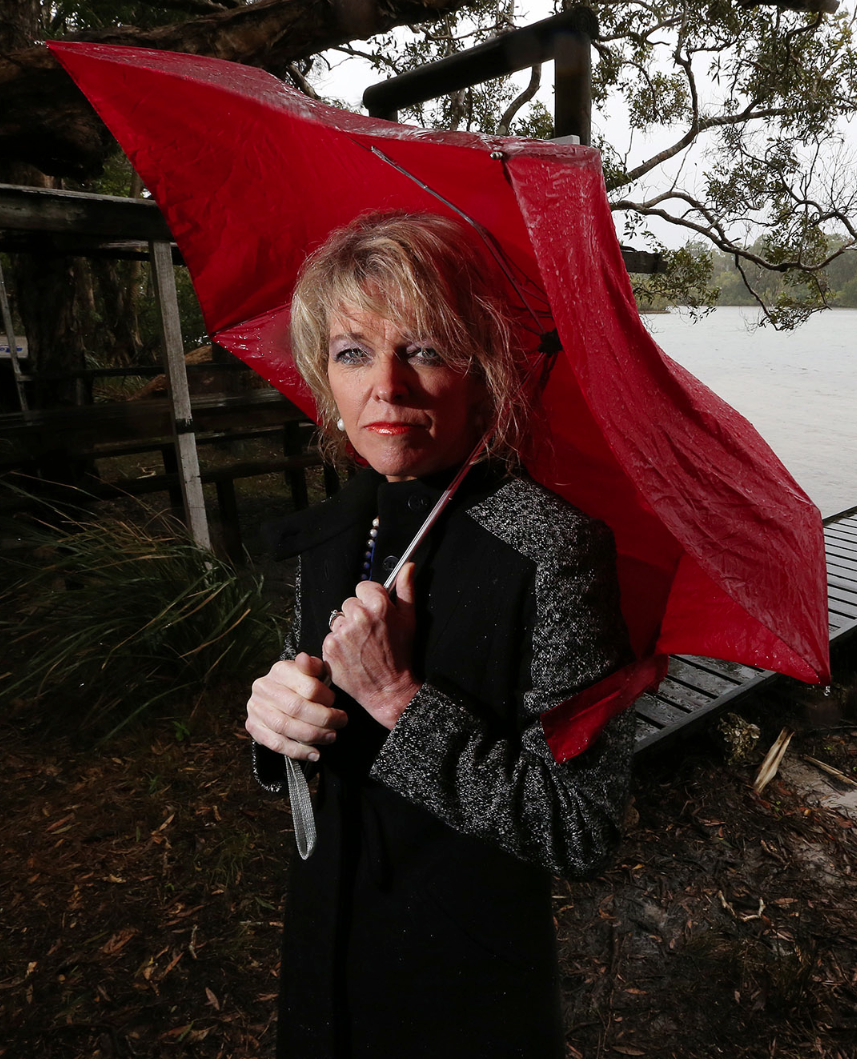
Jennifer Marohasy BSc PhD has worked in industry and government. She is currently researching a novel technique for long-range weather forecasting funded by the B. Macfie Family Foundation. Read more

Subscribe For News Updates

Subscribe Me

Contact Me

To get in touch with Jennifer call 0418873222 or international call +61418873222.

Email: jennifermarohasy at gmail.com

Connect With Me

  • Facebook
  • LinkedIn
  • RSS
  • Twitter
  • YouTube

Copyright © 2014 - 2018 Jennifer Marohasy. All rights reserved. | Legal

Website by 46digital