• Skip to primary navigation
  • Skip to main content
  • Skip to primary sidebar
  • Skip to footer
Jennifer Marohasy

Jennifer Marohasy

a forum for the discussion of issues concerning the natural environment

  • Home
  • About
  • Publications
  • Speaker
  • Blog
  • Temperatures
  • Coral Reefs
  • Contact
  • Subscribe

News

Who’s going to be sacked for making-up global warming at Rutherglen? Part 2.

September 19, 2014 By jennifer

THE Bureau of Meteorology has spent several weeks looking for documentation to support its recent claim that, contrary to what is written in its published station catalogue, the weather station at Rutherglen was once moved. Station Catalogue

The Bureau hasn’t been able to find any actual documentation to verify this move. But this hasn’t stopped it nevertheless concluding that there was a station move and publishing a document, not in the peer-reviewed literature, but on the Internet to conclude that the weather station was once moved between paddocks.

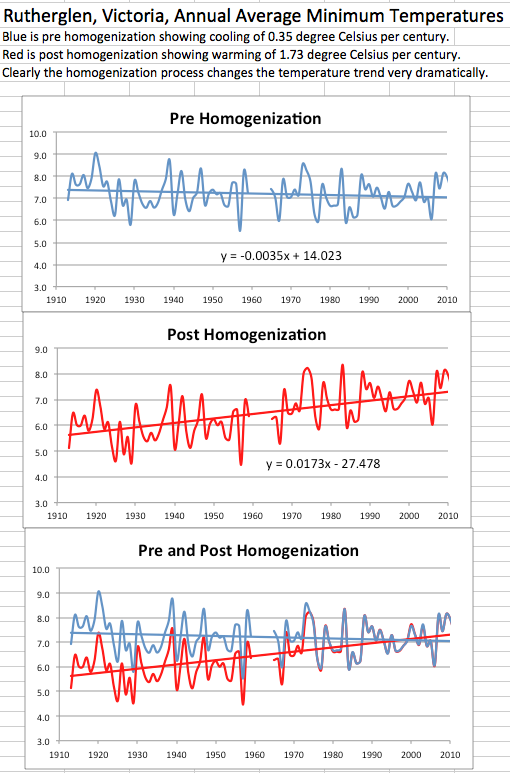
Furthermore, but not even published on the Internet, this move between paddocks, that could have occurred in 1966 or even 1974 apparently justifies a drop down in minimum temperatures, with the largest change a 1.8 degree Celsius difference between recorded and homogenised temperatures for Rutherglen in 1913. The net effect on the temperature trend is the creation of a 1.73 degree Celsius per century warming, where previously there was a 0.35 degree C per century cooling in the minimum temperature series.

It makes no sense!

But it hasn’t stopped the alarmists on Twitter and at HotWhopper claiming the Bureau was right all along: the weather station had moved, there are maps and photographs and conclusions, just no actual documented evidence. Indeed it doesn’t seem to have occurred to Lotharsson and the rest of the HotWhopper cheer squad, that if the Bureau was able to find inspection reports, requests for replacement equipment and more, that there should also be documentation if the station had actually been moved!

Of course it may have been moved, and the documentation may have been lost, but that still doesn’t justify the change in magnitude and direction of the temperature trend for Rutherglen that the Bureau has made.

My colleague, Bill Johnston, has forensically examined the temperature data generated by the weather station at Rutherglen. Dr Johnston is of the opinion that it is possible that there was a site move in 1965. He can find a break in the data at this time. But even accounting for this, there is no overall warming trend in the data either side of this break. So, Dr Johnston has concluded after running three independent statistical tests over the data, that it is the Bureau that has changed the data, resulting in a bias in the data series where none previously existed.

HotWhopper haven’t actually examined the data, or thought about whether moving a weather station between paddocks in a relatively flat rural terrain could cause a change in the direction and magnitude of the temperature trend. They are just celebrating that the Bureau could publish on the Internet claiming a site move.

According to HotWhopper, quoting the Bureau, the need for an adjustment to the Rutherglen data was made through the application of, “an objective statistical test that showed an artificial jump in the data during this period” prior to 1966.

In fact statistical tests cannot show “artificial jumps”. What empty heads they are at HotWhopper and the Bureau!

Statistical tests can detect breakpoints in temperature series. These may be attributable to climatic or non-climatic factors.

The Bureau claims that, 1966 and 1974 dates match the two breakpoints in minimum temperatures through a “statistical comparison of its [Rutherglen] data with other site data in the region.”

So, the Bureau is suggesting the “jump” is non-climatic and due to the weather station being moved because, while there is “no firm documentation” for a site move, 12 documents have been located that together, they claim, provide some circumstantial evidence for the weather station having been moved between paddocks.

Importantly, the Bureau is not claiming any breakpoints in the Rutherglen data per se, but rather that the trend at Rutherglen is not consistent with its neighbours at about the times for which there is circumstantial evidence the station was moved from one paddock to another.

It is in fact disingenuous and illogical for the Bureau to suggest that what could only be considered an insignificant move, if indeed it did occur, that is a move between paddocks in a relatively flat rural terrain could create a change in the direction and magnitude of the temperature trend.

But there is more. While the BOM claim a discontinuity based on neighbouring stations the algorithms and/or test that might show such a result are not disclosed. We are expected to believe this is the case, but this is not science because no methodology has been provided. In fact, when one of my colleagues, Ken Stewart, tested this proposition. He found that the raw data for Rutherglen has a virtually identical trend to its neighbouring comparison sites, while the homogenised ACORN-SAT data for Rutherglen is strongly biased towards warming relative to those neighbouring sites.

So, I ask again, who is going to be sacked for making up global warming at Rutherglen?

Filed Under: Humour, Information, News Tagged With: Temperatures

Homogenisation of Williamtown temperatures, draws attention to hot Newcastle in 1878

September 15, 2014 By jennifer

WINSTON Churchill famously said that, democracy is the worst form of government except for all the others. Indeed when everyone has the opportunity to have a say it can be difficult to keep everyone marching together in the same direction, at the same speed, repeating the same mantra.

Of course, getting to the truth often requires alternative opinions to be heard, and perhaps now, finally, the mainstream media will start to allow those sceptical of the theory of anthropogenic global warming to have their say. Indeed just today the Newcastle Herald published the opinion of Anthony Cox explaining how the Australian Bureau of Meteorology homogenise the data. It’s a good article, but was not published in full, and published without a key chart showing the affect of homogenisation on the temperature trend.

Williamtown

What the chart actually shows is that for the Williamtown RAAF, near Newcastle, the minimum temperature series that begins in 1951 has been homogenised. That is, in the creation of the official temperature series temperatures have been changed from what was originally recorded. Like for Rutherglen in Victoria, and Amberley in Queensland, the temperatures are dropped down starting in about 1971. This has an affect on the overall trend, changing what was a mild warming of 0.4 degree C per century from 1951 to 2012, into dramatic warming of 1.6 degree C per century.

Ignoring this new example of homogenisation at Williamtown RAAF, and the 28-pages of ‘adjustments’ released by the Bureau just last week that show most, if not all the weather stations that make-up the official station network are corrupted, the first person to comment at the thread that is now open at the Newcastle Herald is suggesting that I am “cherry picking” and that the overall trend for Australia is surely one of warming.

In fact I’ve hardly started with my criticisms, and the overall trend for Newcastle, like the rest of Australia, is very much one of cooling.

Let me explain, Williamston RAAF is one of the 112 stations that is used to calculate national trends, but it’s not the best temperature series for the Newcastle region. It only starts in about 1951. A much more comprehensive record, but one that is conveniently ignored by the Bureau in the development of the official temperature network, comes from the Nobby’s Signal Station, Newcastle. This record starts way back in 1862, and guess what, like most of the really long records it shows that it was much warmer in the late 1800s than for any time since. In fact the hottest years on record are 1877 and 1878.

We have been conditioned to believe that temperature have been gradually warming, but this is not what the data shows.

Newcastle

When those early records are taken into account, it is clear that New South Wales experienced cooling from the late 1800s to about 1960. After 1960, temperatures across the state and the nation started to increase. This warming continued until it reached a plateau in 2002. Because the warming of the late twentieth century never completely negated the cooling of the early twentieth century, the overall net trend is actually one of cooling. In the case of Newcastle, its a cooling of 0.63 degree Celsius per century.

****
Also today, Graham Young has republished an earlier blog post by me, ‘Bureau caught in own tangled web of homgenisation’ at On Line Opinion…
http://www.onlineopinion.com.au/view.asp?article=16680

Any comments you can make in this comment thread would be appreciated.

And perhaps also at the Newcastle Herald thread here… http://www.theherald.com.au/story/2558481/opinion-adjusted-temperatures-need-explaining/?cs=308

After all, in a democracy your vote, your opinion, does count even if it does not accord with popular opinion.

If you want to Tweet this, I’ve made a new tiny URL.. http://tinyurl.com/nbm54ts

Filed Under: Information, News, Opinion Tagged With: Temperatures

Bureau Caught in Own Tangled Web of Homogenisation

September 12, 2014 By jennifer

THE Australian Bureau of Meteorology now acknowledge that they change the temperatures at most, if not all, the weather stations that make-up the official station network from which national temperature trends are calculated. Indeed, earlier in the week, 28 pages of ‘adjustments’ were released online following a series of articles in The Australian and The Weekend Australian by Graham Lloyd. Scrutinise the detail in this document of adjustments and not only is the rationale and methodology indefensible, but it contradicts information published in the official Station Catalogue which is meant to be the go-to document for understanding this official network known as ACORN-SAT (Australian Climate Observations Reference Network –Surface Air Temperature).

That the Minister has not yet intervened, and that many within the Australian scientific community attempt to justify the practice of homogenisation that creates these ‘adjustments’ that changes cooling trends to warming trends at a whim, is reason for national shame. It all amounts to corruption of the scientific process on a grand scale, with significant economic implications. But not even a whisper about the scandal can be heard from the Australian national broadcaster or the many other typically righteous institutions and individuals that claim to be motivated by the truth.

Yet the deceit is increasingly in plain view. Consider, for example, that the official ACORN-SAT Station Catalogue clearly states on page 6 that in the development of the temperature record for Bathurst Agricultural Research Station (Station No. 063005) data from the longer Bathurst Gaol (Station No. 063004) record was not used. Now go to the 28-page ACORN-SAT Station Adjustment Summary and it lists eight occasions when the Bathurst Gaol record was used to make changes to the Bathurst Agricultural Station Record, which cumulatively have changed the temperature record by 4.65 degree Celsius in different directions at different times.

Also note amongst the changes made to this temperature series the addition of 0.6 degree C to the maximum temperature series (applied to all data prior to 1971) following the installation of a Stevenson screen. That’s right. While the Bureau has been claiming it must discard all data prior to 1910 because until this year stations didn’t have Stevenson screens, in fact we can now see that it has accepted post-1910 data from stations that did not have screens installed until later, in some cases not until 1971.

Moving across the border into Victoria: the Bureau released the ‘adjustments’ used to homogenise the temperature series from the Agricultural Station at Rutherglen (also part of the ACORN-SAT network) about a week earlier than for everywhere else. This followed the series of articles in The Australian newspaper questioning why a cooling trend in the original record from Rutherglen had been turned into a warming trend in the official record.

Rutherglen

Ken Stewart has already attempted to use the data for Rutherglen that was released last week to understand how and why the Bureau homogenised the temperature series at Rutherglen. After several days work he came to the conclusion that either the wrong list of 17 stations (against which the Bureau claimed it has made comparisons) was provided and/or their percentile-matching algorithm produced an error. In short, the method when applied as per the newly provided information produces an altogether different result to that documented by the Bureau, at least for Rutherglen.

But why even bother with the homogenisation when there was no good reason in the first place to apply it to Rutherglen?

After Graham Lloyd first brought the issue of homogenisation at Rutherglen to the nation’s attention the Bureau replied that the process had needed to be applied because there had been a site move. But it has since been unable to provide any evidence, and the claim contradicts its own station catalogue.

It is the case that when weather stations are moved, for example, from post offices to airports, discontinuities can be created in the data that may need to be corrected. But in fact there is no evidence to suggest that the weather station at Rutherglen has ever moved. For the last 100 years it has been sitting in a flat paddock, creating a near perfect temperature series. In fact, all that seems amiss with the temperature series is that the minimum temperatures show a cooling trend, contrary to global warming theory.

Statistician David Stockwell had tested the original minimum temperature series for Rutherglen for discontinuities and found none. Agronomist Bill Johnston has run his own very fine-scaled ‘ruler’ over the same dataset and found step-changes that could be attributable to shifts in the climate, the equipment or something else. But nevertheless when all of these micro-lumps and bumps are accounted for, Dr Johnston concludes that the residual trend is no different to zero-trend. In other words, no need to make any adjustments.

Drs Stockwell, Johnston and myself have all been called deniers by the mainstream climate science community for drawing attention to the logical inconsistencies obvious in the homogenisation of Rutherglen. But at the same time none of the same name-calling scientists, who draw a government salary for their apparent expertise in this area, have been prepared to actually mention the word ‘Rutherglen’ in public – let alone discuss the data.

I’ve come to the conclusion that those who have so far defended the homogenising of the temperature series at Rutherglen, Amberley, Deniliquin and Bourke, as the first example that I have thrown up over the last few weeks, are acting either on faith, ignorance or the new morality being preached by technocrats who believe it is wholly legitimate to change received evidence when it does not accord with theory. In the case of the Bureau it’s called homogenisation. Ansley Kellow in his book Science and Public Policy refers to the phenomenon as noble cause corruption.

With the release of the 28-pages of adjustments earlier in the week it should be crystal clear that the practice of homogenisation is indefensible and widespread, affecting virtually all the stations that comprise the ACORN-SAT network. This must have significant ramifications for government policy in so many different areas, because the temperature trends created by the ACORN-SAT network underpin the notion that we have man-made global warming.

In a democracy it is the role of government to oversee the correct function of institutions like the Bureau of Meteorology. Greg Hunt is the Minister ultimately responsible. So far he has been silent on the issue. This is in effect condoning what until recently would have been considered a totally unethical practice: changing received evidence to fit a preferred storyline. It’s unacceptable, but will Minister Hunt do anything about it? Will the national broadcaster even report on it? What can you do about it?

Postscript:

Over recent years the Australian Bureau of Meteorology has been given increasing responsibilities and more and more funding. For example, with the Water Act 2007, it has taken over responsibilities for provision of information that determines water allocations within the Murray Darling (essentially the size of the rice and cotton crops), in October last year an initiative of the National Plan for Environmental Information established the Bureau of Meteorology as Australia’s central coordinating authority for all environmental information.

Filed Under: Information, News Tagged With: Temperatures

Open Thread

September 5, 2014 By jennifer

Some things worth remembering …
We are persuaded not by truth, but by fidelity to evidence and context.
It is important to understand the difference between propaganda and information.
Objectivity is a research method, not a philosophy.

Photograph by Lyndon Mechielson

Filed Under: Information, News, Opinion

Don’t Retire: Start a PhD in Paradise

August 16, 2014 By jennifer

BEFORE the 20th Century there was no age for retirement. There existed a leisured class who through birth or industry could choose what work they did – if and when. But, even they didn’t retire.

Retirement, like unemployment, can potentially reduce you to discussion of people, events, and lost opportunities, when great minds discuss ideas. Of course, even greater minds discuss numbers and ideas.

So if you are keen for a sea change, and are a graduate from a science or engineering discipline who enjoys problem solving, consider moving to Noosa and enrolling in a PhD or masters in weather and climate forecasting using artificial intelligence.

Applicants must be Australian citizens or permanent residents or New Zealand citizens, and must be enrolled or intending to enroll in an eligible research higher degree program at CQ University, and be based at the Noosa campus. It is expected that applicants will like problem-solving and playing with numbers; have an ability to work independently, but also be able to follow directions; and want to build a portfolio of co-authored peer-reviewed publications.

The successful applicants will each be provided with a tax-exempt living allowance scholarship for a fixed term of up to 3.5 years, with a commencing stipend of $32,000 per annum.

Jennifer Marohasy at Alexandria Bay, Noosa National Park


POSSIBLE projects include, but are not limited to, the following:

1. Forecasting El Niño-Southern Oscillation

For three decades, there has been a significant global effort to improve El Niño-Southern Oscillation (ENSO) forecasts with the focus on using fully physical ocean-atmospheric coupled general circulation models. Despite the increasing sophistication of these models, their predictive skill remains only comparable with relatively simple statistical models, with some blaming a phenomenon known as the Spring Predictability Barrier (SPB). Preliminary studies suggest that artificial neural networks can forecast through the SPB. It is possible further advances could be made through the refining of input variables building on the work of Aiming Wu (see Neural Networks, Volume 19), and possibly by also potentially considering extra-terrestrial influences including atmospheric tides (see Ken Ring, The Lunar Code).

The development of an improved method for forecasting ENSO through the elucidation of the most relevant input variables could be the focus of this project.

2. Signal processing to understand drivers of rainfall

There is a natural relationship between artificial neutral networks and signal processing. The neural network software that underpins our current prototype models was developed at the University of Florida by researchers in their department of electrical engineering with expertise in signal processing. Our prototype models, however, do not explicitly decompose the rainfall time-series signals into components. If the component signals were elucidated it would potentially aid understanding of the drivers of rainfall, and potentially improve forecasts.

Exploration of these concepts could form the central theme of a project that would best suite a graduate with a background in signal processing and/or electrical engineering.

3. Considering cyclical changes at the Antarctic to forecast rainfall in the Murray Darling

Australian farmers have long sought advice from long-range weather forecasters who operate independently of the Bureau of Meteorology, perhaps beginning with the work of astronomer Inigo Owen Jones. Modern forecasters using the same cyclical variations claims a strong relationship between higher sea ice averages in the Antarctic and periods of below average rainfall for eastern Australia and heavier late season frosts (see Kevin Long, www.thelongview.com.au). The Antarctic Oscillation (also known as the Southern Annular Mode or SAM) is also thought to be an important driver of rainfall variability in southern Australia (see Australian Bureau of Meteorology, http://www.bom.gov.au/climate/enso/history/ln-2010-12/SAM-what.shtml).

The focus of this project could be input selection and optimisation for monthly rainfall forecasting in the Murray Darling, including a consideration of the Antarctic Oscillation and changes in sea ice extent.

4. Modelling past temperatures and forecasting future temperatures – globally and locally

General circulation models, that underpin the current dominant paradigm in climate science and forecast global warming, simulate climate based on an assumed first principles understanding of the physical process. In contrast, ANNs rely on historical climate data to acquire knowledge, learn relationships, model and measure relationships and then use this information to make forecasts.

ANNs could be used to both provide an independent forecast of future temperatures, and as an independent method of GCM validation under future climate. Limited research is already occurring in this area (e.g. Kisi and Shiri, International Journal of Climatology Volume 34) and could be the focus of more than one PhD and/or Masters project. Such projects could also explore local, regional and global variability in temperatures historically and into the future.

The integrity of historical temperature data is largely irrelevant to the performance of a GCM, but critical to the operation of an ANN. So projects that focused on the use of ANN for forecasting future climate, would very likely benefit from first developing a technique for creating continuous series of high quality temperature data for individual locations as an input variable. While such temperature series theoretically already exist, they are not stable over time and often represent a modelled version of the temperatures originally recorded (see Zhang et al, Theoretical and Applied Climatology, Volume 115; Stockwell and Stewart, Energy & Environment, Volume 23; J. Nova http://joannenova.com.au/tag/homogenization-temperature-data/ T. Heller http://stevengoddard.wordpress.com/2014/07/18/nasa-hacking-australia/; B. Dedekind http://wattsupwiththat.com/2014/06/10/why-automatic-temperature-adjustments-dont-work/; Marohasy et al., The Sydney Papers Online, Issue 26).

5. Forecasting rainfall to aid mine scheduling

There is a need for more skillful medium-term rainfall forecasts for the Bowen Basin, a key coal-mining region in Queensland. Official seasonal forecasts are currently based on general circulation models, are not reliable, and do not provide adequate information in terms of timing and strength of rainfall for mine scheduling and pro-active risk management. V.S. Sharma and colleagues detail these issues in a report published by the National Climate Change Adaptation Research Facility in 2012.

The focus of a PhD or masters could include investigation of the possibility of using ANNs to generate forecasts for shorter time intervals (2 weeks and 1 week) and shorter lead times (2 weeks and 1 week) and using humidity, atmospheric pressure, cloudiness, wind direction and speed, as well as key climate indices as input variables.

John Abbot thinking at the Sunshine Beach Surf Club.


NEXT STEP, if you are interesting in applying, or just want more information, please contact me on mobile 041 887 32 22 or email jennifermarohasy at gmail.com. Closing date for applications is 30th October 2014.

THERE is more information on the scholarships at the CQ University website at:
http://www.cqu.edu.au/research/future-candidates/scholarships

General information about ANNs is taught as part of machine learning courses. Yaser Abu-Mostafa at the California Institute of Technology offers such an introductory online course, which includes some theory, algorithms and applications, available for download and viewing at https://work.caltech.edu/telecourse.html.

Our ANNs are based on software developed by Neurosolutions. More information on this software is available at http://www.neurosolutions.com .

Recent relevant publications by John Abbot and me include:

Abbot J., Marohasy J., 2015. Using artificial intelligence to forecast monthly rainfall under present and future climates for the Bowen Basin, Queensland, Australia. International Journal of Sustainable Development and Planning. In press

Abbot J., Marohasy J., 2014. Input selection and optimization for monthly rainfall forecasting in Queensland, Australia, using artificial neural networks. Atmospheric Research 128 (3), 166-178

Abbot J., Marohasy J., 2013. The potential benefits of using artificial intelligence for monthly rainfall forecasting for the Bowen Basin, Queensland, Australia, In: Brebbia, C.A. (Ed.), Water Resources Management VII, WIT Press, Southhampton, (on-line) doi:10.2495/WRM130261

Abbot J., Marohasy J., 2012. Application of Artificial Neural Networks to rainfall forecasting in Queensland, Australia. Advances in Atmospheric Science 29, 717-730

Relevant other references include:

Australian Bureau of Meteorology, 2014. The Southern Annular Mode (SAM) http://www.bom.gov.au/climate/enso/history/ln-2010-12/SAM-what.shtml

Dedekind, B. 2014. Why automatic temperature adjustments don’t work http://wattsupwiththat.com/2014/06/10/why-automatic-temperature-adjustments-dont-work/

Heller A., 2014. NASA Hacking Australia http://stevengoddard.wordpress.com/2014/07/18/nasa-hacking-australia/

Halide H., Ridd P., 2008. Complicated ENSO models do not significantly outperform very simple ENSO models. International Journal of Climatology 28, 219–233

Kisi O., Shiri J., 2014. Prediction of long-term monthly air temperatures using geographical inputs. International Journal of Climatology 34, 179-186

Long K., 2014. Current forecasts http://www.thelongview.com.au/forecast.html

Marohasy J., Abbot J., Stewart K., Jensen D., 2014. Modelling Australian and Global Temperatures: What’s Wrong? Bourke and Amberley as Case Studies. The Sydney Papers Online, Issue 26. http://www.thesydneyinstitute.com.au/paper/modelling-global-temperatures-whats-wrong-bourke-amberley-as-case-studies/

Ring K., 2006. The Lunar Code. Random House, New Zealand, pp 208

Risbey J. S., 2009. On the remote drivers of rainfall variability in Australia. Monthly Weather Review 137, 3233-3253

Sharma V.S, et al. 2012. Extractive resource development in a changing climate: Learning the lessons from extreme weather events in Queensland, Australia, National Climate Change Adaptation Research Facility, Gold Coast, pp. 110.

Stockwell D., Stewart K, 2012. Biases in the Australian High Quality Temperature Network, Energy & Environment, Vol. 23, 10.1260/0958-305X.23.8.1273

Wu A., Hsieh W.W., Tang B., 2006. Neural network forecasts of the tropical Pacific sea surface temperatures. Neural Networks 19, 145–154

Zhang L. et al. 2014. Effect of data homogenization on estimate of temperature trend: a case of Huairou station in Beijing Municipality. Theoretical and Applied Climatology 115, 365-373

Great minds discuss ideas.

Filed Under: Good Causes, News Tagged With: Rainfall forecasting, Temperatures

Fewer Deaths from Heat Events, But Reasons Obscured

July 25, 2014 By jennifer

MORE people died in Australia from extreme heat events in 1896 than in any other year, with 450 dead nationally. The second worst year was 2009 with 432 dead, followed by 1939 with 420. Considering these numbers in terms of total population, then we have a decline from about 13 dead per 100,000 in 1896, to 6 per 100,000 in 1939, to just 2 per 100,000 in 2009.

That’s according to a new paper by Lucinda Coates and colleagues from Risk Frontiers, Macquarie University and the Bushfire Cooperative Research Centre, Melbourne. The paper is entitled, ‘Exploring 167 years of vulnerability: An examination of extreme heat events in Australia 1844-2010’, and published by Environmental Science and Policy (volume 42, pages 33-44).

Coates and colleagues indicate that since 1844 extreme heat events in Australia have killed at least 5,332 people. Most deaths have occurred in January, and within January, most deaths occur on 27th January, which is the day after our national Australian Day holidays.

There are spikes in the total number dead, and also death rate in 1896, 1908 and 1939, Figure 1.


Fig1. Solid continuous line represents heat-related death rate per 100,000.  Other line represents total deaths per year.
Fig1. Solid continuous line represents heat-related death rate per 100,000. Other line represents total deaths per year.


High death rates in 1912, 1914, 1927 and many years in between, suggest higher mortality due to extreme heat events during the early 20th Century. This is consistent with early publications on temperature trends in Australia. For example, a 1953 paper by E.L. Deacon (Australian Journal of Physics, volume 6, pages 209-218) shows the ten-year running average of mean summer maximum temperatures for several locations in central and eastern Australia peaked in the late 1800s, Figure 2.


Fig 2.  Ten-year running averages of mean summer maximum temperature.
Fig 2. Ten-year running averages of mean summer maximum temperature.


This is generally consistent with the unhomogenized temperature record for eastern Australia (see for example Jennifer Marohasy et al. The Sydney Papers Online, Issue 26).

Apparently ignorant of this early publication by Deacon, and the unhomogenized temperature record for Australia, Coates et al. do not make the link between the higher death rate in the early 20th Century and the higher temperatures.

Rather, relying on recent reports from the CSIRO and Bureau of Meteorology, they simply state that since 1950 each decade has been warmer than the previous. While technically correct, such a statement ignores the very hot decades of the late 1800s and early 20th century and as such is misleading.

Coates goes on to state that, “Without adaptive measures, the conjunction of expectations for extreme heat events to be of greater frequency, duration and intensity and an ageing and increasing population suggests an increase in future heat-related fatalities.”

They attribute the fall in the decadal death rate from 1.69 deaths per 100,000 population in the 1910s to 0.26 in the 2000s to a “variety of factors, but mainly to reduced numbers of people working outside, a better informed public, greater freedom of dress and improvement in utilities and services, such as home cooling, access and breadth of health services including aged care services, warning systems and rescue services.”

Filed Under: Information, News Tagged With: Temperatures

  • « Go to Previous Page
  • Go to page 1
  • Go to page 2
  • Go to page 3
  • Go to page 4
  • Go to page 5
  • Go to page 6
  • Interim pages omitted …
  • Go to page 133
  • Go to Next Page »

Primary Sidebar

Recent Comments

  • Ian Thomson on Vax-ed as Sick as Unvax-ed, Amongst My Friends
  • Dave Ross on Vax-ed as Sick as Unvax-ed, Amongst My Friends
  • Dave Ross on Vax-ed as Sick as Unvax-ed, Amongst My Friends
  • Alex on Incarceration Nation: Frightened of Ivermectin, and Dihydrogen monoxide
  • Wilhelm Grimm III on Incarceration Nation: Frightened of Ivermectin, and Dihydrogen monoxide

Subscribe For News Updates

  • This field is for validation purposes and should be left unchanged.

November 2025
M T W T F S S
 12
3456789
10111213141516
17181920212223
24252627282930
« Jan    

Archives

Footer

About Me

Jennifer Marohasy Jennifer Marohasy BSc PhD has worked in industry and government. She is currently researching a novel technique for long-range weather forecasting funded by the B. Macfie Family Foundation. Read more

Subscribe For News Updates

Subscribe Me

Contact Me

To get in touch with Jennifer call 0418873222 or international call +61418873222.

Email: jennifermarohasy at gmail.com

Connect With Me

  • Facebook
  • LinkedIn
  • RSS
  • Twitter
  • YouTube

Copyright © 2014 - 2018 Jennifer Marohasy. All rights reserved. | Legal

Website by 46digital