• Skip to primary navigation
  • Skip to main content
  • Skip to primary sidebar
  • Skip to footer
Jennifer Marohasy

Jennifer Marohasy

a forum for the discussion of issues concerning the natural environment

  • Home
  • About
  • Publications
  • Speaker
  • Blog
  • Temperatures
  • Coral Reefs
  • Contact
  • Subscribe

News

Bureau Just Makes Stuff Up: Deniliquin Remodelled so Rutherglen can be Homogenized

August 11, 2015 By jennifer

The Australian Bureau of Meteorology just makes stuff up.    You may remember Rutherglen, that town in north eastern Victoria, Australia, where the Bureau changed a slight cooling trend in the minimum temperatures to catastrophic global warming?  After they were caught-out, they claimed the “adjustments” were necessary because there had been a site move.  That’s right, moving a weather station between paddocks changed a cooling trend of 0.35 degree Celsius per century into a warming trend of 1.7 degree Celsius!

That didn’t seem so convincing on reflection.  And there has always been the issue of evidence.  That’s right.  Where is it documented that the weather station was ever moved?

More recently, the Bureau has been claiming that it had to change the temperatures at Rutherglen because they were different from temperatures at near-by locations.  Of course, a real scientist wouldn’t tamper with data because it showed an unusual trend.   Rather the unusual result might be investigated.

But not the Bureau.  It changes the trend at Rutherglen so it matches neighboring stations, but only after first changing the trend at neighboring stations so it matches the global warming trend.

In protest I’ve sent an email to the CEO, Vicki Middleton.

Dear Ms Middleton,

Re: Deniliquin shows statistically significant cooling, Rutherglen just shows cooling

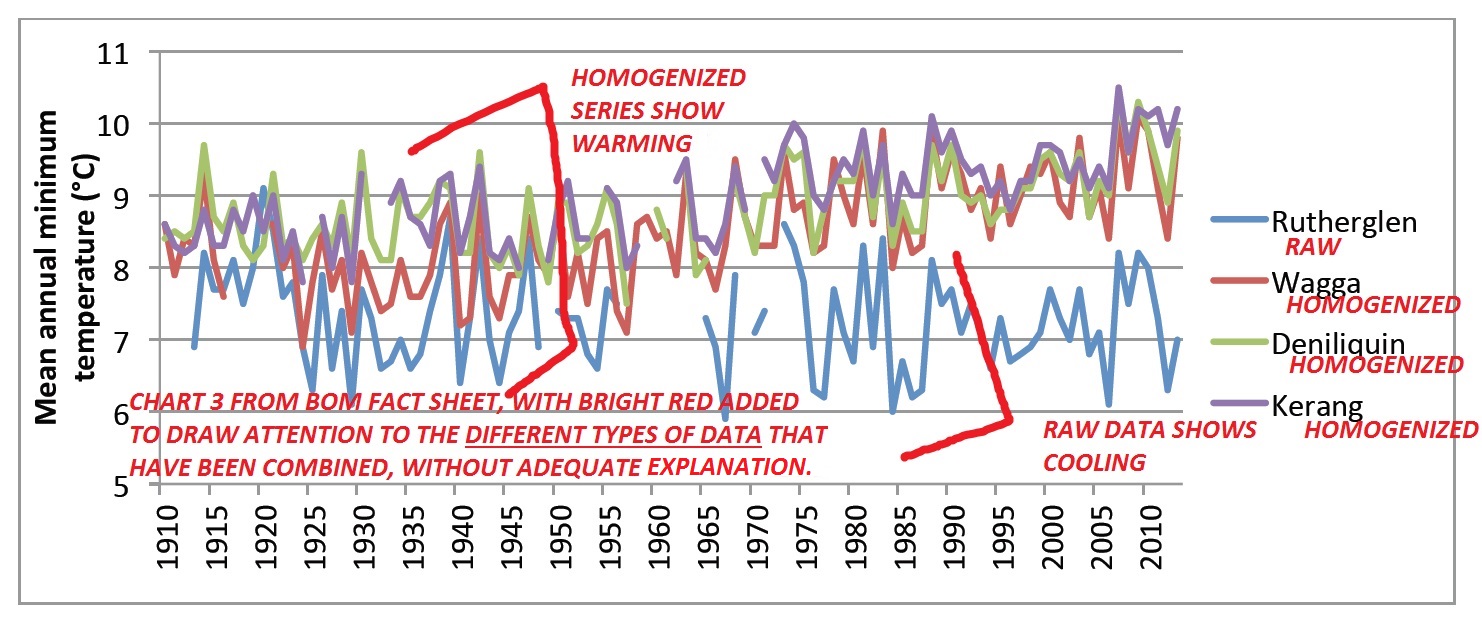
I am writing to request that you correct a Bureau of Meteorology fact sheet*, which shows remodelled (homogenized) data for Wagga, Deniliquin and Kerang with actual physical temperature measurements (raw data) for Rutherglen.

Several members of the public, seeking clarification regarding adjustments to the temperature record for Rutherglen, have been advised by you in recent correspondence that the adjustments at Rutherglen are necessary to make temperature trends at Rutherglen more consistent with neighboring sites.   In particular, you have directed them to this fact sheet* that shows minimum temperatures at Rutherglen cooling, while temperatures at Wagga, Deniliquin and Kerang are warming.  What you have failed to point out, however, is that the Wagga, Deniliquin and Kerang series represent homogenized time series.   That is, the data have been substantially remodelled.

CHART3-WITH EXPLAINATION-Ver2

There is no single, long, continuous, raw minimum temperature record from the same site for either Kerang or Wagga.   Recordings were made at Wilkinson Street, Deniliquin, from February 1867 to June 2003, providing a record comparable in length to the raw series from Rutherglen.

I have plotted the raw temperature series for three Deniliquin locations below, including the data from Wilkinson Street from 1913, which is when the Rutherglen series begins.

Chart3-Revised-Deni-Rutherglen

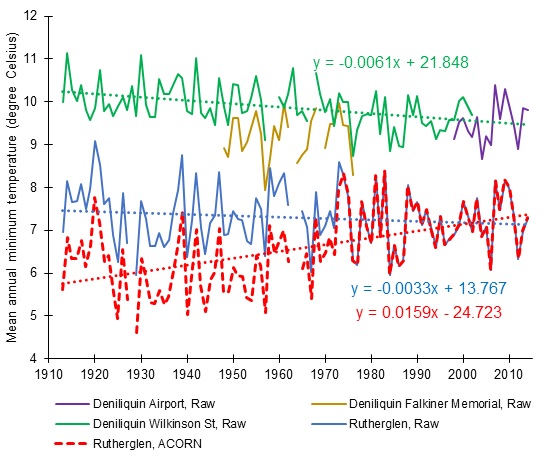
The top green squiggly line represents data from Wilkinson Street, Deniliquin, the short purple squiggle is data from the airport at Deniliquin, and the mustard-colored squiggle is from a site referred to as Falkiner Memorial, Deniliquin.

Also shown in this chart are both homogenized and raw data for Rutherglen, as the red and blue squiggly lines, respectively.

The three dotted-lines represent the linear trends from Wilkinson Street (green), the raw (blue) series for Rutherglen, and the homogenized (red) series for Rutherglen.

The cooling trend in the Wilkinson Street, Deniliquin series of 0.6 degree Celsius per century is statistically significant (p<0.05).

I appreciate that you may have been misled by your employees into believing that the cooling trend at Rutherglen (represented by the blue line in the above chart) is erroneous.   This is not the case.

I recognize that this cooling trend evident in the minimum temperature record for much of the twentieth century at many rural locations in south eastern Australia is inconsistent with official Australian and also global trends.   Nevertheless, it does appear to be real, and is statistically significant for some locations.   Of course, real scientists are concerned with the interpretation of real data, rather than remodeling to generate constructs that fit popular political agendas.

Yours sincerely,
Jennifer Marohasy BSc PhD
Independent Scientist

9th August, 2015

Copy Maurice Newman, chairman of the Prime Minister’s Business Advisory Council.

*The following document is cited in Bureau correspondence as a Fact Sheet:

Bureau of Meteorology, 2014. ACORN-SAT station adjustment summary – Rutherglen (as at 24 September 2014), Accessed 8 August 2015.  http://www.bom.gov.au/climate/change/acorn-sat/documents/station-adjustment-summary-Rutherglen.pdf

Filed Under: News Tagged With: homogenization, Temperatures

Remembering, the Day After Tomorrow

July 13, 2015 By jennifer

So, it may be difficult to remember a time in the future!  But do you remember the movie ‘The Day after Tomorrow’ when New York froze over?  That ice age was caused by changes in the circulation of warm water in the Atlantic Ocean, in particular the Gulf Stream closed down because of melting in the Arctic because of carbon dioxide.  Well, that was Hollywood!  Now, a mathematician, Professor Valentina Zharkova, is claiming an imminent big freeze, not because of carbon dioxide, but because of out of synch solar cycles.  DayAfterTomorrow

“In cycle 26, the two waves exactly mirror each other – peaking at the same time but in opposite hemispheres of the sun,” Zharkova told the Daily Mail.

So, I understand that when the number of sunspots is at a minimum, the sun’s general magnetic field is nearly dipolar.  What causes this?

I keep on intending to read-up more on the influence of the gravitational pull of the larger planets on the sun’s magnetism.  I would be interested in best references…

Meanwhile, here’s something from YouTube to amuse those who enjoy virtual horror with a real historical dimension.

Filed Under: Information, News Tagged With: ice age

Like Expecting George Pell to Admit Pedophilia During Sunday Sermon

March 9, 2015 By jennifer

Following is an email just sent to Bob Baldwin concerning the need for him to urgently establish a public forum to enable dissident views to be heard concerning the bastardization of Australia’s official temperature record by the Australian Bureau of Meteorology.

Noosa, Queensland, 9th March, 2015

Dear Mr Baldwin

Re: Robust assessment of the trusted and respected Bureau of Meteorology obviously requires that the dissident view be heard

There once existed a broad consensus that the Church must be the ultimate judge of scientific truths.  That was before the enlightenment.  More recently, there was an equally mistaken consensus that the Church could provide a safe environment for little children.

Those who dared suggested otherwise were first ignored, then ridiculed, and only much later able to fight for truth and justice.   When their concerns finally registered, there was disbelief that such outrageous abuse was allowed to persist for so long.

In your recent appointed as ‘Parliamentary Secretary to the Minister for the Environment’ with responsibility for the Bureau of Meteorology, you have the opportunity to provide a forum for dissident voices to be heard concerning what is perceived by many to be the bastardization of Australia’s temperature record.

Eventually, simply through the establishment of a forum of experts tasked with hearing the alternative evidence, history might  record you as courageous, and as having begun a process that ultimately exposed the deceit and bias that now riddles this once most respected and trusted organization.   This, I thought, was indeed a possibility when I read your media release of January 19, 2015, outlining the establishment of a technical advisory forum that would undertake a “robust assessment” of Australia’s official temperature data set.

Then, just today I was provided with the actual terms of reference for this forum comprising eight statisticians and/or mathematicians, and I see that they intend to meet for only one day each year.  Furthermore, during the morning of this one day they will be lectured to by Bureau scientists, with the afternoon devoted to discussion.

Indeed the current format is likely to be as useful at getting to the bottom of our issues with the Bureau’s revisionist approach to Australia’s climatic history, as expecting George Pell to voluntarily admit pedophilia during a Sunday sermon.

If indeed you are serious about a robust assessment of the Bureau’s handling of temperature data, then I urge you to immediately modify the format for the forum.   I urge you to immediately establish a mechanism for public critical review including testimony from dissidents.

Yours sincerely

Dr Jennifer Marohasy, Independent Scientist

*****

Forum Format & Terms of Reference

Media Release 19th January 2015

Filed Under: Information, News Tagged With: Temperatures

How do we know that Cyclone Marcia was a Category 5 at landfall?

February 20, 2015 By jennifer

Track map BOMTHE Australian Bureau of Meteorology issued a media release last night (19thFebruary) with the headline “Tropical Cyclone Marcia to reach Category 5 system at landfall”.    This morning there was extensive media reporting of Marcia having reached landfall as a Category 5.

But where is the evidence?  And who is asking for it?  Like the Bureau, the Australian media seem intent on hyping the event, rather than providing any critical or dispassionate assessment.

The first technical bulletin for Marcia, issued at 4pm today states that, “surface observations have not captured the highest winds,” and acknowledges that the minimum pressure so far recorded has been 975 hPa inside the eye wall at 1.30 pm at Rockhampton.

In fact, this central pressure only qualifies Marcia as a Category 2.  As one would expect of a category 2, both Rockhampton and Yeppoon have sustained relatively minor house damage and significant damage to trees.

Just before the cyclone made landfall it passed over Middle Percy Island, to the north of Rockhampton, and the lowest central pressure recorded for the system then was 971.6 hPa at 3.39 am this morning.   A wind gust of 208 km/hr was recorded at 4.30 am, which suggests Marcia was almost a Category 3 at this time, even though its central pressure was never recorded as below 970 hPa.   The central pressure of a cyclone needs to be somewhere in the 970 to 955 hPa range to be a Category 3.

This would suggest that even as Marcia approached the Queensland coastline it was never more than a Category 2.

Indeed the raw observational data available at the Bureau’s website would suggest that Cyclone Marcia made landfall just south of Middle Percy Island as a Category 2 approaching a Category 3, but had already weakened to a very ordinary Category 2 approaching Category 1 by the time it reached the city of Rockhampton.

This evidence, however, contradicts the track map at the Bureau’s website, and also the extensive media suggesting that Cyclone Marcia made landfall as a Category 5, and was still a Category 3 system when it reached Rockhampton.

The Australian Bureau of Meteorology has been hyping the possibility of a devastating cyclone hitting the Queensland coastline all year.  It forecast that Marcia would hit as a Category 5 cyclone, but where is the evidence?

*******

Thanks to everyone who has emailed me today with best wishes, assuming I was in Yeppoon when Marcia hit.   Our house there is still standing, with some trees down in the front yard.  I was in Brisbane last night, and am now in Noosa.

Filed Under: Information, News Tagged With: cyclone

Open Thread

September 30, 2014 By jennifer

Sophie C. Lewis and David J. Karoly have just had a paper published by the American Meteorological Society.

crabs are real, homogenised data is not

Its starts on page 31 of a special edition, ‘Explaining Extreme Events of 2013: From a Climate Perspective’ that is a special supplement to the Bulletin of the American Meteorological Society, Volume 95, Number 9, September 2014.

In this peer-reviewed paper I see that the homogenised ACORN-SAT data is labelled “Observations”.

Stupid is as stupid does.

Filed Under: News

Sydney Morning Herald not balanced, not fair, not factual

September 28, 2014 By jennifer

ON 10th September 2014, the Sydney Morning Herald published an article suggesting that I was an amateur, hostile to climate science and in denial. When I attempted to respond by way of an opinion piece, I was told there was no space. That I would not be published. Jen rain

I’ve just lodged a complaint with the Australian Press Council. They only allow 400 words by way of ‘reason for complaint’. I’ve provided the following reasoning:

Michael Brown’s article ‘Pseudoscience and nonsense reign once science is left behind in climate debate’, published by the Sydney Morning Herald on 10th September 2014, is in breach of the Australian Press Council’s General Principles 1 and 3. In refusing to provide Jennifer Marohasy with an opportunity for reply The SMH is in breach of Principle 4.

There are four key errors of fact that combine to mislead the reader. Dr Brown claims Dr Marohasy has found “a few potential errors” in the homogenisation process as implemented by the Bureau. In fact Dr Marohasy has shown that the homogenisation process as implemented by the Australian Bureau of Meteorology is flawed because it can result in changes to both the direction and magnitude of temperature trends. Dr Brown claims Dr Marohasy has cherry-picked a few unrepresentative examples. The examples provided by Dr Marohasy are real, valid, and illustrate the potential impact of homogenisation, which is to mislead the public on climate change. Dr Brown claims that Australia continues to warm and the warming temperature trend is clear in raw and homogenised data for 100 years. In fact Australian and global average surface air temperature has remained more or less steady since 2001 (e.g. Nature Climate Change, volume 4, pages 222-227).

Dr Brown describes Jennifer Marohasy as a “plucky amateur”. Dr Marohasy is not an amateur. Indeed Dr Brown has also omitted key facts in particular that Dr Marohasy is an adjunct research fellow at Central Queensland University with several recent peer-reviewed publications in climate science.

Dr Marohasy submitted an opinion piece correcting some key errors of fact on 15th September 2014. On 16th September she was advised that it would not be published.

In publishing Dr Brown’s opinion, but refusing to publish Dr Marohasy’s rebuttal, the Sydney Morning Herald is continuing to withhold important information from the Australian public, in particular most Australians remain ignorant of the fact that all the data used to calculate national temperature trends is homogenised, that this can have an impact on both the magnitude and direction of temperature trends. Furthermore in publishing an article that suggests Dr Marohasy is “hostile” to climate science, practices “pseudoscience”, is in “denial”, and performs “sloppy” work, the Sydney Morning Herald is not only misleading its readers, but also defaming Dr Marohasy.

I would have thought that in the interests of balance, fairness and keeping their readership across the issue that the Herald could have simply published the opinion piece that I submitted. This article follows:

Evidence and transparency is important in science

If some technocrats had their way, it would be accepted practice to routinely alter historical temperature records, particularly if those records did not accord with global warming theory.

I have complained for some time about the practice of homogenisation undertaken by the Australian Bureau of Meteorology. My concerns were mostly ignored until I gave a lecture at the Sydney Institute in July. There, I described how cooling trends at RAAF Base Amberley in Queensland and the post office at Bourke in New South Wales have been changed into warming trends through homogenisation.

More recently, I provided The Australian with an example from an agricultural research station outside Rutherglen in north-eastern Victoria. Since 1912, a weather station there has observed an overall cooling trend. Rather than incorporate this cooling into the official record, the Bureau has applied algorithms that have flipped the cooling trend of 0.35 degrees Celsius into a warming trend of 1.73 degrees Celsius.

Homogenisation may legitimately be used in climate science to correct for anomalies in data when stations are relocated from one site to another. The Bureau claims that the Rutherglen station was moved in the 1960s or 1970s. Yet there is no evidence to suggest it was ever moved. Even if it were so, this does not explain why the record for, say, 1913 is a full 1.8 degrees Celsius cooler in the modified and homogenised data than in the original.

The overall effect of manmade global warming is estimated to be 0.8 degrees Celsius over the last century. If so, homogenisation has the potential to create a highly distorted impression of temperature trends.

That is only the start. When the entire instrumental record is considered, the very hottest years in Australia occurred in the late 1800s. Indeed the hottest year on record is perhaps 1878, and the hottest January was in 1896. This is not what we have been conditioned to believe, but it is what the data shows. The Sydney Morning Herald itself documented the heatwave of January 1896, reporting on the mass evacuation of affected residents by train from inland regions.

The Bureau believes that data prior to 1910 is unreliable for the purposes of the national record. The same Bureau, however, is happy to use that data for reporting global temperatures.

If we take those early records into account, it is clear that New South Wales experienced cooling from the late 1800s to about 1960. After 1960, temperatures across the state and the nation started to increase. This warming continued until it reached a plateau in 2002. Because the warming of the late twentieth century never completely negated the cooling of the early twentieth century, the overall net trend is actually one of cooling.

Peer-reviewed literature supports my contention that early twentieth century cooling was real and significant and that homogenisation creates an artificial warming trend in the official temperature record for Australia.

Yet last Wednesday in the opinion pages of the Sydney Morning Herald (Pseudoscience and nonsense reign once science is left behind in climate debate) Michael Brown, an astronomer from Monash University, argued that I had found merely “a few potential errors” in the data “while ignoring the fact that warming across Australia is seen in both raw and homogenised data”.

I have always been of the opinion that anyone who doesn’t take truth seriously in small matters cannot be trusted in large ones either. Insisting on precision and transparency is not, as Dr Brown suggests, quackery, pseudoscience or “plucky amateurism”. It is the very essence of scientific method.

Unfortunately, we have reached a stage where consensus is driving the science, rather than science shaping the consensus.

It is often said that global warming is the greatest moral issue of our times. If so, the truth surely matters. Upholding the truth means respecting dissent. It requires careful and public scrutiny of information which does not conform to received wisdom.

____________________________

Dr Jennifer Marohasy is an Adjunct Research Fellow at Central Queensland University with six recent peer-reviewed publications in climate science focused on the application of artificial intelligence to rainfall forecasting. This research required Dr Marohasy to compile long temperature series for different locations as arrays for a neural network model, in the process she became interested in the methodology used by the Bureau of Meteorology in the compilation of an annual average temperature for Australia.

Sources, if required, for para beginning “The peer-reviewed literature”:
Deacon, E.L. 1952, Climatic Change in Australia since 1880, Australian Journal of Physics, Volume 6, Pages 209-218, see especially Figure 1 showing the ten-year running averages of mean summer maximum temperature for Bourke, Alice Springs Narrabri and Hay)

Trewin, B. 2013, A daily homogenized temperature data set for Australia, International Journal of Climatology, Volume 33, see especially page 1524)

Source, if required for para beginning “That is only the start”:

‘Excursion to Cool Climates’, January 25, 1896 and Extraordinary Heat at Wilcannia, January 18, 1896.

Filed Under: Information, News, Opinion Tagged With: Temperatures

  • « Go to Previous Page
  • Go to page 1
  • Go to page 2
  • Go to page 3
  • Go to page 4
  • Go to page 5
  • Interim pages omitted …
  • Go to page 133
  • Go to Next Page »

Primary Sidebar

Recent Comments

  • Ian Thomson on Vax-ed as Sick as Unvax-ed, Amongst My Friends
  • Dave Ross on Vax-ed as Sick as Unvax-ed, Amongst My Friends
  • Dave Ross on Vax-ed as Sick as Unvax-ed, Amongst My Friends
  • Alex on Incarceration Nation: Frightened of Ivermectin, and Dihydrogen monoxide
  • Wilhelm Grimm III on Incarceration Nation: Frightened of Ivermectin, and Dihydrogen monoxide

Subscribe For News Updates

  • This field is for validation purposes and should be left unchanged.

November 2025
M T W T F S S
 12
3456789
10111213141516
17181920212223
24252627282930
« Jan    

Archives

Footer

About Me

Jennifer Marohasy Jennifer Marohasy BSc PhD has worked in industry and government. She is currently researching a novel technique for long-range weather forecasting funded by the B. Macfie Family Foundation. Read more

Subscribe For News Updates

Subscribe Me

Contact Me

To get in touch with Jennifer call 0418873222 or international call +61418873222.

Email: jennifermarohasy at gmail.com

Connect With Me

  • Facebook
  • LinkedIn
  • RSS
  • Twitter
  • YouTube

Copyright © 2014 - 2018 Jennifer Marohasy. All rights reserved. | Legal

Website by 46digital