• Skip to primary navigation
  • Skip to main content
  • Skip to primary sidebar
  • Skip to footer
Jennifer Marohasy

Jennifer Marohasy

a forum for the discussion of issues concerning the natural environment

  • Home
  • About
  • Publications
  • Speaker
  • Blog
  • Temperatures
  • Coral Reefs
  • Contact
  • Subscribe

News

The Injustice of Blowing-Up Turtles, for Convenience

June 8, 2021 By jennifer

It is World Ocean Day, an opportunity to learn more about the Great Barrier Reef and also artificial reefs in the Gulf of Mexico.

It is an injustice that turtles are blown-up in the Gulf of Mexico because American oil companies choose a particular and inappropriate method for undertaking surveys before setting explosives. If they did underwater, rather than aerial surveys, it would be difficult to ever justify blowing-up biological diverse artificial reefs that are old spent oil rigs. It is also an injustice when aerial surveys are undertaken to falsely conclude the Great Barrier Reef is more than 60 percent bleached, when underwater surveys give a completely different and true assessments. It is also an injustice that the Australian Institute of Marine Sciences (AIMS) had a perfectly good methodology for coring corals under-the-water and calculating an accurate overall average coral growth rates for the Great Barrier Reef, but then they changed the methodology and when the new methodology was shown to be flawed by Peter Ridd they did nothing about it. Last week I was told a new and better overall coral growth rate will soon be published for the Great Barrier Reef – but the methodology is not, and will not, be available for scrutiny, especially not to Peter Ridd who was sacked by James Cook University for suggesting there needs to be some checking – some quality assurance. Let me explain in more detail, including about the turtles.

Late last year I went to sea for a week with Shaun Frichette. I’m a biologist, and I was searching for 400-year-old corals that can be 10-metres wide and have annual growth rings, like tree rings, they are in the genus Porites. Large and very old Porites corals used to be cored to calculate an overall coral growth rate for the Great Barrier Reef. Shaun came on the trip at short notice, wanting to know first-hand the state of the Great Barrier Reef; he had heard it was dying. He was working as a volunteer at a turtle rehabilitation centre on Fitzroy Island, which is just to the south-east of Cairns and part of the Great Barrier Reef Marine Park. Ten years ago, he worked as a deep-sea diver in the Gulf of Mexico.

He got into deep sea diving in his late twenties because he had developed a passion for environmental issues especially marine conservation. At the time, he figured if an oil pipe was leaking on the sea floor it took a diver to go down and fix it, so he trained as a commercial diver and went to Louisiana. He did lots of diving on the oil rigs as well as working topside on saturation systems and diver tending. His goal at the time was to become a saturation diver and live life ‘like an astronaut’ except on the sea floor. To achieve that goal, Shaun knew he would have to put in years of hard work proving himself in the industry, but he never realized that the industry would meanwhile prove to care so little for life under-the-sea. For example, the oil companies, trained him to cut through steel with torches that burn at over 10 thousand degrees so that spent oil rigs could be dismantled safely – but instead they sent him down to the bottom of the ocean to plant explosives because it was faster to decommission a rig that way.

Shaun remembers:

The oil companies would send ‘turtle girls’ up in a helicopter to scout dolphins and sea turtles and if they gave the ‘all clear’ charges would go off and we would return to location. The problem was those oil rig platforms become like coral reefs after years of being submerged and the sea life around them is so biodiverse and special.

The turtle girls could only see 5 meters underwater on a good day so what I witnessed was horrific. Turtles cut in half, wounded dolphins and thousands of floating fish stunned from the explosions.

Something changed inside of me after seeing that and it’s altered my life path ever since.

Shaun quit and soon found himself back in California, in the High Sierra, at Lake Tahoe where he first learnt to Scuba dive. He bought into a dive business doing boat salvage and dock repairs during the summer months – while volunteering for marine conservation projects during the winter months when the lake froze over. The bushfires happened in Australia during the 2019-2020 ‘off season’ and after hearing news reports, Shaun volunteered as a fire fighter and came to Australia. Covid hit, and so he stayed-on. First helping with wildlife rescue, before travelling north to see the Great Barrier Reef.

I met Shaun late November 2020 at a café in Cairns. It was the day before we set-off with underwater photographer Stuart Ireland on a hurriedly arranged week at sea. The plan was to look for, and film, a particular type of coral known as Porites with annual growth rings, like tree rings, so they are potentially a time capsule of the ocean’s climate history. We wanted to find the oldest and largest of these corals that AIMS used to core, all the way to Myrmidon reef where there was once an extensive coral coring program.

Some of these Porites corals are huge. Just last year I measured a healthy Porites coral seven metres in width and three metres high, at an inshore reef called Pixie Reef just 40 kilometres to the northeast of Cairns. This is a reef that is classified in the peer-reviewed literature as one of the very worst bleached (more than 60%), yet I’ve struggled to find any bleaching at all at that reef. I’ve also seen Porites large and healthy, in fact dozens of them, in Bowen Harbour where all the corals are meant to be dead from global warming and ocean acidification and poor water quality – yet they are very much alive, or were, when I was there in April and then August 2019. Just three weeks ago at Lady Elliot Island to the east of Bundaberg I found a Porites that was 4 metres in height and so healthy. I asked the local divers if it has ever bleached and I was told by an old guy who has worked on the island for thirty years that it once went blue in colour after a cold snap, that was a few years ago, but that it has never bleached.

Shaun swimming over massive Porites at the Great Barrier Reef in November 2020.

We are repeatedly told, most recently by the Australian Academy of Science, that most (somewhere between 50 and 99%) of the hard corals of the Great Barrier Reef are now dead yet this is not my experience as someone who snorkels and dives. I have seen very large and dead Porites, but not often. Perhaps as often as a I see a dead tree in my favourite national parks.

One of my frustrations with the official reporting on the health of the Great Barrier Reef is that much of it is based on aerial surveys. Not by turtle-girls, but by a university professor. Like the aerial surveys in the Gulf of Mexico, the surveys might be best described as convenient. They are certainly not scientific; despite being published in peer-reviewed scientific journals. The fly-past aerial surveys give the impression they are quantitative and claim that the entire Great Barrier Reef is more than 60% bleached, but the only numbers actually recorded by Professor Terry Hughes looking out the plane window are rankings of 1, 2, 3 or 4 based on his impression of the state of the corals from that high altitude.

At 150-metres altitude he might be just able to just make-out the very large Porites at Pixie Reef on a good day. I sent my drone up and took photographs at 40 and 120-metres altitude of that monster coral that measures 7 metres in width on 25th November 2020. It appeared white and possibly bleached from the air. Yet under the water and up-close it was beige in colour, with healthy zooxanthellae. There was absolutely no bleaching. I gave the coral a score of D3 on the University of Queensland Coral Watch Health Chart (www.coralwatch.org). But who else actually goes to check?

To lament the dying Great Barrier Reef is politically correct, to question this is to risk being labelled a climate change contrarian. Yet my experience over 50 years of diving at the Great Barrier Reef – since January 2020 I have had the opportunity to SCUBA dive almost the entire length of the Great Barrier Reef from the Ribbon Reefs to Lady Elliot Island including dozens of reefs in-between – is that they are still exceptionally diverse and beautiful. The 2016 bleaching event was reportedly the most severe on record, particularly in the northern section including at the Ribbons Reefs, yet most of the reefs appear to be fully recovered.

When university professor Peter Ridd explained the extent of the misrepresentation back in 2015 in an email to a News Ltd journalist, specifically that there are still healthy live corals in Bowen Harbour, while calling out a colleague claiming otherwise, he was reprimanded by James Cook University. To publicly demand some quality assurance of claims the reef is dead and dying is professional suicide. The professor’s dismissal from James Cook University in 2018 – essentially on the basis that he broke the enterprise bargaining agreement by being un-collegial – has been appealed all the way to the High Court of Australia, with that hearing scheduled for 23rd June 2021. The Peter Ridd case is focused on issues of freedom of speech. Not because Peter does not care about the truth, but because the only way we might be able to get to the truth about the health of the Great Barrier Reef is if he can put his evidence – he needs to first have the opportunity to be heard beyond the academic journals that are behind paywalls.

Back in 2013 Peter Ridd published an analysis of how the Australian Institute of Marine Sciences (AIMS) has changed the method they use for coring the Porites corals to calculate an average growth rate for the Great Barrier Reef. The method has essentially been changed for convenience. The data then showed a drop after 1990 that is conveniently consistent with the narrative that the Great Barrier Reef is dying – never mind that the new method is flawed.

Coral growth rate (calcification rate) on the GBR for the 20th century. Left Chart: Coral growth rates calculated by AIMS showing drastic reduction after 1990 and prediction (red dot) for 2020. Right Chart: Reanalysed to account for measurement errors and sampling problems by Peter Ridd. Green dot is the alternative prediction for 2020.
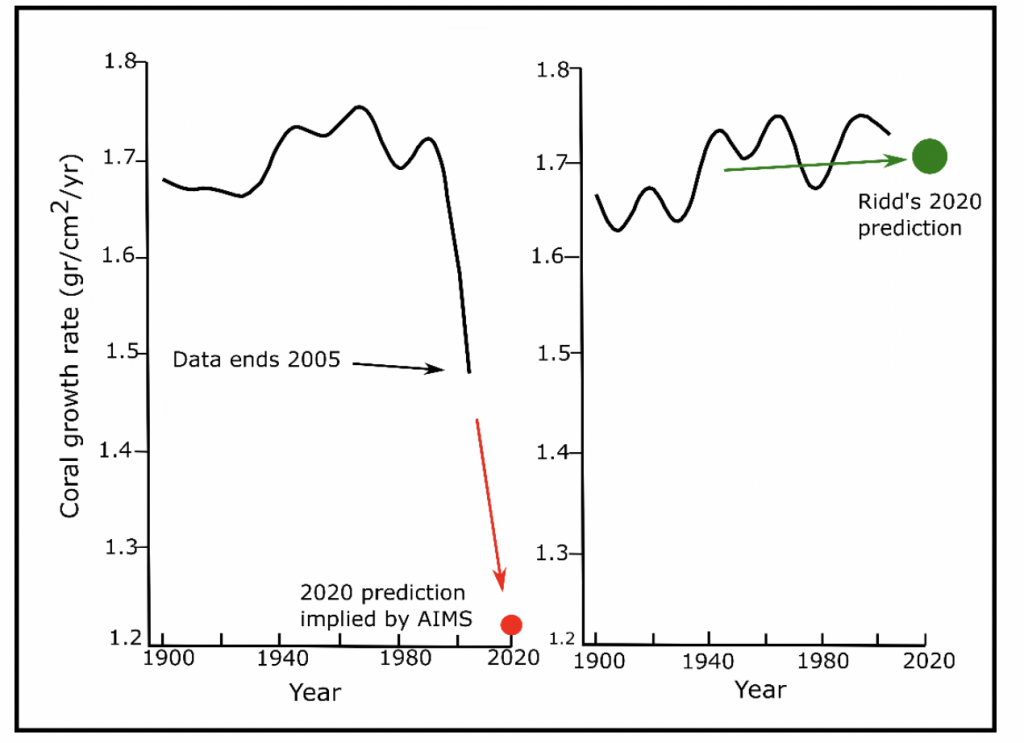
Note: There is no data of the GBR-average growth rate since 2005.

In the 2013 research article in Marine Geology, Peter Ridd explains that firstly there are instrumental errors with the measurements of the Porites annual growth rings undertaken in the early 2000s. This is especially the case for the last layer at the surface of the coral, which was often measured as being much smaller than the reality. This created an apparent drop in the average calcification for the corals that were collected in the early 2000s – falsely implying a recent calcification (growth rate) drop. Secondly, an ‘age effect’ was not acknowledged, specifically the coring program in 2003, 2004 and 2005 focused on smaller colonies, many just a few tens of centimetres in diameter. In summary, while coring in the 1980s focused on large old corals and their growth bands were accurately measured, coring in the early 2000s focused on small young corals and when some of the measurements were checked they were found to be in error.

Yet the two datasets (from the 1980s and early 2000s) were spliced together, and wholly unjustifiable assumptions were implicitly made, but not stated – in particular that there is no age effect on coral growth. Coral growth rates are a potential measure of reef health, but the methodology needs to be consistent. When the data to 2005 is filtered for only the largest and oldest Porites corals, it shows an increase in calcification rates (coral growth rates).

I have made a short film about all of this: showing the Porites, how they used to be cored with archival footage, and also Peter Ridd is interviewed explaining the inconsistencies in the methodology. Towards the end of the film Peter Ridd is actually interviewed by turtle-man Shaun Frichette, and Shaun shows what we found during that week at sea last November all the way to Myrmidon reef in search of the oldest and largest Porites. Myrmidon is nearly 200 kms to the north north-east of Townsville. It is a detached coral reef exposed to the full force of the Pacific Ocean and to continual upwellings from the deep.

In the film we lament that the large old corals at Myrmidon are no longer cored by AIMS to know the climate history of this coral reef on the edge of the Pacific Ocean.

Last Thursday (3 June 2021), I received a phone call from an AIMS scientist, who told me that he still cores some of the old and healthy Porites. He claimed my new film is potentially misrepresenting the AIMS coring program.

I had been trying to talk with someone at AIMS about their coring program for months. In an email sent to AIMS director Paul Hardisty on 10 November 2020, Peter Ridd asked permission for me to film their largest and oldest coral cores and interview Janice Lough for my film – Peter Ridd began his career at AIMS in the 1980s, and was once a colleague of Janice, which was back when many of these cores were first collected. Paul Hardisty never replied to that email.

The scientist who phoned me last Thursday morning explained AIMS will soon be publishing a new overall coral growth rate for the Great Barrier Reef, and that the coring program has not stopped. I was appreciative of the phone call and asked to see the data since 2005 because in my new short film, Peter Ridd explains the coring program to calculate an average coral growth rate for the Great Barrier Reef stopped in 2005 – and that the data to this point is flawed.

In response to this request, I was sent a research paper about coring young Porites corals that was published in 2014, based on coral coring data collected in 2003, 2004 and 2005. I replied to the scientist that it is now 2021! Where is the data for the last 16 years – and how does the new data address the methodological issues detailed by Peter Ridd in his paper published in Marine Geology back in 2013?

What I found most interesting about the technical paper sent to me last Thursday afternoon, is that it laments coral bleaching as something that can cause a ‘growth hiatus’ in the large old Porites, but nowhere does it suggest coral bleaching actually kills these old corals. Also, the paper claims bleaching is a new phenomenon while presenting no data for the period before 1980. Yet AIMS has coral cores that date back to the 1600s, potentially providing 400 years of data including on the incidence of coral bleaching.

Deceit when it comes to issues of great public interest is not new. We have the choice as individuals to close our minds to new information that doesn’t necessarily accord with established narratives, or alternatively reflect on information that at a first glance appear anomalous. We are no better than those who choose to do aerial surveys knowing full well that turtles live under-the-sea, if we only hear and read that which accords with preexisting narratives that keep us conveniently connected to the status quo while misunderstanding the true state of the Great Barrier Reef. If we really care about something, we should want to know everything about it.

Today, on World Ocean Day, my short film starring both Peter Ridd and also Shaun Frichette, will premiere at The Majestic Theatre, in Pomona, not far from where I live. I am so grateful to the ninety people who have already bought their tickets. The bar opens at 2pm, the screening will be at 3pm.

Last Thursday I did extend an invitation to the AIMS scientist who phoned me, I suggested that he come to this screening. I explained that it would be possible to hold a questions and answers session after the screening, that we could even invite some local media so AIMS could clearly explain and hopefully show the last 16 years of data. I was told that this would not be possible.

On 10 June 2021, the IPA will premiere ‘Finding Porites’ on YouTube and also Facebook.

https://www.facebook.com/Inst.ofPublicAffairs/videos/1223155594867184/

***

The feature image, at the very top of this blog post, shows Jennifer Marohasy with a turtle at the Great Barrier Reef in April 2006.

Jennifer Marohasy and Shaun Frichette onboard Kiama during the filming of ‘Finding Porites’

Filed Under: Good Causes, Information, News Tagged With: Great Barrier Reef, Peter Ridd

Half the Corals Dead – But Not in Real Life

October 15, 2020 By jennifer

The claim that half the corals of the Great Barrier Reef are dead is based on a new method using ‘proxies’ (not a direct measure of coral cover), applied to badly cyclone damaged reefs, just after a major coral bleaching event – from which the corals have since recovered.

It has been reported across the world yet again, that the reef is ruin, but none of the publications reporting its demise have bothered to actually send journalists to go and look. They trust the scientists and the journal. Yet Terry Hughes, one of the authors of the new article has been shown time and again to just make stuff up when it comes to the health of individual coral reefs. His research centre (ARC Centre of Excellence for Coral Reef Studies) and the journal that published the most recent article claiming half the coral are dead (London’s Royal Society) have been mired in controversy for years.

Across the western world it has been reported that the Great Barrier Reef is half dead.
____________________________

One of the locations mentioned in the new study is in the far northern section, at North Direction Island. The coral reefs around this small, uninhabited steep granite island have been through the eye of some of the most destructive category 4 and 5 cyclones — Ita in 2014 and Nathan in 2015 — and they were at the centre of the coral bleaching event in the summer of 2016. But the coral reefs there have since recovered.

I dived nearby reefs for a week earlier this year. I went to the Ribbon reefs that follow the edge of Australia’s continental shelf in the far north east to find, and film, coral bleaching.

It is claimed the Ribbon reefs are amongst the worst affected – 60% dead from bleaching. Bleaching is when corals turn white as a result of warmer water temperatures, which climate scientists say is being caused by global warming.

But I couldn’t find any significant bleaching. I mostly found jewelled curtains of coral, appearing to cascade down underwater cliff faces. So colourful, so beautiful, all in crystal clear and warm waters with curious clownfish and a giant potato cod.

The Ribbon reefs represent the most north eastern edge of Australia’s continental shelf. The cliff faces drop 2,000 metres to the sea floor. This photograph was taken at a dive site known as Crackerjack in January 2020. The photograph at the very top of this blog post (with Shirley Wu) was taken at the same dive sites, also in January 2020.

I found the 2,000-year old coral colony known as The Monolith. This is perhaps the largest colony of Pavona clavus coral in the world. I was told by the boat skipper that The Monolith had been badly bleached in 2016. It had fully recovered when I was filmed swimming over it in January 2020. I was filmed by Emmy award winning underwater cinematographer Clint Hempsall.

A study published by Reef Check Australia, undertaken between 2001 to 2014 – where citizen scientists followed an agreed and straightforward methodology at 77 sites on 22 reefs – concluded that 43 sites showed no net change in hard coral cover, 23 sites showed an increase by more than 10 per cent (10–41 per cent, net change), and 17 sites showed a decrease by more than 10 per cent (10–63 per cent, net change). This study was undertaken just before the 2016 bleaching event.

While the new article by the James Cook University scientists, claims both the incident of coral bleaching and cyclones is increasing, there is actually no evidence to support either contention.

The available data (1971 to 2017) indicates there has actually been a decrease in both the number and severity of cyclones in the Australian region.

The official data from the Bureau shows neither an increase in the number or severity of tropical cyclones.

Coral bleaching events tend to be cyclical and coincide with periods of exceptionally low sea levels. The dramatic falls in sea level across the western Pacific Ocean in 2016 are charted on page 267 (chapter 17) of a book I edited, ‘Climate Change: The Facts 2020′.

The dramatic falls in sea level were associated with an El Nino event. These have been documented at the Great Barrier Reef back 3,000 years by Helen McGregor at Wollongong University. I’m specifically thinking of her paper entitled ‘Coral micro atoll reconstructions of El Nino-Southern Oscillation: New windows on seasonal and inter annual processes’, which was published in the journal ‘Past Global Changes’ (volume 21) in 2013.

I was born and bred in northern Australia. The Great Barrier Reef is a second home, and for me the most awe-inspiring natural environment on Earth.

My mother lived and worked on Heron Island at the Great Barrier Reef in 1955. That was the same year the young Bob Endean established the University of Queensland Heron Island Research Station. He went on to become a famous marine biologist, and instrumental in the formation of the Great Barrier Reef Marine Park Authority (GBRMPA) in 1975. According to Endean’s research the Great Barrier Reef was almost always just about to be destroyed by crown-of-thorn starfish.

There is a photograph of my mother, then Joan Edith Pearce, standing knee deep surrounded by Porites coral micro atolls that are stunted and bleached. But Mum, who turns 90 next March, said there was no talk of bleaching back then, everyone was fearful of the starfish.

It is the case that back then and until recently, coral calcification rates were calculated based on coring of the large Porites corals. By dissecting micro-atolls — the type shown in the picture of my mother at Heron Island back in 1955 — it is possible to understand that sea level has been a constraint to coral growth at the Great Barrier reef for at least this long: at least 3,000 years. There is no evidence of overall sea level rise, there is evidence that sea levels have fallen 1.5 metre since the Holocene High Stand.

Corals are animals, closely related to jelly fish, but they differ in having a limestone skeleton. This is hard-stuff, calcium carbonate, and it can persist in the environment and provide an indication of changes in sea level, and also the growth rates of corals, over thousands of years.

There are well established techniques for coring the Porites corals, and then measuring growth rates. But since 2005 the Australian Institute of Marine Science has stopped using this technique to measure how well corals are growing at the Great Barrier Reef. The few studies still using the old technique suggest that as would be expected, as water temperatures have increased marginally, coral growth rates have also increased.

But rather than admit this fact that runs contrary to the zeitgeist, leading research institutions have moved from such direct measures to new and complicated ‘proxies’ – they thus have more flexibility in what they ‘find’ because the measurement is no-longer something that actually represents coral growth rates or coral cover. A proxy vote, for examples, is something delegated. This gives the researchers at James Cook University the potential to generate what might be considered policy-based evidence.

Real science is about actual measurements of real phenomena, and real world observations.

A conclusion in the media reporting of the most recent research is that “there is no time to lose, we must sharply decrease greenhouse gas emissions”. Another assumption, perhaps inadvertently created with bias and agenda. Though, this is not even written into the article. Rather it is reported in the media associated with the article just published by London’s Royal Society. It is assumed. It is also assumed that the corals at North Direction island never recovered from the cyclones and bleaching – yet they have recovered! The coral reefs across this region are magnificent right now, and this can be verified by diving them with one’s eyes wide open.

The Great Barrier Reef is resilient, and individual reefs, including the reefs at North Direction Island, do recover. As I explain in my new short documentary film, the huge colony of Pavona clavus known as The Monolith, that stretches about 30 metres up the limestone ridge at Ribbon Reef No 10, has already endured countless cyclones and bleaching events – it is a survivor.

The Great Barrier Reef as one ecosystem, comprises nearly 3,000 individual reefs stretching for 2,000 kilometres. It is still visible from outer space.

Damaged areas can always be found somewhere because a coral reef that is mature and spectacular today, may be smashed by a cyclone tomorrow.

If we are to accurately measure coral cover, and coral growth rates, then the cycles need to be considered. The methodology used to assess the health of the Great Barrier Reef should be based on direct measures (not proxies), it should be over a reasonable time span understanding that there are regular bleaching events every 18.6 years corresponding with the lunar declination cycle, and it should include a large number of coral reefs.

When we are able to move beyond ‘postmodern science’, only then will what be written in the most prestigious journals correspond with what I see in the real world.

Oh, how I love jumping off boats and going under the water at the Great Barrier Reef where there are still colourful corals and such curious fish.

It is a pity that the make believe in the science journals creates so much fear and anxiety about something that is still so beautiful and magical.

So I took my drone (Skido), and here you can see an aerial looking down onto the reef/bommie that features at the very top of this blog post with Shirley swimming. It is difficult to actually see any corals unless you jump in, and go under the water. Yet the survey back in 2016 by Terry Hughes that first reported extensive coral bleaching was from 300 metres up and out a plane window. The drone shot is from perhaps at most 40 metres altitude.

____
*The new article claiming half the corals are dead is:
Dietzel A, Bode M, Connolly SR, Hughes TP. 2020 Long-term shifts in the colony size structure of coral populations along the Great Barrier Reef. Proc. R. Soc. B 287: 20201432. http://dx.doi.org/10.1098/rspb.2020.1432

Filed Under: Information, News Tagged With: Great Barrier Reef

Asking the Non-Consensual Questions, My New Book on Climate Change

October 4, 2020 By jennifer

He is calling it the ‘thinking sceptics’ guide to climate change. The article is by journalist Graham Lloyd in The Weekend Australian. It is about my new book, Climate Change: The Facts 2020 (CCTF2020).

Graham Lloyd has read the book – all 20 chapters – and he understands the importance of the three chapters by the atmospheric physicists Richard Lindzen, Henrik Svensmark and Peter Ridd. Graham understands that they provide a new perspective on established research that has been difficult for the mainstream climate change establishment to understand, let alone accept.

Graham Lloyd, he understands that Peter Ridd’s important chapter in CCTF2020 builds on the pioneering work of Joanne Simpson, and that Richard Lindzen destroyed the hard core of Catastrophic Anthropogenic Global Warming (CAGW) theory twenty years ago; that was in Lindzen’s seminal paper on the relationship between high altitude cirrus cloud cover and carbon dioxide. There is no role for carbon dioxide in Henrick Svensmark’s theory of how the climate changes (chapter 10), and Svensmark, like Lindzen, is obsessed with clouds.

In CCTF2020 Richard Lindzen writes about cirrus clouds, Henrik Svensmark about cumulus clouds, and the chapter by Peter Ridd is all about my favourite clouds which are cumulonimbus. Peter Ridd and I are both from tropical Australia and we love the drama of watching thunderstorms.

I’ve been saying for so long now that it is not good enough to just disprove CAGW theory, we need to have an alternative theory. I’m hoping that CCTF2020 is the beginning of some public discussion about this. Geoffrey Duffy’s chapter on water vapour (chapter 11) is also important in terms of understanding the basics of weather and climate on planet Earth.

The history of science suggests that new theories are usually supported by new tools. (Galileo and Kepler, for example, were obsessed with telescopes.)

I’ve no doubt that one day, climate models based on artificial intelligence (AI) will replace simulation modelling for weather and climate forecasting. These AI models may look something like the models that John Abbot describes in chapters 9 and 14 of CCTF2020.

Such models may be first made operational by Indonesian meteorologists working at Chinese universities who have taken forward the ideas pioneered by John Abbot and myself. The head of the Indonesian Bureau of Meteorology, Rita Karnawati, understands that weather and climate can be accurately forecast. She is a fan of my work and has a copy of the last book in the CCTF series, published in 2017.

Rita Karnawati thinks about climate in terms of cycles that can be described mathematically. If the Indonesians and Chinese develop this capability more generally before we do in the West, it will give them a big military advantage. She invited me to Indonesia back in 2018-2019 to train her best and brightest in AI.

Me with Indonesian meteorologists and Professor Rita Karnawati (front in white hijab) in Bandung in 2018.

As I explain in the introduction to CCTF2020, it was British meteorologist James Stagg’s capacity to forecast the lull in stormy weather in early June 1944 that gave the allies a huge military advantage in World War II. My mother still remembers D-Day, she was living in London through the war. She doesn’t remember that there was a lull in the storm, but rather waking up to the drone of aircraft overhead. Mum will be ninety next March.

James Stagg, the British meteorologist who advised the supreme commander of the allied forces Dwight D. Eisenhower, understood not only weather fronts, but also lunar cycles. He thought in terms of mathematics and tides – not just ocean tides, but atmospheric tides. And the weather station at Blacksod Point in the far west of Ireland accurately recorded and reported weather statistics to him.

I met with Oscar Alves, who heads the team at the Australian Bureau that is meant to be developing methods for seasonal rainfall prediction. That was back in August 2011, when I was so excited about the potential to forecast monthly rainfall using AI.

Oscar Alves told me that accurate monthly rainfall forecasting is essentially impossible, and that he wasn’t interested in AI because it would require him to learn something new. We really are a civilization in decline in the West, and our government bureaucracies promote meteorologists based on their attachment to carbon dioxide rather than their enthusiasm for accurate and skilful weather and climate forecasts. This is not the situation at all in countries like Indonesia and China where they know that carbon dioxide is mostly irrelevant.

Oscar Alves’s boss, Andrew Johnson, the current head of the Australian Bureau of Meteorology, seems to understand very little about mathematics or meteorology. At the recent Royal Commission into bushfires where Andrew Johnson was an expert witness, he commented that parts of Australia had experienced a rapid decline in rainfall. We might assume he was referring to the south-east of Australia because vast areas of Eucalyptus forest burnt in the south-east this last summer. Yet if we consider the official statistics from his own office, from the Australian Bureau of Meteorology, for this region, we see that annual rainfall is variable and that while the 1950s and 1970s were wetter than recent years – there is no evidence of long-term decline in rainfall. In fact, whichever way the statistics are scrutinised, there is no evidence for a decline in rainfall – in the south-east of Australia, for the summer period, or even considering the data for all of Australia for all months since 1900. This is explained by me in chapter 15, that is about the history of bushfires in Australia since 1851.

In his testimony to the recent Royal Commission on the devastating bushfires Andrew Johnson, the head of The Australian Bureau claimed rainfall was in decline. The data does not support this contention. When Josh Frydenberg was the Minister responsible for the Bureau he asked Andrew Johnson to meet with me. I tried to set-up several meetings with Andrew Johnson, but he was always unavailable.

My best friend from school, Catherine, has spent her entire career teaching kids mathematics. She was staying with me here in Noosa recently and it got me thinking about the importance of not just publishing graphs, but helping people understand them.

If you have kids and grandkids it is important that you take on the responsibility of teaching mathematical literacy, and Catherine provides some tips in my last blog post.

We can’t give up on any of this. We need more children that can think critically, and scientists at the Australian Bureau of Meteorology that can-do maths and read graphs. Someone must take this up as their mission, to put a broom through the current team there that are dangerously incompetent.

I would like to thank John Roskam at the Institute of Public Affairs (IPA) for conceiving the Climate Change the Facts series and having confidence in me to edit this fourth book in the series. I would like to thank everyone who donated to the book! It meant that I did have the necessary budget to pay John Castle who did such a good job to ensure that all the graphs, and charts, and illustrations, are not only colourful and fun, but also technically accurate.

You can order the book here: https://climatechangethefacts.org.au/

Also, please, if you are in Australia, then go and buy the Weekend Australian newspaper, and/or take out an online subscription then leave a comment at the end of the great article by Graham Lloyd about the book.

Graham Lloyd writes:

There is a big ‘what if’ buried at the heart of Climate Change: The Facts 2020. What if nature has a special way of using the sun, cosmic rays, water vapour and clouds to regulate the temperature of the planet. What if these processes have already been explored but too hastily dismissed? Do they deserve a closer look?

When Jennifer Marohasy sat down to conceive the latest in a series of climate change publications for the Institute of Public Affairs she was determined to remain faithful to the scientific method and be guided by past experience.

In her view, the history of science suggests you don’t actually replace a theory until you come up with another possible explanation.

“Rebuttals don’t cut it unless you have an alternative,” Marohasy says.

The result is Climate Change: The Facts 2020 which can be alternatively described as a thinking sceptic’s guide to climate.

The fourth in a high selling series by the IPA and the second edited by Marohasy, the book deals with a wide range of hot topics from bushfires to sea levels, polar bears, volcanoes and temperature records.

It brings together a wide range of Australian and international voices including polar bear specialist Susan Crockford, investigative journalist Donna Laframboise and satellite temperature measurement pioneer Roy Spencer. The book’s true ambition, however, is captured in the contributions of atmospheric physicists Richard Lindzen and Henrik Svensmark and well known Australian contrarian Peter Ridd.

Lindzen, Svensmark and Ridd each deal with some of the most contentious issues in climate change science, the role of clouds and the sun.
Rather than break new ground each presents a fresh view of established work that has proved difficult for the climate change establishment to accept.

Together, Marohasy argues, the contributions go to the core of anthropogenic climate change theory and ‘give the book longer term currency’.

According to Svensmark, since low clouds are very important for the radiative energy balance of the Earth — by reflecting incoming radiation back to space and in this way casting a shadow — they can cool the Earth’s atmosphere.

He argues it is changes in cosmic-ray flux modulated by the sun and the position of our solar system relative to exploding stars in other galaxies that will drive this. There is no role for carbon dioxide in Svensmark’s theory of climate change.

His leads to the conclusion that a microphysical mechanism involving cosmic rays and clouds is operating in the Earth’s atmosphere, and that this mechanism has the potential to explain a significant part of the observed climate variability over the history of the Earth.

Ridd revisits the pioneering work of Joanne Simpson, who studied cloud formation and tropical thunderstorms, and how they could result in tremendous amounts of energy transfer from the Earth’s surface to the top of the troposphere — where it can be radiated into space.
Simpson is a legend in the meteorological community of the US. She was awarded the American Meteorological Society’s 1983 Carl-Gustav Rossby Research Medal — the highest award in atmospheric sciences. But her climate change theory is not included in the dominant view or models. Ridd builds on the mathematics laid out by Simpson and Herbert Riehl back in 1958 and likens the process to the pistons in a car engine. His punchline is that this huge atmospheric engine helps cool the surface atmosphere.

Applying some mathematics, Ridd shows that more greenhouse gases in the lower atmosphere can make the heat engine more powerful. In short, Ridd demonstrates that with increasing greenhouse gas concentrations in the lower atmosphere, air temperatures can increase and thus raise the water vapour content of the air if this occurs over tropical oceans.
Ridd calculates that for every 1C rise in tropical temperature, the heat transfer by the convection pathway will increase by 10 per cent.

Lindzen, meanwhile, has focused his research on high altitude cirrus clouds and their heating effect on the environment because they reflect infra-red radiation back to Earth. Lindzen makes the analogy with the pupils in our eyes changing size relative to how bright or dim the light is.

Specifically, Lindzen has hypothesised that as the atmosphere warms from increasing concentrations of greenhouse gases, the area of cirrus cloud decreases, providing a negative feedback as more infra-red radiation is able to escape into space.

Both Lindzen and Ridd hypothesise that there are cloud-related negative feedback loops in place that will mitigate the potential effects of increasing concentrations of greenhouse gases on Earth’s temperature.

Neither of them deny the potential for greenhouse gases, especially water vapour and CO2, to warm the Earth. Rather they explain that because of the complexity of the physical processes at work, in particular, and the role clouds play in facilitating negative (cooling) feedbacks, the Earth is unlikely to overheat.

The ideas presented in the book are complex and counter intuitive to the dominant narrative of a world hurtling towards climate catastrophe because of carbon dioxide. And for this Marohasy is unapologetic.

‘We live at a time when climate change is deemed a morally important issue,’ Marohasy says.

It is claimed that greenhouse gases from the burning of fossil fuels are causing unprecedented and potentially catastrophic warming of the Earth’s atmosphere, she argues.

‘Those who disagree with this claim, or who ask for more evidence, are generally labelled “deniers” of climate change,’ Marohasy says.

‘In reality, the dispute is not whether the climate changes; it is what causes the change (could it be mostly natural rather than human-caused), and whether the current rate and magnitude of change is unusual.’

The book is a two-finger salute to what US president Dwight Eisenhower might have called ‘the climate–industrial complex’. In his farewell address, in a television broadcast on January 17, 1961, Eisenhower warned about the dominance, or the ‘capturing’, of science- based public policy by what he called a “scientific–technological elite”.

Marohasy argues it is this same elite who have dictated climate-change policies for some decades now, with wide-ranging economic implications.

‘Many people may prefer their “facts” to be short and to the point,’ Marohasy says in the book’s introductory chapter.

‘But climate science is complicated and, despite the considerable expenditure on research, our understanding of the atmosphere is far from complete.’

Marohasy says she has no doubt that if we had a properly constructed theory of climate, scientists would be able to better forecast droughts, floods and bushfires. There would be less fear of catastrophic sea-level rise, and more curiosity rather than despair when it comes to polar bears and penguins.

Log on, and read the article by Graham, ’tis here.

Peter Ridd and me, just south of Bowen in August 2019. The other side of the mudflat are all the corals that Terry Hughes couldn’t find. More here:https://jennifermarohasy.com.dev.internet-thinking.com.au/2019/05/corals-other-side-of-mud-flat/

Filed Under: Information, News, Physics

Heron Island Corals: Still Constrained by Sea Level Fall

August 20, 2019 By jennifer

MY mother lived and worked on Heron Island at the Great Barrier Reef in 1955. That was the same year the young Bob Endean established the University of Queensland Heron Island Research Station. He went on to become a famous marine biologist, and instrumental in the formation of the Great Barrier Reef Marine Park Authority (GBRMPA) in 1975.

There are photographs of my mother, then Joan Edith Pearce, standing knee deep surrounded by Porites coral micro atolls that are stunted and bleached. I showed one of these at my talk entitled ‘Climate Change Concern’ at the Maroochydore Surf Life Saving Club on 14th July. This has now been made into a YouTube:

The growth of corals back in 1955 at Heron Island was constrained by their inability to continue to grow-up, because sea levels were not rising. This continues to be the situation today — despite what you might to be told on the nightly news.

In fact, a peer-reviewed technical paper by L. Scopelitis et al. published in the journal ‘Coral Reef’ (2011) and rather curiously entitled ‘Coral colonisation of a shallow reef flat in response to rising sea level: quantification from 35 years of remote sensing data at Heron Island, Australia’ explains that the period 2002 to 2007 has been the most constrained for Heron Island corals since at least 1940. This is apparently because they have reached their vertical limit for growth, and there has been no sea level rise.

The single biggest threat to the Great Barrier Reef is sea level fall. Sea levels did fall some 30 centimetres during the recent super El Nino event of 2015/2016 as I explain in the YouTube presentation.

This is not a large amount considering that the tidal range at Heron Island on any one day can be anything from 1 to 3 metres.

But 30 centimetres is enough to result in bleaching of the top 30 centimetres of a coral that may be subject to sunshine on the exposed reef flat for perhaps an hour.

Heron Island is a coral cay that formed perhaps 6,000 years ago, perhaps following a violent storm when a large pile of coral rubble and broken shells was left above the high tide mark. It has grown since then.

The incident of bleaching due to low sea levels associated with El Nino events has been documented at other Great Barrier Reef islands back 3,000 years by Helen McGregor at Wollongong University.

I’m specifically thinking of her paper entitled ‘Coral micro atoll reconstructions of El Nino-Southern Oscillation: New windows on seasonal and inter annual processes’, which was published in the journal ‘Past Global Changes’ (volume 21) in 2013. By dissecting micro-atolls — the type shown in the picture of my mother at Heron Island back in 1955 — it is possible to understand that sea level has been a constraint to coral growth at the Great Barrier reef for at least this long: at least 3,000 years.

The distinctive micro-atoll form is a result of continual exposure to heat and sunlight at extremely low tides, which result, of course, in low sea levels.

****

I’m leaving Noosa tomorrow for the Great Barrier Reef. If you would like to be updated on my work there — with a drone pilot and underwater photographer — considering subscribing for my irregular email updates:https://jennifermarohasy.com.dev.internet-thinking.com.au/subscribe/

Filed Under: Information, News Tagged With: Great Barrier Reef, sea level change

Peter Ridd Has Won – Because of You

April 16, 2019 By jennifer

PETER Ridd was a professor at James Cook University who dared to question claims that the Great Barrier Reef is facing imminent catastrophe from climate change – eventually being sacked for not backing down.

With your support he has insisted:
1. That the university undertake some quality assurance of its research, and
2. Refused to be censored, for continuing to speak out.

The case has dragged on with a three-day hearing in the Federal Court in Brisbane just last month. When the hearing wrapped up the presiding Judge Salvadore Vasta said he hoped to have a judgement before Easter.

We were expecting some notice before this judgement was read in court. There was no notice, it happened this morning – and Peter Ridd has won on all counts!

The Court ordered that:
1. The 17 findings made by the University, the two speech directions, the five confidentiality directions, the no satire direction, the censure and the final censure given by the University and the termination of employment of Professor Ridd by the University were all unlawful.
2. The issue of the making of declarations and penalty are adjourned to a date to be fixed.

It is very significant that he has won on the issue of academic freedom: that he did have a right to ignore the university administrators and continuing to speak out about the lack of quality assurance and also against the disciplinary process he was being unfairly subjected to.

This is important news!

A clown fish at the Great Barrier Reef, photo taken in April 2005 off Cairns.

The university may have already spent over $1 million in legal fees attempting to silence Peter.

They have assumed that sooner or later he would run out of money … and courage. But not Peter, with his legal team and your support he has kept going.

I have known several good professors lose their will to fight once they are isolated, and risk bankruptcy.

Taking this fight to the Federal Court would not have been possible were it not for Peter Ridd deciding to take a stand in defense of the truth, to not back down regardless of the consequences.

Cheryl Ridd has been a rock, in support of Peter and the ugliness that goes with such court cases, including the unfair and untrue affaidavids.

John Roskam from the IPA found Peter the very best legal counsel in Stuart Wood QC.

We then went into fundraising mode – twice. The first time to fight the censure, and the second time for Peter to get his job back.

Bloggers Anthony Watts, Joanne Nova, and also Benny Peiser were terrific. Together we raised $260,000 from 2,405 people.

Today’s judgement is only that Peter Ridd was wrongly sacked from his position as professor at the university. He has not yet got his job back. There has been no ruling yet on remedies and restitutions. Further, the university may yet appeal.

Thank you for your support – so far.

Peter Ridd and Jennifer Marohasy speaking about the need for quality assurance in science in Sydney in February 2018.

Filed Under: News Tagged With: Peter Ridd

New Drought Report: Consistently Dishonest, Consistently Misleading

April 16, 2019 By jennifer

DROUGHT is cruel. The farmer doesn’t know when it is going to end, how much longer they will need to keep feeding their livestock, and how much longer they must wait until they can plant a crop.

If the Australian Bureau of Meteorology were useful, they would provide a reliable long-term rainfall forecast. But they can’t – the Bureau’s three month seasonal, and longer rainfall forecasts, show no skill at forecasting. It is one thing never to admit such incompetence, but they are also being dishonest about the real state of the climate.

Their most recent drought report is replete with colored maps suggesting that it is getting drier and drier … and rainfall trends are variously described as “downwards”. This is not so.

Fig. 1. The bureau’s latest drought report shows colored maps, not time series charts – yet in the text there are claims of downward trends.

A colored map doesn’t necessarily provide any useful information about trend. The maps in the Bureau’s new drought report are simplistic depictions of points in time – relative to arbitrarily defined intervals in the past when it was wetter. The maps are colored red, suggesting danger. This is more propaganda from the behemoth.

The latest drought report focuses on eastern Australia, and particularly the Murray Darling Basin.

In reality the second half of the twentieth century was consistently wetter than the first half in this region of south eastern Australia. And while the last year has been desperately dry for farmers, it is not exceptionally dry considering the last 100 years of data – such statistics are obvious when annual rainfall is plotted from 1900 as a time series chart, as shown in Figure 2.

Fig. 2. This chart shows how much rain has fallen each year since 1900, as an annual average for the Murray Darling Basin region. Such a chart provides some idea of change over time, which gives an idea of the trend.

The bureau consistently refuses to provide the available data in this form.

In the most recent report, they bemoan specific seasons and time intervals as being more intense and/or more severe in rainfall deficit. But if we are to cherry-pick, then why not consider how exceptionally wet it was in September 2016, as shown in Figure 3?

Fig. 3. When rainfall is considered on the basis of just one month, specifically, September, it is apparent that 2016 was exceptionally wet. Why was it exceptionally wet in September 2016?

Of course, the Bureau is run by “Science Managers” wedded to the theory of catastrophic anthropogenic global warming – so they only show intervals when it is drier than average consistent with their theory that Australia will experience below average rainfall because of elevated levels of carbon dioxide. They show no curiosity when it comes to exceptionally wet periods in the recent record.

The managers at the Bureau are consistently dishonest in how they present the data, and the conclusions that they draw from it.

It is also fake news for the Bureau to claim that the drought is “exacerbated by record high temperatures” – and repeat that this last summer (2018-19) was Australia’s hottest. Considering the last 100 years, the hottest summer in the Murray-Darling Basin was probably the summer of 1938-39. In rural Victoria, the summer of 1938-1939 was on average at least two degrees hotter than anything measured with equivalent equipment since, as shown in Figure 4.

Fig. 4. It is possible to rank time intervals in different ways … by day, month, summer, year etcetera. Considering ‘summer’ as the three months of December, January and February then the summer of 1938-1939 was probably hotter than any other summer since records began.

The Bureau now measures temperatures as spot one-second readings from custom built electronic probes with unknown time constants*. So, there is no way of knowing how hot it was last summer relative to the very hot summers of say 1938-39, when temperatures were measured with mercury thermometers.

The use of electronic probes without averaging will give higher temperatures for the same weather, as I explain in a letter to the Chief Scientist.

_______________

*Some explanation of time constants, and why averaging is so important is included in three blog posts, with links following …

1. Explanation with worked theoretical examples

https://jennifermarohasy.com.dev.internet-thinking.com.au/2017/10/averaging-convention-not/

“The sensors can respond much more quickly to changes in temperature, and on a hot day, the air is warmed by turbulent streams of ground-heated air that can fluctuate by more than 2 degrees on a scale of seconds. So, if the Bureau simply changed from mercury thermometers to electronic sensors, it could increase the daily range of temperatures, and potentially even generate record hot days simply because of the faster response time of the sensors.

Except to ensure consistency with measurements from mercury thermometers there is an international literature, and international standards, that specify how spot-readings from sensors need to be averaged – a literature and methodology being ignored by the Bureau.

To be clear, the UK Met office takes 60 x 1 second samples each minute from its sensors, and then averages these. In the US, they have decided this is too short a period, and the standard there is to average over a fixed 5-minute period. In Australia, however, the Bureau takes not five-minute averages, nor even one-minute averages, but just one second spot-readings.

Check temperatures at the ‘latest observations’ page at the Bureau’s website and you would assume the value had been averaged over perhaps 10 minutes. But it is dangerous to assume anything when it comes to our Bureau. The values listed at the ‘observations’ page actually represent the last second of the last minute. The daily maximum (which you can find at a different page) is the highest one-second reading for the previous 24-hour period: a spot one-second reading in contravention of every international standard. There is absolutely no averaging.

Then again, how many of you knew that the mean daily temperature as reported by meteorological offices around the world is not an average of temperatures recorded through the day and night but rather the highest and the lowest divided by two – as is the convention?

This convention developed because (surface) temperature measurements were originally instantaneous measurements from mercury thermometers recorded manually each morning (providing the minima) and afternoon (providing the maxima).

So, in the UK the daily maximum from a weather station with an electronic sensor will be the highest value derived from the averaging of 60 samples over that one-minute interval, while in Australia, the daily maximum will be the highest one-second spot reading.

2. Explanation in context of record temperatures at Mildura, explaining how first probe recorded cooler than mercury thermometer

https://jennifermarohasy.com.dev.internet-thinking.com.au/2017/11/law-unto-australian-bureau-meteorology/

“The Bureau have since acknowledged that their method of recording temperatures from electronic sensors is not accredited, though they claim it nevertheless gives readings equivalent to mercury thermometers. Interestingly, your office emailed a journalist, backing them up – claiming that a single electronic sensor can “mirror the behaviour of liquid in glass thermometers”. This is nonsense, because mercury and alcohol thermometers have different time constants. This is one reason the World Meteorological Organisation (WMO) insist on numerical averaging: alcohol thermometers (that measure temperature minima) have longer time constants than mercury thermometers (that measure temperature maxima).

3. Explanation in context of Mildura, how next/current probe records consistently warmer than a mercury thermometer

https://jennifermarohasy.com.dev.internet-thinking.com.au/2018/02/bom-blast-dubious-record-hot-day/

“Considering days when there is parallel data available in the temperature band of interest (the claimed-record hot day in September 2017 measured 37.7 degrees Celsius) the new probe has been found to measure up to 0.4 degrees hotter (e.g. 26 February 2013 the recording for the probe is 37.3, while the mercury thermometer recorded 36.9 on the A8 form) …

Filed Under: Information, News Tagged With: Drought

  • Go to page 1
  • Go to page 2
  • Go to page 3
  • Interim pages omitted …
  • Go to page 133
  • Go to Next Page »

Primary Sidebar

Recent Comments

  • Ian Thomson on Vax-ed as Sick as Unvax-ed, Amongst My Friends
  • Dave Ross on Vax-ed as Sick as Unvax-ed, Amongst My Friends
  • Dave Ross on Vax-ed as Sick as Unvax-ed, Amongst My Friends
  • Alex on Incarceration Nation: Frightened of Ivermectin, and Dihydrogen monoxide
  • Wilhelm Grimm III on Incarceration Nation: Frightened of Ivermectin, and Dihydrogen monoxide

Subscribe For News Updates

  • This field is for validation purposes and should be left unchanged.

November 2025
M T W T F S S
 12
3456789
10111213141516
17181920212223
24252627282930
« Jan    

Archives

Footer

About Me

Jennifer Marohasy Jennifer Marohasy BSc PhD has worked in industry and government. She is currently researching a novel technique for long-range weather forecasting funded by the B. Macfie Family Foundation. Read more

Subscribe For News Updates

Subscribe Me

Contact Me

To get in touch with Jennifer call 0418873222 or international call +61418873222.

Email: jennifermarohasy at gmail.com

Connect With Me

  • Facebook
  • LinkedIn
  • RSS
  • Twitter
  • YouTube

Copyright © 2014 - 2018 Jennifer Marohasy. All rights reserved. | Legal

Website by 46digital