• Skip to primary navigation
  • Skip to main content
  • Skip to primary sidebar
  • Skip to footer
Jennifer Marohasy

Jennifer Marohasy

a forum for the discussion of issues concerning the natural environment

  • Home
  • About
  • Publications
  • Speaker
  • Blog
  • Temperatures
  • Coral Reefs
  • Contact
  • Subscribe

Information

Save Lady Elliot, Set AirCon to 25 Degrees

February 1, 2014 By jennifer

Dear Jennifer, I had a holiday on Lady Elliot Island in October 2013 and while there took the attached photos with the idea that I might send the one of the climate change sign to an Australian blog as an example of Federal Government alarmist propaganda.

Lately the tide seems to be turning against the CO2 global warming scam with the Akademik Shokalskiy debacle in the Antarctic, record polar sea ice totals, the circumpolar vortex in the northern hemisphere and Tom Switzer’s article in the Sydney Morning Herald. However with the heat waves lately in Australia the warmists are fighting back with the usual dodgy forecast heat records which are very seldom reached but most people don’t question them. I commend you for your open letter to the BOM requesting verification of the 2013 temperature record.Lady Elliot

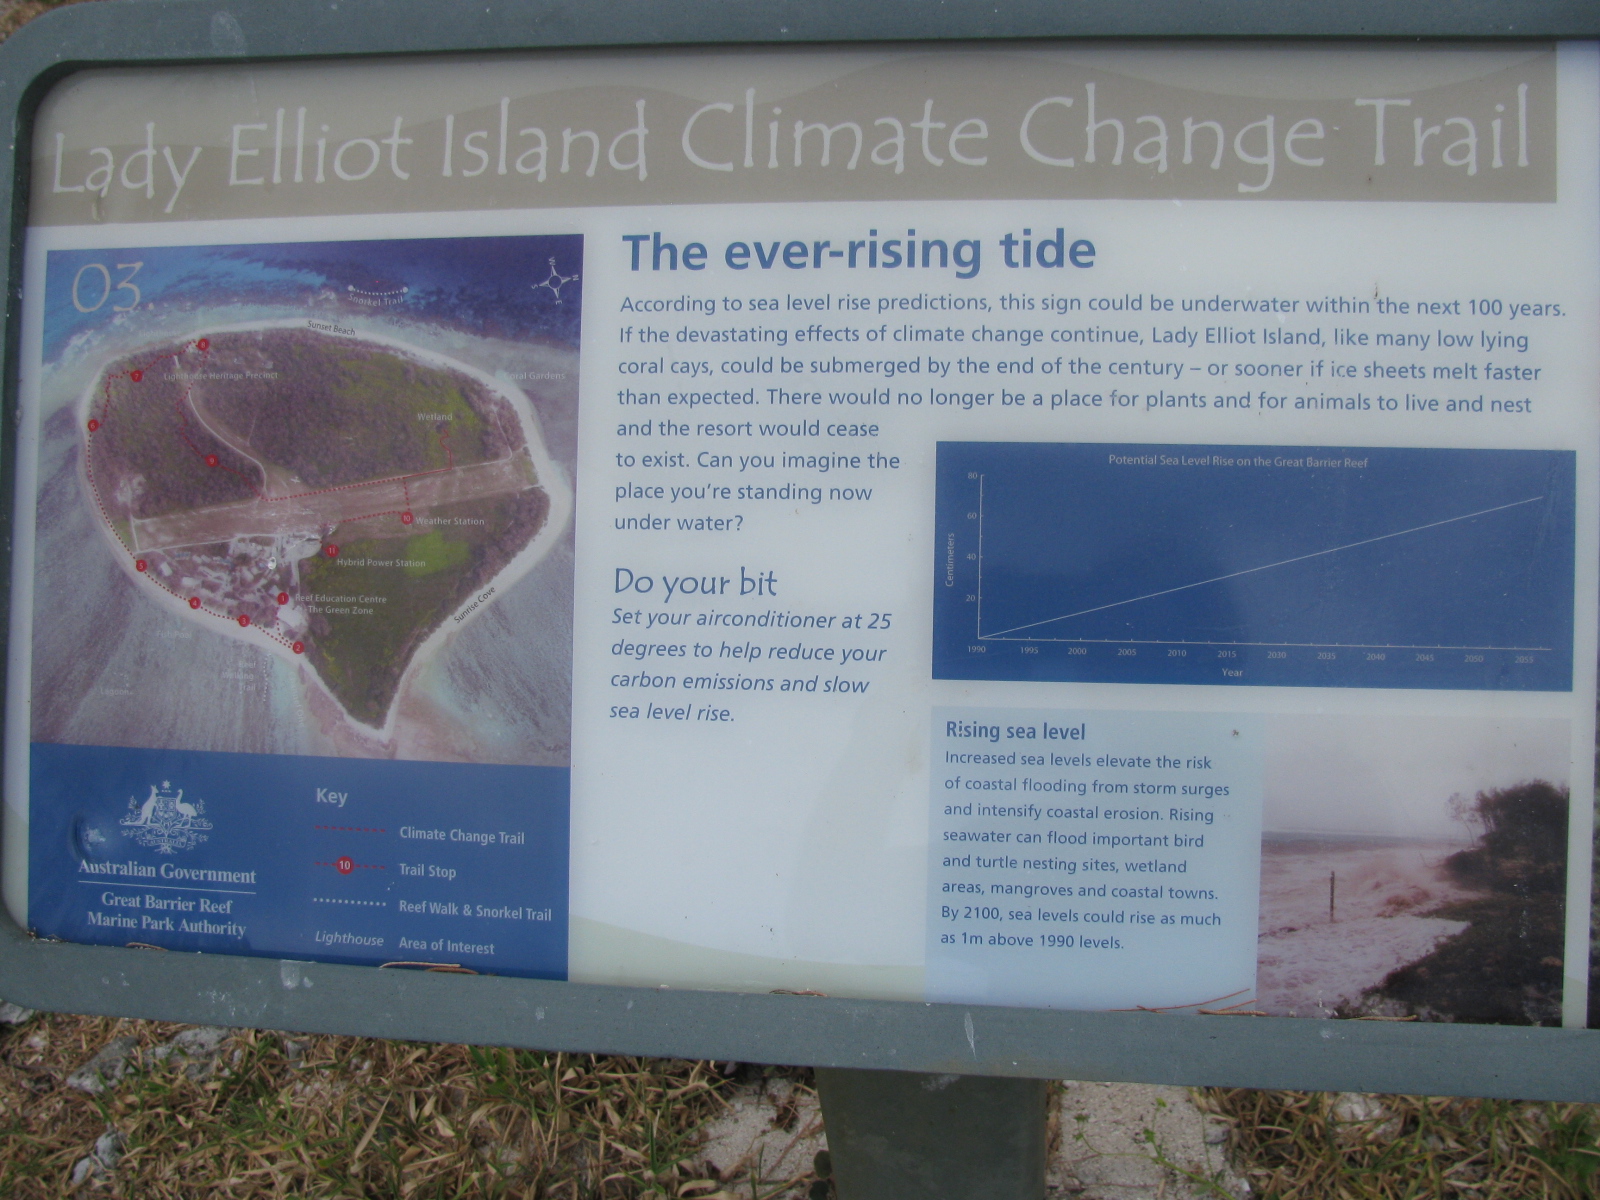
I had another look at this photo of the sign today to work out again how much sea level rise they showed in the graph from 1990 to 2013 and it scaled about 300mm or 13.04mm/year. As another check I scaled the 600mm rise over 57.5 years and only got 10.43mm/year which seemed extremely odd, (I’m a retired land surveyor used to working with graphs).

On further inspection I finally noticed that the 5 year intervals on the x axis read 2010, 2015 then jumped 15 years to 2030 and back to 5 year intervals from 2035 to 2055 which explained the yearly rise difference. The sign writer obviously made a booboo or the original information he was given was wrong. Either way the error should have been corrected before the sign was released for public viewing. The nearest National Tide Centre Gauge at Rosslyn Bay shows a rise of about 2.8mm/year and has only operated since 1993 so the 13mm/year rise on the graph is ridiculous.

As the Great Barrier Reef is in your bailiwick I thought you might be interested in publicising the gross errors on this “way over the top” sign and I assume that a similar one is also on most of the other islands controlled by the GBR Marine Park Authority but you will probably be able to find this out easier than I can. The 03 in the top left corner may be its sign number.

Regards
Sel Hopley

Click on the image for a larger and better view of the entire photograph including the how to save the Island by setting your air con at 25 degrees celsius.

Filed Under: Information Tagged With: sea level change

Open Thread

January 29, 2014 By jennifer

I’ve been asked to open a new thread. So, why not introduce a new topic? I really like goat’s cheese, and especially Meredith Dairy goat cheese. Meredith Dairy Goat Cheese
This is an unsolicited advertisement for one of my favourite foods.

Filed Under: Information

Bureau Confirms Calculating Australia’s ‘Average’ Temperature Involves Some Hocus-pocus

January 28, 2014 By jennifer

THE Australian Bureau of Meteorology, BOM, doesn’t have a set of temperature thermometers regularly positioned across the landmass of Australia from which it might derive an average annual temperature. Rather many more of it’s approximately 750 temperature recording stations are in south eastern Australia, some have records that date back to the 1850s, while others only started recording last year.
How do you derive an average annual temperature for Australia from such a mix of measurements? Screen Shot 2014-01-28 at 3.52.51 PM

The Bureau’s solution is to select a subset of about 112 stations from the 750. Some of the stations in the subset started recording temperatures in the 1850s, others not until the 1960s. Then the bureau truncates the longer temperature records, in some cases by discarding over 50 years of data, indeed everything before the somewhat arbitrary date of 1910. Data before this date is not considered reliable, but then the Bureau applies corrections to some of the rest of the data even though it should be reliable. Then the adjusted and truncated values from the subset are fitted to a grid to generate an area-weighted average of the data.

There is no single document that describes this methodology. Rather in a letter from the Bureau dated 24th January, responding to my request for information, I was directed to a mix of Bureau reports, peer-reviewed papers and also a PhD thesis by way of justification, methodology and for a list of stations.

In short, there is no straightforward way to verify the claim that last year, 2013, was the hottest calendar year on record. This is the claim the Bureau made in a media release on 3rd January 2014.

When individual stations with long temperature records are examined the late 1890 and 1930s appear to be as hot as recent years.

Ever since Climategate, deeply disturbing questions have been asked about the way climate science is conducted and also the state of the climate data. The Australian Bureau of Meteorology’s own databases feature in the leaked emails with the infamous ‘Harry Read Me’ file complaining about jumbled values and incorrect start dates for particular stations.

The mainstream climate science community has a vested interest in the average temperature for Australia increasing year-on-year because it has embraced the theory of anthropogenic global warming and invested heavily in research that assumes this theory.

It is time that the Bureau was more transparent in how it calculated its average annual values, and that it developed a method for benchmarking these annual average values. The benchmarking could be against satellite data and also against individual stations in Australia for which there are long temperature records.

**************

Click here to download the Bureau’s reply to my letter of 9th January requesting information to enable verification of the claim that 2013 was the hottest year on record.

Click on the image to see a chart of the Bureau’s annual mean temperature anomaly for Australia, this value is derived from the annual mean.

Filed Under: Information Tagged With: Temperatures

Shark Baiting Already a Reality in Queensland

January 25, 2014 By jennifer

THERE has been much commotion in the Australian media about the Western Australian government’s plans to introduce drum lines to cull an increasing shark population.

While the ABC has been interviewing experts from around the world about the potential impact of this program on shark populations, I’m yet to hear any mention of the current program that has been in place for decades now off the east coast of Australia.

Indeed just off Lammermoor Beach, near where I live some of the time in central Queensland, you can see yellow plastic floats. They are attached to chains with large hooks and fresh meat designed to lure and kill sharks. yellow float with text

The local paper proudly announces the kill at the end of each year. A total of 111 sharks were caught off the combined Capricorn Coast beaches of central Queensland in 2013. The breakdown is as follows:
43 bull whalers
23 long-nose whalers
18 tiger sharks
12 blacktip reef whalers
9 spot-tail whalers
3 great hammerheads
2 sandbar whalers
1 bronze whaler

I often walk along Lammermoor Beach but I don’t much swim there. I find the yellow plastic floats off-putting, along with the stingers, stingrays, and I worry about encountering a wandering crocodile. In fact very few people swim at Lammermoor beach so I wonder why they even bother with the baiting program?

The history of the Queensland program is detailed here:

“The Queensland (QLD) Shark Control Program was introduced to the Gold Coast, Sunshine Coast and Cairns in 1962 and was extended to include Townsville and Mackay in 1963. Since then, the Program has been extended to include Rockhampton (Capricorn Coast) (1969), Bundaberg (1973), Rainbow Beach (1974), Tannum Sands (1983) and Point Lookout (1984) (QLD DPI, 2003). There have been frequent changes to the location and configuration of shark control equipment (mesh nets and drum lines) within each of these areas since the Queensland Shark Control Program was implemented in 1962 (Anon, 1998). The most recent major change to the configuration of shark control equipment occurred in 1992 and 1993, following a review of the operation and maintenance of shark meshing equipment in Queensland (Anon, 1992). In 1992 and 1993, mesh nets were replaced with drum lines in many areas, in order to reduce the catch of non-target marine species, such as dugongs, dolphins and whales.

In Queensland, mesh nets and/or drum lines are currently used on 84 beaches, within 10 districts (known as contract areas). The Queensland Government reports that a total of 338 drum lines are deployed across the 10 contract areas and a total of 37 mesh nets are deployed across 5 contract areas (Cairns, Mackay, Rainbow Beach, Sunshine Coast and Gold Coast). Nets are replaced with drum lines during whale migration and turtle seasons in some areas (Anon, 1998). In Queensland, shark control equipment remains in the water the entire year round, except in Cairns and Rockhampton (Capricorn Coast) where equipment is seasonally removed (Anon,1998; Queensland Shark Control Program). Each piece of equipment used in the Shark Control Program is serviced every second day, weather permitting (QLD DPI, 2003). Regular servicing of equipment means that non-target marine species caught on shark control equipment are more likely to be released alive.”

***
Picture of Lammermoor beach with yellow float taken sometime over the last year.

Filed Under: Information Tagged With: Fishing

Bushfires Rage Because Whitefellas Don’t Know How to Manage The Australian Landscape

January 18, 2014 By jennifer

SO much of Australia is needlessly and brutally incinerated every summer. News reports focus on homes and lives and the brave fire crews. But, what about the native fauna and flora? It wasn’t always this way, and it shouldn’t be so. As West Australian David Ward explains…

“BEFORE Europeans arrived, Noongar people managed our south-west dry forests and woodlands very well without fire trucks, water bombers, helicopters, television journalists, concerned politicians, the Conservation Council, hundreds of firefighters, or the Salvation Army to give them all breakfast. They did this by burning frequently, in most places as often as it would carry a mild, creeping fire.

Even where there were no Noongars, most of the bush would have burnt frequently by unimpeded lightning fires, trickling on for months. Such large lightning fires continued up to the 1920s, before there were any Bushfire Brigades. They could travel a hundred kilometres before autumn rain doused them. Most of the landscape would have burnt as often as it could carry a fire. Fire suppression and exclusion are unnatural, new fangled notions.

Frequent fire made the bush safe, and promoted grass for yonka (kangaroo), and a host of bush tucker plants. It produced byoo, the red fruit of the djiridji, or zamia. Frequent light smoke germinated seeds, and provoked flowering of kangaroo paws and balga grass trees.

Kangaroo paws and byoo are increasingly rare, under a muddle headed advocacy which claims that we should exclude fire from large bush areas for long periods. This phoney idea makes the bush very dangerous, as we have recently seen. Fire cannot be excluded indefinitely, and the longer it has been absent, the fiercer, and more damaging it will be.Zamia

Ecomythologists claim that, left alone, the litter will all rot down to enrich the soil. The truth, as any Perth Hills resident will testify, is that there is some decay in winter, but the summer blizzard of dead leaves, bark, and capsules is far greater, so litter builds up. After twenty years or so, there is a mulching effect, and build up ceases. However, by then most wildflowers are smothered and straggly, and most of the nutrient is locked up in dead matter. Frequent, mild fire releases the nutrients, sweetens the soil, and prunes the plants. Gardeners will appreciate that.

In the 1840s, the early West Australian botanist James Drummond wrote, “When I was a sojourner in England, I never remember to have seen Australian plants in a good state after the second or third years and that, I think, is in a great degree owing to their not being cut down close to the ground when they begin to get ragged; how for the pruning knife and a mixture of wood ashes in the soil would answer as a substitute to the triennial or quaternal burnings they undergo in their native land, I am unable to say, some of our plants never flower in perfection but the season after the ground is burned over…”

There are many historical references to frequent, widespread burning by south-west Noongars. In 1837 Lt. Henry Bunbury mentioned “…the periodical extensive bush fires which, by destroying every two to three years the dead leaves, plants, sticks, fallen timber etc. prevent most effectually the accumulation of any decayed vegetable deposit… being the last month of summer… the Natives have burnt with fire much of the country… ”

In 1975 Mr. Frank Thompson was interviewed about his memories of fire near the south coast, before the First World War. He said “You see, the Natives …they used to burn the country every three or four years… when it was burnt the grass grew and it was nice and fresh and the possums had something to live on and the kangaroos had something to live on and the wallabies and the tamars and boodie rat …It didn’t burn very fast because it was only grass and a few leaves here and there and it would burn ahead and… sometimes there’d be a little isolated patch of other stuff that wasn’t good enough to burn the time before, but as it burnt along perhaps there might be some wallabies or tamers. Those animals didn’t run away from fire, they’d run up to it and you’d see them hopping along the edge of the fire until they saw a place where the fire wasn’t burning very fierce…”

It is hard to imagine wallabies hopping along the flame front of the recent Karagullen fire, looking for a way through. Long fire exclusion is causing fires of unprecedented ferocity, and many avoidable wildlife deaths. The longer fire has been excluded, the longer the bush takes to recover when it is eventually, and inevitably, burnt.

Over the last decade, research in south-western Australia by the Department of Conservation & Land Management (CALM) and Curtin University into fire marks on hundreds of balga grasstrees has confirmed traditional two to four year fire in dry eucalypt areas. Ridges with pure jarrah burnt every three to four years, slopes with some marri every two to three years, and clay valleys with wandoo every two years. There would have been thousands of small refuges, in rocks or near creeks, which would have burnt less often, perhaps never. Recent fierce fires destroy these, and the fire sensitive plants they protect. The ecomythology of long fire exclusion over large areas, is destroying the very plants and animals it claims to care for. Equally guilty are those ‘talking heads’ in politics, and the news media, who unthinkingly promote ecomythology.

The oldest balga records go back to 1750, and show traditional frequent, mild fire until measles epidemics killed many Noongars in 1860, and 1883. In some places two to four year burning continued until the First World War. In others, it continued up to the 1930s, and even the 1950s. Some old Perth Hills families remember when any fire could be put out with wet bags or green branches. This is only possible when fires are in litter no more than four years old, with flames less than a metre high.

Far from destroying diversity, this frequent burning enhanced it, by creating a rich mosaic of different aged patches. Animals had both food and shelter, and wildflowers flourished. Today’s muddle headed blanket fire exclusion leads to an eventual single, blanket, fierce fire, which simplifies the ecosystem down to a single age.

By insisting, through our political representatives, that CALM burn the bush more often, and more patchily, we will make it safer, see more wildflowers, avoid most animal deaths, and avoid dense, choking smoke from fierce wildfires. We will have to live with occasional light smoke from prescribed burns. If most litter were less than five years old, smoke would be minimal, and arson would be futile. All it could cause would be a mild, creeping fire, which would benefit the bush.

Think of the savings and benefits by working with nature, instead of fighting it. No more squadrons of aircraft, anxious home owners, and choking smoke for a week or more. The police could get on with catching burglars. More young Noongar people should be employed by CALM to help manage the bush with fire, restoring their culture and healing their self esteem.”[1]

Since David Ward shared that article with us in April 2005, historian Bill Gammage has published his book ‘The Biggest Estate on Earth’ in which he explains in more detail how the South West of WA was managed intensively and systematically through fire-stick farming and that a similar philosophy once extended to the management of the entire Australian continent.

According to Mr Gammage the aboriginal religious philosophy of totems basically meant that all things were responsible for others of its totem and their habitat. So, emu people must care for emus and emu habitat, and emus must care for them. The entire continent was managed under the same aboriginal law for similar biodiversity purposes; hence the idea of Australia being essentially managed as one big estate.

Indeed for indigenous Australians wilderness offered no cause for fond nostalgia, it represented a tract of land without custodians.

****
1. Noongars Knew Best by David Ward was first published at https://jennifermarohasy.com.dev.internet-thinking.com.au/2005/06/noongars-knew-best/

The image is of a Zamia palm with ripe fruit.

Filed Under: Information Tagged With: Bushfires

Open Letter Requesting Verification of 2013 Temperature Record

January 9, 2014 By jennifer

Dr David JonesSunset Neil Hewitt
Manager of Climate Monitoring and Predictions
Australian Bureau of Meteorology

Dear Dr Jones

Re: Request Verification of 2013 Temperature Record

I am writing to request information be made publicly available to myself and others so we may have the opportunity to verify the claim made by you on behalf of the Australian Bureau of Meteorology that 2013 was the hottest year on record in Australia. In particular it is claimed that the average temperature was 1.20°C above the long-term average of 21.8°C, breaking the previous record set in 2005 by 0.17°C.

This claim is being extensively quoted, including in a report authored by Professor Will Steffen of the Climate Council, where he calls for the Australian government to commit to further deep reductions in greenhouse gas emissions because of this “record-breaking year”. Accurate climate records are not only of political interest, but are also of importance to those of us who rely on historical temperature data for research purposes. For example, the skill of the medium-term rainfall forecasts detailed in my recent peer-reviewed publications with John Abbot, have been influenced by the reliability of the historical temperature data that we inputted. From a very practical perspective, businesses will adjust their plans and operations based on climate data, and ordinary Australians worry and plan for the future based on anticipated climate trends.

Further, I note that you said in a radio interview on January 3, 2014, following your “hottest year on record” press release that, “We know every place across Australia is getting hotter, and very similarly almost every place on this planet. So, you know, we know it is getting hotter and we know it will continue to get hotter. It’s a reality, and something we will be living with for the rest of this century.”

The Australian Bureau of Meteorology is the custodian of an extensive data network and over a long period now, questions have been asked about the legitimacy of the methodology used to make adjustments to the raw data in the development of the Australian Climate Observations Reference Network – Surface Air Temperatures (ACORN-SAT). Furthermore, questions have been asked about why particular stations that are subject to bias through the Urban Heat Island (UHI) effect continue to be included in ACORN-SAT. In particular why is ‘Melbourne Regional Office’, a station at the corner of Victoria Parade and Latrobe Street (Melbourne CBD) still included in the ACORN-SAT network when this station is known to have become sheltered from previously cooling southerly winds following construction of office towers.

I understand ACORN-SAT was used to calculate the statistics indicating 2013 was the hottest year on record, but it is unclear specifically which stations from this network were used and how data may have been further adjusted in the development of the record breaking temperature anomaly.

Rockhampton-based blogger Ken Stewart, for example, has suggested that in the calculation of the annual average temperature for Australia, the eight sites acknowledged as having anomalous warming due to the UHI would not have been included. Is this the case? I had assumed that the Bureau used all 112 ACORN-SAT locations, and thus that the record hot temperature anomaly announced by you, actually includes a UHI bias.

Radio presenter Michael Smith has given some publicity to claims made by blogger Samuel Gordon-Stewart that the Bureau has overestimated the average Australian temperature by about 4 degrees. Mr Gordon-Stewart calculated average temperatures and temperature anomalies from data from all the weather stations listed by Weatherzone.

Furthermore, given many ACORN-SAT stations have continuous temperature records extending back to the mid-late 1800s and many stations were fitted with Stevenson screens by 1900, why does the Bureau only use data after 1909, all the while claiming that 2013 is the hottest year on record? Indeed it is well documented that the 1890s and early 1900s, years corresponding to the Federation drought, were exceptionally hot.

In summary, given the importance of the historical temperature record, and the claim that 2013 is the hottest year on record, could you please provide details concerning:
1. The specific stations used to calculate this statistic;
2. The specific databases and time intervals used for each of these stations;
3. The history of the use of Stevenson screens at each of these station;
4. How the yearly average temperature is defined; and
5. Clarify what if any interpolation, area weighting, and/or adjustments for UHI bias, may have been applied to the data in the calculation of the annual mean values.

Kind regards

Dr Jennifer Marohasy
Scientist, Blogger, Columnist
PO Box 692
NOOSA HEADS Q. 4567
Tel Mobile: 041 887 32 22

***
The above text was sent as an email to Dr David Jones earlier this evening. The photograph is of a sunset taken in northern Australia by Neil Hewitt of Cooper Creek Wilderness.

Filed Under: Information Tagged With: Temperatures

  • « Go to Previous Page
  • Go to page 1
  • Interim pages omitted …
  • Go to page 37
  • Go to page 38
  • Go to page 39
  • Go to page 40
  • Go to page 41
  • Interim pages omitted …
  • Go to page 71
  • Go to Next Page »

Primary Sidebar

Recent Comments

  • Ian Thomson on Vax-ed as Sick as Unvax-ed, Amongst My Friends
  • Dave Ross on Vax-ed as Sick as Unvax-ed, Amongst My Friends
  • Dave Ross on Vax-ed as Sick as Unvax-ed, Amongst My Friends
  • Alex on Incarceration Nation: Frightened of Ivermectin, and Dihydrogen monoxide
  • Wilhelm Grimm III on Incarceration Nation: Frightened of Ivermectin, and Dihydrogen monoxide

Subscribe For News Updates

  • This field is for validation purposes and should be left unchanged.

November 2025
M T W T F S S
 12
3456789
10111213141516
17181920212223
24252627282930
« Jan    

Archives

Footer

About Me

Jennifer Marohasy Jennifer Marohasy BSc PhD has worked in industry and government. She is currently researching a novel technique for long-range weather forecasting funded by the B. Macfie Family Foundation. Read more

Subscribe For News Updates

Subscribe Me

Contact Me

To get in touch with Jennifer call 0418873222 or international call +61418873222.

Email: jennifermarohasy at gmail.com

Connect With Me

  • Facebook
  • LinkedIn
  • RSS
  • Twitter
  • YouTube

Copyright © 2014 - 2018 Jennifer Marohasy. All rights reserved. | Legal

Website by 46digital