
Following is the text of a letter that I just this morning sent to Australia’s Chief Scientist, Alan Finkel…
Dear Dr Finkel,
For some years I have been asking for an open, honest and independent inquiry into the operations of the Australian Bureau of Meteorology. In 2015, I wrote to the Auditor-General of Australia suggesting a performance audit with terms of reference to include: consistency with its own policies, and reliability of methodology. At the time my primary concern was the remodelling of raw data through a process known as homogenisation.
In response, it was suggested I direct my concerns to Dr Ron Sandland AM, who at that time was chairing a Technical Advisory Forum to review these same issues, that I had previously raised with then Minister for the Environment, Hon. Greg Hunt MP. It was already clear to me that Dr Sandland and his team were undertaking a most cursory review and not working through a single example of homogenisation. I nevertheless made a submission to Dr Sandland’s Forum that has never been acknowledged.
To be clear, my issues continue to be less with the actual policies, protocols and best practice manuals already in place, but with increasing evidence these are being systematically ignored.
The one issue that I would like to bring to your immediate attention concerns the way temperatures are currently measured in automatic weather stations by electronic probes. This goes to the heart of the integrity and reliability of temperature measurements recorded by the Bureau, which are subsequently homogenised, and incorporated into international databases – including those relied upon by the United Nation’s Intergovernmental Panel on Climate Change (IPCC).
Historically maximum air temperature was measured by mercury thermometers – worldwide. But over recent decades there has been a transition to electronic probes in automatic weather stations.
There is a lot of natural variability in air temperature (particularly on hot sunny days at inland locations), which was smoothed to some extent by the inertia of mercury thermometers. In order to ensure some equivalence between measurements from mercury thermometers and electronic probes it is standard practice for the one-second readings from electronic probes to be averaged over a one-minute period – or in the case of the US National Weather Service the averaging of the one-second readings is over 5 minutes.
The Australian Bureau began the change-over to electronic probes as the primary instrument for the measurement of air temperatures in November 1996.
The original IT system for averaging the one-second readings from the electronic probes was put in place by Almos Pty Ltd, who had done similar work for the Indian, Kuwaiti, Swiss and other meteorological offices. The software in the Almos setup (running on the computer within the on-site shelter) computed the one-minute average (together with other statistics). This data was then sent to what was known as a MetConsole (the computer server software), which then displayed the data, and further processed the data into ‘Synop’, ‘Metar’, ‘Climat’ formats. This system was compliant with World Meteorological Organisation (WMO) and the International Civil Aviation Organisation (ICAO) standards. The maximum daily temperature for each location was recorded as the highest one-minute average for that day.
This was the situation until at least 2011 – I have this on good advice from a previous Bureau employee. It is likely to have been the situation through until perhaps February 2013 when Sue Barrell from the Bureau wrote to a colleague of mine, Peter Cornish, explaining that the one-second readings from the automatic weather station at Sydney Botanical Gardens were numerically-averaged. At some point over the last five years, however, this system has been disbanded. All, or most, of the automatic weather stations now stream data from the electronic probes directly to the Bureau’s own software. This could be an acceptable situation, except that the Bureau no-longer averages the one-second readings over a one-minute period.
Indeed, it could be concluded that the current system is likely to generate new record hot days for the same weather – because of the increased sensitivity of the measuring equipment and the absence of any averaging/smoothing. To be clear, the highest one-second spot reading is now recorded as the maximum temperature for that day at the 563 automatic weather stations across Australia that are measuring surface air temperatures.
This is not generally understood. Most meteorologists and university professors in Australia appear to be working from the wrong assumption that the old system is still in place. Given this data is also used by thousands of other scientists and technologists, not just in Australia but across the world, I urge you to investigate.
My investigations have included scrutiny of actual measurements from the current probe at Mildura, in north western Victoria. This data was made available to me following a directive from the Minister for the Environment, Hon Josh Frydenberg MP, to Andrew Johnson, CEO and Director of Meteorology at the Bureau. This has enabled me to confirm that the automatic weather station at Mildura is logging:
1. The last one-second reading in each one-minute period;
2. The highest one-second reading for the previous 60 seconds, and
3. The lowest one-second reading for the previous 60 seconds.
I have corresponded with the Bureau’s CEO, Andrew Johnson, about the current situation. He has assured me that because the electronic probe is housed in a metal sheath which provides thermal mass, each measurement is actually the integration of the previous 40 to 80 seconds. If this is indeed the case, that the electronic probes have been weighted, then the Bureau should perhaps just sample the lowest one-¬second and the highest one¬-second for the agreed interval? Indeed, why log a single last one-second value from each minute – particularly given the equipment is capable of averaging all seconds, or averaging a subsample of all the one-second readings?
I have requested the manufacturer’s specifications, specifically for the probe at Mildura (Rosemount ST2401 S/N – 654). Dr Johnson has not provided this information, insisting that this is not available because the probes are purpose-designed: “The Bureau purpose-designed the temperature sensors to closely mirror the behavior of mercury in glass thermometers, including the time constant. The manufacturer then manufactured the sensors to the Bureau’s design.”
There is no publicly available documentation for any of the custom-built electronic probes currently used by the Bureau to measure air temperature across Australia.
Furthermore, there are no published studies that provide any indication of the equivalence of measurements from the electronic probes with mercury thermometers, which were used to measure maximum temperatures at all weather stations until at least November 1996.
In order to assess the extent to which the Bureau’s probes actually mirror the behavior of mercury thermometers, I have requested the relevant internal reports that presumably detail the results from field and laboratory trials. These have not been provided. My husband, Dr John Abbot, has requested the same and this information is the subject of an ongoing freedom-of-information (FOI) request by him, which may yet end-up in the Administrative Appeal Tribunal.
Following two interviews I did with radio broadcaster Alan Jones last year, and at the directive of Minister Frydenberg, I was provided with some information enabling me to obtain parallel data from Mildura late last year. This was provided as thousands of photographed A8 forms with each form including hand-written daily values as recorded from the electronic probe and mercury thermometer in the same equipment shelter at Mildura.
The first years of parallel recordings onto the A8 forms (from November 1996) indicate that the electronic probe first installed at Mildura was recording temperatures that were statistically significantly cooler than the mercury thermometer. This should be of concern, as it would indicate that the extent of global warming was being under estimated – and that there was no equivalence between the electronic probes and mercury thermometers with this data incorporated into international databases.
A new probe, the current probe, was installed on 27 June 2012. This is the same probe that measured a much-acclaimed record hot day for the state of Victoria on 23 September 2017- sparking my initial interest in Mildura.
I had initially hoped that there would be parallel data to enable some verification of this record – I had been told by a whistle-blower that Mildura was a site with parallel data. I was subsequently told by Anthony Rea from the Bureau – after the directive given to the Bureau by Minister Frydenberg – that there was parallel data only available through until January 2015.
After scrutiny of the A8 forms actually provided, however, it appeared that the extent of parallel readings for the probe installed on 27 June 2012 would be limited to just the eight months July 2012 to February 2013… except that Dr Rea omitted to provide me with the data for September 2012 – the one month that could provide a direct measure of the equivalence of the relevant probe for that time of year at that location. The residual available parallel data from Mildura as measured by the current electronic probe is missing recordings from the mercury thermometer for the very hottest days as measured by the electronic probe (30 November 2012, 18 January 2013, 5 January 2013, 8 January 2013, 6 January 2013, 1 December 2013, highest to lowest).
In short, it appears that on the hottest days in Mildura – during the period that manual readings were being taken after installation of the most recent probe – no one was turning-up to take the manual reading from the mercury thermometer. As a consequence, the data for this period from the mercury thermometer is not normally distributed. This makes statistical analysis using standard techniques impossible as assumptions implicit, for example in a standard paired T-test, are violated.
The limited parallel data that I have from this probe (currently recording temperatures at Mildura) indicates that, on average, it records temperatures warmer than the mercury thermometer – often up to 0.4 degrees Celsius warmer than the mercury thermometer.
I have communicated this information to Dr Johnson, and he has replied that my sample is inadequate to conclude very much.
Exactly, and this is because the Bureau is not providing me with all the data! So, I would appreciate it if you could ask that he please make the relevant internal reports available and/or provide data from other weather stations for which there is parallel data to enable some proper comparisons and assessment of the Australian-wide system.
I have been reliably informed that there is parallel data (measurements from a mercury thermometer and electronic probe recording in the same shelter) for a further 37 sites, additional to Mildura. I have further been told that this data provides parallel reading to the present for some of these sites. But the Bureau is withholding this information.
In summary, given the intense political interest in climate change with far reaching economic implications, and the relatively recent transition to a very different methods of measuring temperatures (mercury thermometer to electronic probe), it would be assumed that there are dozens of reports published by the Bureau that document how comparable the measurements have proven at different locations, and under different conditions.
Yet there are none! Without independent verification, these temperature recordings of the Bureau are open to dispute and the integrity of the Bureau and the Government is degraded.
I have heard you lament that there is an overwhelming consensus of scientific support for global warming and so we should just get on with solutions. But, without an independent verification of the Bureau’s temperature measurements then those who doubt global warming can easily dismiss the Bureau’s reports as unreliable and incorrect. To help resolve this issue I request that you provide me with the opportunity to present my findings – my evidence – to a relevant committee for proper scrutiny.
Yours sincerely
Jennifer Marohasy BSc PhD
Senior Fellow at the Institute of Public Affairs, and
Owner-operator at the ClimateLab.com.au
3.15PM AEST, FRIDAY MAY 4TH 2018
To download this letter as a pdf, click here: Marohasy-to-Finkel-20180504
ENDS
****
FROM THE ORIGINAL BLOG POST… FROM 2014… CONTINUED
WHILE the average Australian, being sentimental and having a nationalistic streak, would like to believe their Bureau of Meteorology is honestly recording and reporting temperatures, in reality the science managers are corrupting the official record.
Following is another example, another story, to add to the litany as detailed in my unanswered letter to Minister Hunt and recent series of blog posts on Bourke.
KEN Stewart, a retired school principal, became interested in global warming some years ago. After the Bureau released their new so-called High Quality temperature dataset, he decided he would audit it – out of curiosity. He found that changes made to the original data could account for as much as one third of the reported global warming in Australia.
His queries to David Jones, Head of Climate Monitoring and Prediction at the Bureau, were dismissed with comment that the “adjustments” have “a near zero impact on the all Australian temperature”. Which would beg the question, why make the “adjustments” at all. Except that they do change the temperature, they create a significant warming trend.
Eventually, on 20th December 2010, Ken joined Jo Nova, Senator Cory Bernardi and several others to lodge a request to the Auditor-General for a formal audit of the Bureau’s climate data and advice.
But rather than defend the new dataset, the Bureau ditched it, in effect preventing the audit from going ahead.
Then in March 2012, the Bureau announced a new official temperature series this time called the Australian Climate Observations Reference Network- Surface Air Temperatures (ACORN-SAT).
This is the data series used by David Jones from the Bureau to announce in January that last year, 2013, was the hottest year on record ever in Australia.
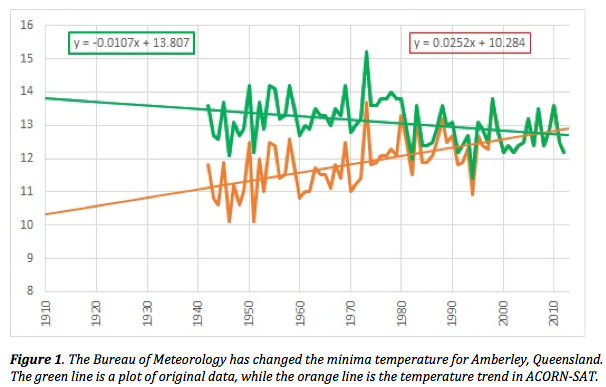
This “record hot year” is in large part a consequence of the methodology used to construct ACORN-SAT. Ken’s most recent analysis shows that in the creation of ACORN-SAT the Bureau has “adjusted” temperatures both up and down, with almost all the “adjustments” down occurring before 1971, and all the “adjustments” up occurring after 1971. In other words the record before 1971 is cooled, and after 1971 warmed.
The mean difference in the minima trend (ACORN-SAT minus original data), according to Ken, is +0.37 degrees Celsius. Interestingly the difference in the maxima trend is much less, +0.09 degrees. This has the effect of exaggerating warming of the minima, creating a pattern consistent with anthropogenic global warming theory expectations.
The most extreme example that Ken found of data corruption was at Amberley, near Brisbane, Queensland, where a cooling minima trend was effectively reversed, Figure 1.
Read the full article at http://kenskingdom.wordpress.com/2014/05/16/the-australian-temperature-record-revisited-a-question-of-balance/
*****
Ken Stewart is a retired school principal with a deep-seated scepticism for anything produced by governments, political parties, religious organisations, big business and Greenpeace. Ken believes in family, the power of learning, the importance of asking good questions and finding answers for yourself.

 Jennifer Marohasy BSc PhD has worked in industry and government. She is currently researching a novel technique for long-range weather forecasting funded by the B. Macfie Family Foundation.