• Skip to primary navigation
  • Skip to main content
  • Skip to primary sidebar
  • Skip to footer
Jennifer Marohasy

Jennifer Marohasy

a forum for the discussion of issues concerning the natural environment

  • Home
  • About
  • Publications
  • Speaker
  • Blog
  • Temperatures
  • Coral Reefs
  • Contact
  • Subscribe

Information

Snowy Hydro responsible for cooling at Rutherglen?

September 14, 2015 By jennifer

I’VE just had a paper published in the international climate science journal Atmospheric Research (volume 166, pages 141-149), in which I show there was significant cooling in the maximum temperatures at the Cape Otway and Wilsons Promontory lighthouses, south eastern Australia, from 1921 to 1950.  This cooling is even more pronounced in temperature records from the Riverina, including at Rutherglen and Deniliquin.  Indeed, while temperatures at the lighthouses (and most Australian east coast locations) show cooling from about 1880 to about 1950, they then show quite dramatic warming from at least 1960 until about 2002.  In the Riverina, however, minimum temperatures continued to fall through the 1970s and 1980s.  Pondering this issue, it occurred to me that Snowy Hydro may be responsible.

This hydroelectricity and irrigation scheme was a major feat of engineering facilitating the ongoing diversion of about 1,000 gigalitres of water per year, which once flowed east to the Pacific, west to the Riverina.  Much of the land brought under irrigation is used to grow rice, with water pooled.  The cooling could thus be the direct result of evaporation which removes latent heat from the surface from which evaporation occurs.  This is the physical basis of industrial and domestic cooling systems, and also of sweating.

The main distribution channels are just to the west of Rutherglen, and resulted in 800,000 hectares of new land under irrigation, not just for rice but also pastures for dairy, and more.

The largest dip in the minimum temperature record for Deniliquin occurs just after the Snowy Hydro scheme came online.   Of course the Australian Bureau of Meteorology denies this cooling: everywhere must show global warming!  So their ACORN-SAT team jump down the minimum temperature record at Deniliquin by a massive 1.5 degree Celsius before 1971 in an attempt to mask the cooling.

If you want to better understand the level of incompetence at work in remodelling the Deniliquin temperature series, and also understand more about this temperature record, and the proximity of Rutherglen to the major water infrastructure developments, read my latest correspondence with the Bureau of Meteorology, which follows.


*******   14th September 2015

Dr Louise Minty
Acting Deputy Director, Environment and Research Division
Head Office Melbourne, Bureau of Meteorology
GPO Box 1289, Melbourne VIC 3001

Dear Dr Minty

Re:  The temperature time series for Deniliquin, and your letter contains basic errors of fact

Thank you for your letter of 3rd September, 2015, in response to my letter to Ms Middleton in which I  explained that the temperature record for Deniliquin shows statistically significant cooling, and drew attention to the chart in your key ‘fact sheet’ which confounds homogenized and raw temperature data.   While I appreciate you taking the time to write to me, there are basic factual errors in your letter

I note that you advise that that if I have ongoing concerns I should submit these to a reputable journal.  The detail of my analysis of both the maximum and minimum temperature time series for Deniliquin and Rutherglen will soon be publically available in the peer-reviewed scientific literature.  This contrasts with the publication history of the ‘adjustments’ for Deniliquin and Rutherglen by the Bureau which have not been published in any peer-review literature, and which do not accord with actual discontinuities in the individual raw temperature series.

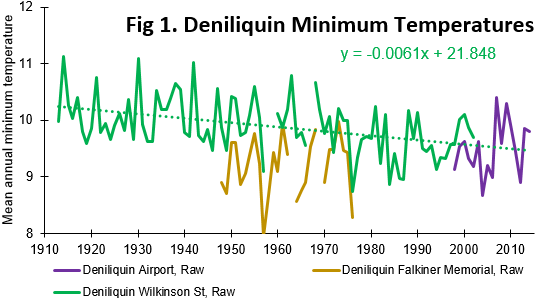
You state in your letter that there is no continuous temperature record for Wilkinson Street Deniliquin which shows a cooling trend since 1910.  You suggest that I have confounded the Wilkinson Street record for Deniliquin with the record from the airport and Falkiner Memorial (the CSIRO facility).  If you read my letter you would see it clearly showed the three series, in green, mustard, and purple.  I will reproduce them again for you here as Figure 1:

Figure 1.

You suggest I made a concatenation of these records into a single temperature series. You are in error. I did not.

Clearly there is a long continuous record for Wilkinson Street and it shows cooling.

In your letter you state that adjustments had to be made to the Deniliquin record in order to combine the series from Wilkinson Street and the airport.  I did not combine these series in my correspondence to you, but the Bureau has combined them as part of the development of the Australian Climate Observation Network – Surface Temperatures (ACORN-SAT) dataset.

You suggest that adjustments were made for September 1984 to ‘merge’ the airport and Wilkinson Street series. You are incorrect. Your ACORN-SAT team made adjustments in July 1997 to account for the move to the airport, and also assigned the record a new site number.

Your adjustments involve dropping down all temperatures between January 1910 and June 1997 by -0.51 degree Celsius.   But this huge manipulation is not even the largest correction your team makes.  The largest ‘correction’ is made in 1971 dropping temperatures by 0.99 degrees. The cumulative effect is a cooling of all temperatures as recorded at Deniliquin before August 1971 by 1.5 degrees.  As I am sure you are aware, dropping all previous historical temperatures makes the present appear relatively hotter.  These changes alone manage to almost double the amount of global warming over the 20th Century, typically reported as 0.9 degree Celsius!

The only justification presented for the correction in your online note is: ‘site move’. The Bureau’s policy for dealing with significant site moves when they actually occur is to award a new site number. The Bureau did not do this.

You claim in your letter the site move caused a discontinuity in the data. But a check of the site code used when this same temperature series was homogenized by Simon Torok and Neville Nicolls* indicates that there was no discontinuity detected in 1971.

Furthermore, if the site move caused a discontinuity in the data then this would be evident in the numbers, specifically in the monthly values. But when the Wilkinson Street monthly minimum temperature series (1910 to 2002) is run through a simple control chart there is no exceedance of upper and lower control limits set at three standard deviations from the overall mean as shown in Figure 2.

Figure 2.  I-MR-R/S control chart showing minimum temperatures as recorded at Wilkinson Street, Deniliquin, between January 1910 and December 2002.  The subgroup mean (top chart) represents the mean for each year eliminating the within subgroup component of variation (i.e. the seasons), thus tracking process location (i.e. annual temperature change).  The moving range (MR) of the subgroup mean (middle chart) tracks between year variation.  The standard deviation (bottom chart) plots process variation within subgroups (i.e. within each year).
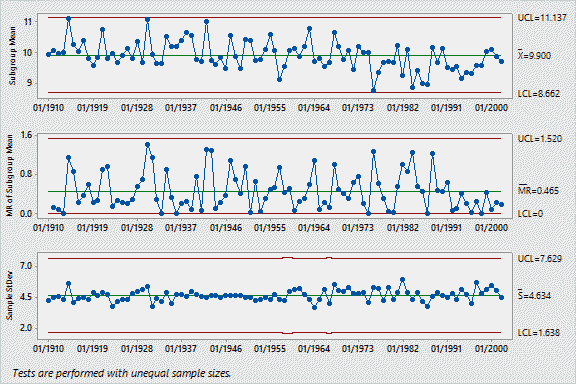
Figure 2


You claim homogenization is required to correct for discontinuities created by equipment and site changes. Control charts are a measure of the within-and-between year variation, and as such they clearly show when a discontinuity has occurred. A major discontinuity appears as a step-change resulting in exceedance of upper and/or lower control limits, while a minor discontinuity appears as a step-change in the position of the subgroup mean above or below the center line.

You suggest discontinuation in the minimum temperature record at 1971. There is none. There is consistent cooling over the period of the record, and particularly after 1975, which corresponds with the Snowy Mountains hydroelectricity and irrigation scheme coming online.

You attribute cooling in the data to a non-existent discontinuity. As I establish above this discontinuity is fictional. Cooling in the data is likely associated with local land use change in particular over 800,000 hectares (nearly 2 million acres) of land newly under irrigation in the immediate vicinity of Deniliquin as shown schematically in Figure 3.
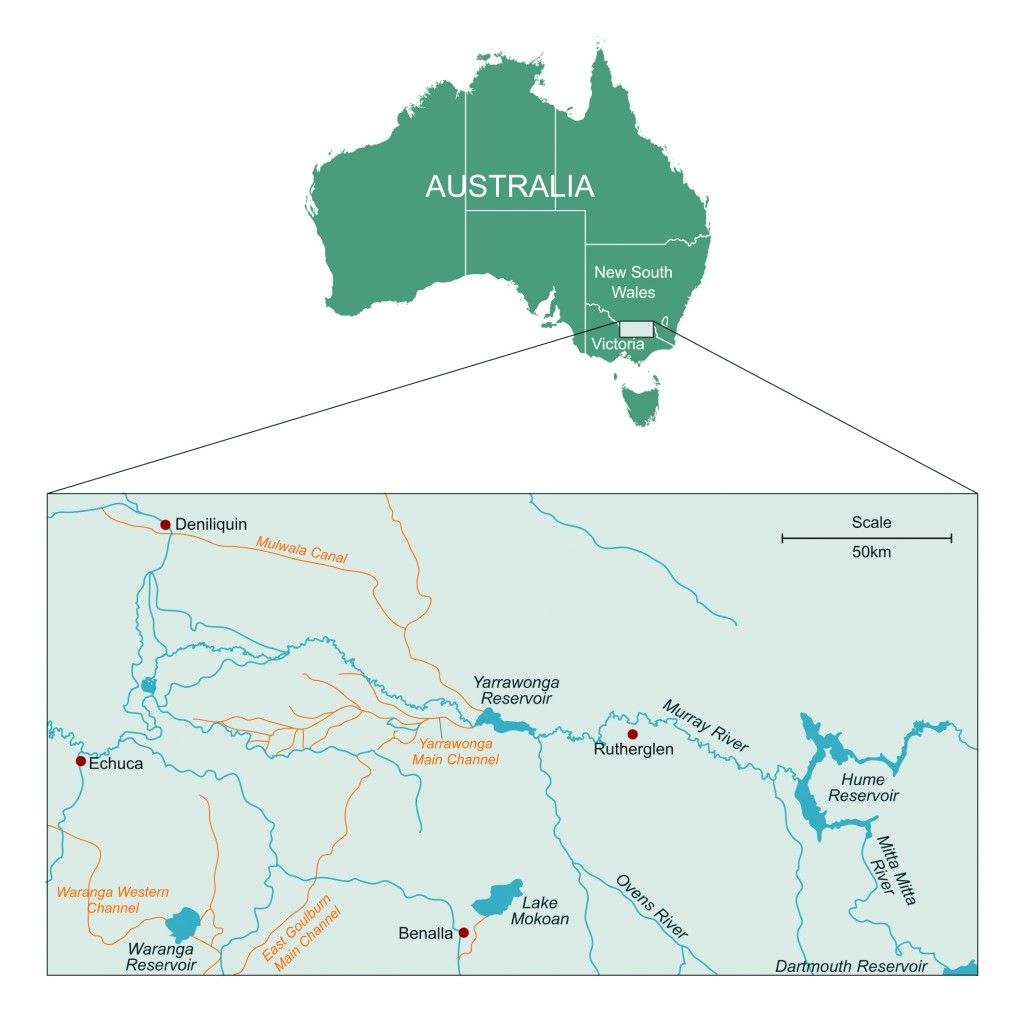
Figure 3Figure 3.  Locations of Deniliquin and Rutherglen relative to main irrigation channels associated with development of irrigated agriculture in the Riverina, Australia

The Deniliquin temperature series is not an isolated instance of the Bureau making unsubstantiated claims regarding temperature series. The entire historical temperature record for Australia is being re-written by your ACORN-SAT team with fictitious justifications.

I am happy to provide further examples. You have indicated that you would prefer this information as a reprint, which I will forward as soon as it is available.  If you are interested in discussing anything aforementioned, I would be happy to arrange a time.

Yours sincerely

Dr Jennifer Marohasy
Independent Scientist

*Torok, SJ and Nicholls, N 1996. A historical annual temperature dataset for Australia. Aust. Met. Mag., 45, 251-260.

___________________

This blog posts continues the Rutherglen saga.  You can read some background information here… https://jennifermarohasy.com.dev.internet-thinking.com.au/temperatures/rutherglen/ . The next most recent Rutherglen blog post is here… https://jennifermarohasy.com.dev.internet-thinking.com.au/2015/08/bureau-just-makes-stuff-up-deniliquin-remodelled-then-rutherglen-homogenized/ .   I still believe that someone should be sacked for making up global warming at Rutherglen…  https://jennifermarohasy.com.dev.internet-thinking.com.au/2014/08/whos-going-to-be-sacked-for-making-up-global-warming-at-rutherglen/ .   But alas the progressives who set the national agenda want to believe in global warming, even if it requires rewriting the climate history of Rutherglen.  So much for evidence based public policy. What did George Orwell write… he who controls the present, controls the past.

Filed Under: Information

Remembering, the Day After Tomorrow

July 13, 2015 By jennifer

So, it may be difficult to remember a time in the future!  But do you remember the movie ‘The Day after Tomorrow’ when New York froze over?  That ice age was caused by changes in the circulation of warm water in the Atlantic Ocean, in particular the Gulf Stream closed down because of melting in the Arctic because of carbon dioxide.  Well, that was Hollywood!  Now, a mathematician, Professor Valentina Zharkova, is claiming an imminent big freeze, not because of carbon dioxide, but because of out of synch solar cycles.  DayAfterTomorrow

“In cycle 26, the two waves exactly mirror each other – peaking at the same time but in opposite hemispheres of the sun,” Zharkova told the Daily Mail.

So, I understand that when the number of sunspots is at a minimum, the sun’s general magnetic field is nearly dipolar.  What causes this?

I keep on intending to read-up more on the influence of the gravitational pull of the larger planets on the sun’s magnetism.  I would be interested in best references…

Meanwhile, here’s something from YouTube to amuse those who enjoy virtual horror with a real historical dimension.

Filed Under: Information, News Tagged With: ice age

Remember Rutherglen, & “Whoever has Honor Follow Me!”

June 20, 2015 By jennifer

Maria Pita was a Galician heroine who rallied the ordinary citizens of Corunna in 1589.
Maria Pita is a Galician heroine who rallied the ordinary citizens of Corunna in 1589 with the battle cry ‘Whoever has honor, follow me!”.

The results of an independent ­review of the Bureau of Mete­or­ology’s national temperature records should “ring alarm bells” for those who had believed the bureau’s methods were transparent, says a key critic, Jennifer ­Marohasy.  So, begins an article by Graham Lloyd in The Weekend Australian.

Lloyd goes on to write:

Dr Marohasy said the review panel, which recommended that better statistical methods and data handling be adopted, justified many of the concerns raised.

However, the failure to ­address specific issues, such as the exaggerated warming trend at Rutherglen in ­northeast Victoria after homogeni­sation, had left ­important questions ­unresolved, she said.

The review panel report said it had stayed strictly within its terms of reference.

Given the limited time available, the panel had focused on big-picture issues, chairman Ron Sandland said.

The panel was confident that “by addressing our recommend­ations, most of the issues raised on the submissions would be ­addressed”, Dr Sandland said.

The panel is scheduled to meet again early in the next year.

Dr Sandland said that, overall, the panel had found the Australian Climate Observations Reference Network — Surface Air Temperature was a “complex and well-maintained data set that has some scope for further improvements”.

It had made five recommend­ations that would boost transparency of the data set.

Although the panel reviewed 20 public submissions, Dr Marohasy said it had failed to address specific concerns.

“While the general tone of the report suggests everything is fine, many of the recommen­dations (are) repeat requests made by myself and others over the last few years,” Dr ­Marohasy said.

“Indeed, while on the one hand the (bureau’s technical ­advisory) forum reports claims that the bureau is using world’s best practice, on the other hand its many and specific recommend­ations evidence the absence of most basic quality controls in the many adjustments made to the raw data in the development of the homogenised temperature series.”

BoM said it welcomed the conclusion that homogenisation played an essential role in eliminating artificial non-clim­ate ­systematic errors in temperature observations, so that a meaningful and consistent set of records could be maintained over time.

In suggesting that the review was about the legitimacy of homogenization as a technique, the BoM is continuing to play politics.  As I explained in my initial comments in response to the release of the report, we acknowledge that there are times when it is necessary to make adjustments to raw temperature data in the creation of long, continuous, high quality records.  But, we object to the way in which the Bureau makes changes to every temperature series incorporated into ACORN-SAT, and from which the official Australian historical temperature record is constructed.

Indeed, it is curious that while on the one-hand the Forum reports claims that the Bureau is using world’s best practice, on the other-hand its many and specific recommendations evidence the absence of most basic quality controls in the many adjustments made to the raw data in the development of the homogenized temperature series.   For example, the Forum report acknowledges that there is a need to publish, “a brief, plain-language (as far as possible) description of the criteria for adjustment and the basis for adjustment itself.”

This must be a priority, especially for many of the more contentious locations, including Rutherglen in north eastern Victoria.   Indeed, the Forum has obfuscated by not addressing the key issue of why the Bureau has made such dramatic changes to the temperature record for Rutherglen.  If there is nothing wrong with current methodologies, beyond the need for better documentation, then why didn’t the Forum provide its own plain English description of the criteria used to make the adjustments for Rutherglen, which turn a slight overall cooling trend into dramatic warming.

So far, the Bureau has provided lots of documentation, but no actual evidence to support the many adjustments made in the homogenization of the temperature record for Rutherglen.

The warming trend at Rutherglen is essentially achieved by progressively dropping down the minimum temperatures starting in 1973 by 0.5 degree C.  The amount by which the temperatures is ‘adjusted’ down increases back through time to 1913 when there is a massive 1.8 degree Celsius difference between the recorded temperature and the homogenised value.

The homogenised values are then incorporated into the official record that is used to calculate temperature trends for the state of Victoria, and also Australia.  The Bureau has provided information at its website suggesting that there was a need to make adjustments to Rutherglen for the period prior to 1966 and that this “was determined from an objective statistical test that showed an artificial jump in the data during this period.”  But what was the statistical test actually performed on the data?  Why is this not documented?  The raw temperature record for Rutherglen has a virtually identical trend to its six neighbouring comparison sites, while the homogenized ACORN-SAT temperature series for Rutherglen is strongly biased towards warming.

As I explained to Graham Lloyd yesterday, in not answering any of our specific questions, including those concerning the homogenization of the temperature record for Rutherglen, the Forum’s report in many ways should ring alarm bells for those who have previously believed that the Bureau’s methods were transparent.

I’m currently overseas, in north western Spain,  in the town of Corunna, and  I’m inspired by the local heroine Maria Pita, to ask you to join with me in campaigning for change.  Maria Pita is a Galician heroine who rallied the ordinary citizens of Corunna in 1589 with the battle cry ‘Whoever has honor, follow me!”

Leave a comment of support in the thread following the  article by Graham Lloyd in The Weekend Australian.

It is totally unacceptable that the Bureau can essentially rework temperature data until it accords with the theory of anthropogenic global warming.

Also consider writing a letter to The Australian newspaper, and perhaps also other news outlets.  Explain the issue.  I’ve draft something below to get your started.   Next you could write to your local politician, again explaining the issue, and also asking that they read the actual report from the forum, and also the many submissions made by myself and colleagues.   It is extraordinary with all the evidence so far provided, that absolutely nothing is being done right now to get some integrity back into the official historical temperature record for Australia.

*******

Ideas for your own letter:

Dear Editor/Politician/Tony Jones

Following the release of the review of the Bureau of Meteorology’s national temperature records, I agree with Jennifer Marohasy that “alarm bells” should be ringing for those who had previously believed the bureau’s methods were transparent.

It is concerning that the expert panel still cannot explain the exaggerated warming in the official record for Rutherglen.   It seems the only thing wrong with the original observed values is that they did not accord with global warming theory, and so they were homogenized.

 I concur with Dr Marohasy, that to the extent possible, the Bureau should retain the actual recorded temperature values.  If it has to manipulate the data, then strict rules should be adhered to. In particular, the Bureau must not homogenize temperature series, changing actual recorded values, unless there is a documented equipment change or site move creating a statistically significant discontinuity in the data.

The Bureau should start the official temperature record in 1880, not 1910, and not add hotter stations into later years.

Yours sincerely

Maria Pita/Your name

Filed Under: Good Causes, Information Tagged With: Temperatures

Survey Denying My Position on Climate Change

April 21, 2015 By jennifer

ACCORDING to those who define popular culture, prominent sceptics like myself deny the reality of climate change.   It’s a convenient argument for the activist, and its repeated in a survey I just received today from academic Raymond Orr, University of Melbourne.  According to the preamble to the survey, prominent sceptics like myself “are doubtful that climate change is occurring”.    The first question then includes the following statements:

Q1 How would you describe your climate change beliefs:
a. I don’t believe climate change is occurring
c. I don’t believe we can know climate change is occurring
d. I believe in climate change but don’t believe it is caused by humans
e. I believe in climate change but don’t believe government should address climate change
f. I believe in climate change but don’t think there is anything we can do about it
g. Other

***

If the survey is intended to characterize the position of prominent sceptics like myself, then a more useful set of first statements might include:

Q1 How would you describe your climate change beliefs:

a. I don’t believe climate change is occurring
b. I believe climate change is occurring, and is predominantly natural in origin
c. I believe climate change is occurring, and is predominantly anthropogenic in origin

***

Following is the text of the email from Dr Orr follows, and also my reply:

Dear Ms. Marohasy,

My name is Raymond Orr and my colleague Anne Kallies had contacted you at the end of last year regarding the possibility of your participating in a short study on climate change attitudes. We had intended to conduct the survey in person but have moved to an online format. If you are still willing, your participating would be very much appreciated and would only take between 10-15 minutes. Your participation is kept entirely confidential.

The project is comparative research project on climate change attitudes conducted with my colleague Professor Robyn Eckersley from the School of Social and Political Sciences at the University of Melbourne. The purpose of the study is to identify and compare how much variability exists in the attitudes of prominent people in Australia and the United States who publicly identify as climate sceptics. A more detailed explanation of the project is provided in the attached Plain Language Statement.

I am writing to seek your permission to participate in the study because you are a prominent person in Australia who has publicly questioned the science of climate change or the need for action on climate change.

Participation is entirely voluntary and you will be free to withdraw at any stage.  Your anonymity will be completely protected and you will be entitled to receive, upon request, any published research or conference papers resulting from the study. The study has been approved by the University of Melbourne’s Human Research Ethics Committee.

Participation in the study will require you to sort a series of statements according to how much you agree with them (technically known as a Q-sort) and answering short follow up questions.  The survey is online and can be found by clicking on or pasting this link  [redacted].

If you have any questions about the project then please do not hesitate to contact Dr Raymond Orr [redacted]. Thank you in advance for your participation.

Sincerely,

Raymond Orr, PhD, School of Social and Political Sciences, University of Melbourne

My reply…

Hi Raymond

Thank you for your email.  I had been prepared to participate in your survey, but in the first question you show a total ignorance of what is disputed in the science, and the position of prominent sceptics.

There is no denial that climate change is part and parcel of life on earth.   It is always occurring.  Indeed, we are about 10,000 years into the Holocene warm period, and about 150 years out of a mini-ice age.   I know of no prominent sceptic in Australia or America who denies such realities.  Indeed most take a great interest in the history of climate change both in geological time, and from the tree rings, and more recent instrumental record.

Indeed, can you send me the name/details of any one prominent sceptic in Australia or the US who denies that the climate changes and/or shows no interest in measurement of the same?

At issue is the extent of the human contribution to the observable late 20thy Century warming in places like Australia, and whether we have catastrophic global warming.   My position, like that of most sceptics, is that the recent warming in Australia unremarkable.   Furthermore, we are more likely to attribute it to nature causes as detailed in the attached scientific publication by Nicola Scafetta from the Journal of Atmospheric and Solar-Terrestrial Physics.

The abstract reads:  “We investigate whether or not the decadal and multi-decadal climate oscillations have an astronomical origin. Several global surface temperature records since 1850 and records deduced from the orbits of the planets present very similar power spectra. Eleven frequencies with period between 5 and 100 years closely correspond in the two records. Among them, large climate oscillations with peak-to-trough amplitude of about 0.1 and 0.251C, and periods of about 20 and 60 years, respectively, are synchronized to the orbital periods of Jupiter and Saturn. Schwabe and Hale solar cycles are also visible in the temperature records. A 9.1-year cycle is synchronized to the Moon’s orbital cycles. A phenomenological model based on these astronomical cycles can be used to well reconstruct the temperature oscillations since 1850 and to make partial forecasts for the 21st century. It is found that at least 60% of the global warming observed since 1970 has been induced by the combined effect of the above natural climate oscillations. The partial forecast indicates that climate may stabilize or cool until 2030–2040. Possible physical mechanisms are qualitatively discussed with an emphasis on the phenomenon of collective synchronization of coupled oscillators.”

Yet the pre-amble/background to the survey, that includes the statement that skeptics “are doubtful that climate change is occurring”,  suggests prominent sceptics like myself and Nicola Scafetta deny such a reality.

The first question in the questionaire then reiterates this nonsense.

It is disappointing that such a prominent university could be so ignorance of the real position of those it purports to characterize.

Kind regards

Jennifer Marohasy, PhD

Filed Under: Information Tagged With: Climate & Climate Change

Like Expecting George Pell to Admit Pedophilia During Sunday Sermon

March 9, 2015 By jennifer

Following is an email just sent to Bob Baldwin concerning the need for him to urgently establish a public forum to enable dissident views to be heard concerning the bastardization of Australia’s official temperature record by the Australian Bureau of Meteorology.

Noosa, Queensland, 9th March, 2015

Dear Mr Baldwin

Re: Robust assessment of the trusted and respected Bureau of Meteorology obviously requires that the dissident view be heard

There once existed a broad consensus that the Church must be the ultimate judge of scientific truths.  That was before the enlightenment.  More recently, there was an equally mistaken consensus that the Church could provide a safe environment for little children.

Those who dared suggested otherwise were first ignored, then ridiculed, and only much later able to fight for truth and justice.   When their concerns finally registered, there was disbelief that such outrageous abuse was allowed to persist for so long.

In your recent appointed as ‘Parliamentary Secretary to the Minister for the Environment’ with responsibility for the Bureau of Meteorology, you have the opportunity to provide a forum for dissident voices to be heard concerning what is perceived by many to be the bastardization of Australia’s temperature record.

Eventually, simply through the establishment of a forum of experts tasked with hearing the alternative evidence, history might  record you as courageous, and as having begun a process that ultimately exposed the deceit and bias that now riddles this once most respected and trusted organization.   This, I thought, was indeed a possibility when I read your media release of January 19, 2015, outlining the establishment of a technical advisory forum that would undertake a “robust assessment” of Australia’s official temperature data set.

Then, just today I was provided with the actual terms of reference for this forum comprising eight statisticians and/or mathematicians, and I see that they intend to meet for only one day each year.  Furthermore, during the morning of this one day they will be lectured to by Bureau scientists, with the afternoon devoted to discussion.

Indeed the current format is likely to be as useful at getting to the bottom of our issues with the Bureau’s revisionist approach to Australia’s climatic history, as expecting George Pell to voluntarily admit pedophilia during a Sunday sermon.

If indeed you are serious about a robust assessment of the Bureau’s handling of temperature data, then I urge you to immediately modify the format for the forum.   I urge you to immediately establish a mechanism for public critical review including testimony from dissidents.

Yours sincerely

Dr Jennifer Marohasy, Independent Scientist

*****

Forum Format & Terms of Reference

Media Release 19th January 2015

Filed Under: Information, News Tagged With: Temperatures

Donald and David’s Relevance to Climate Science

February 28, 2015 By jennifer

“CRICKET legend Sir Donald Bradman is a useful metaphor for the escalating global row over claims the world’s leading climate agencies have been messing with the weather.

David Stockwell has made a submission to the Panel.

Imagine, for instance, if some bureau of sport were to revise the Don’s batting average in test cricket down from 99.94 to 75 after adjusting for anomalies and deleting innings of 200 runs or more.

What if the bureau then claimed another batsman had exceeded the Don’s revamped record of 75 to become the greatest ever?”

So begins a long article in today’s The Weekend Australian on page 20.

Journalist Graham Lloyd was in fact building on an analogy in a submission to the new panel, by David Stockwell; the Panel ostensibly established to review the Bureau of Meteorology’s homogenization of Australia’s official temperature record.

In his submission David Stockwell, an adjunct research fellow at Central Queensland University explains:

“Every portrayal of historical data should be historically accurate, else it becomes revisionism, and strays out of the domain of science and into the domain of ideology and politics. While step-wise adjustments are intended to compensate for real changes in the baseline temperature that result from, often undocumented, changes in instrumentation or relocation of stations, the cumulative effect of back-propagating step adjustments is to corrupt the official record.”

Neither Christine Milne nor Tony Jones are likely to follow up on this.  So, we need you to get your letter into The Editor and/or make comment under the article…

http://www.theaustralian.com.au/news/features/upping-the-heat-on-climate-number-crunchers/story-e6frg6z6-1227242096753

And also contact your local MP and/or news outlet and explain why they need to report this.

Filed Under: Information Tagged With: Temperatures

  • « Go to Previous Page
  • Go to page 1
  • Interim pages omitted …
  • Go to page 23
  • Go to page 24
  • Go to page 25
  • Go to page 26
  • Go to page 27
  • Interim pages omitted …
  • Go to page 71
  • Go to Next Page »

Primary Sidebar

Recent Comments

  • Ian Thomson on Vax-ed as Sick as Unvax-ed, Amongst My Friends
  • Dave Ross on Vax-ed as Sick as Unvax-ed, Amongst My Friends
  • Dave Ross on Vax-ed as Sick as Unvax-ed, Amongst My Friends
  • Alex on Incarceration Nation: Frightened of Ivermectin, and Dihydrogen monoxide
  • Wilhelm Grimm III on Incarceration Nation: Frightened of Ivermectin, and Dihydrogen monoxide

Subscribe For News Updates

  • This field is for validation purposes and should be left unchanged.

November 2025
M T W T F S S
 12
3456789
10111213141516
17181920212223
24252627282930
« Jan    

Archives

Footer

About Me

Jennifer Marohasy Jennifer Marohasy BSc PhD has worked in industry and government. She is currently researching a novel technique for long-range weather forecasting funded by the B. Macfie Family Foundation. Read more

Subscribe For News Updates

Subscribe Me

Contact Me

To get in touch with Jennifer call 0418873222 or international call +61418873222.

Email: jennifermarohasy at gmail.com

Connect With Me

  • Facebook
  • LinkedIn
  • RSS
  • Twitter
  • YouTube

Copyright © 2014 - 2018 Jennifer Marohasy. All rights reserved. | Legal

Website by 46digital