• Skip to primary navigation
  • Skip to main content
  • Skip to primary sidebar
  • Skip to footer
Jennifer Marohasy

Jennifer Marohasy

a forum for the discussion of issues concerning the natural environment

  • Home
  • About
  • Publications
  • Speaker
  • Blog
  • Temperatures
  • Coral Reefs
  • Contact
  • Subscribe

Information

Bureau Still Limiting Cooling to Minus 10 Degrees

July 18, 2017 By jennifer

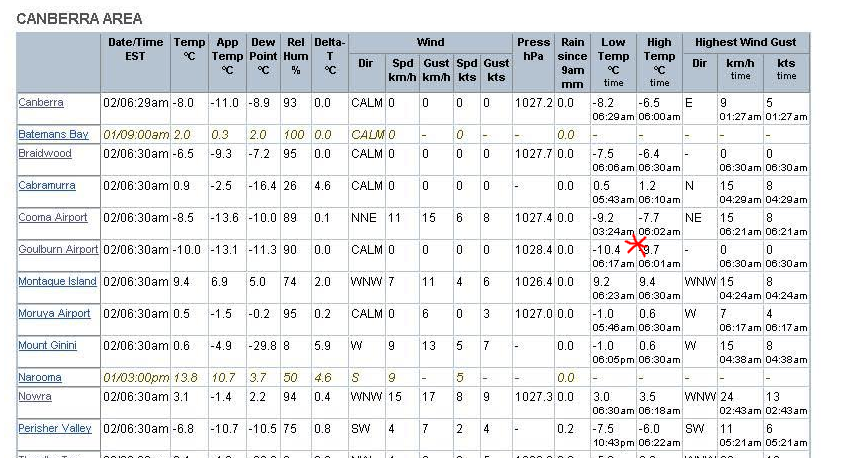
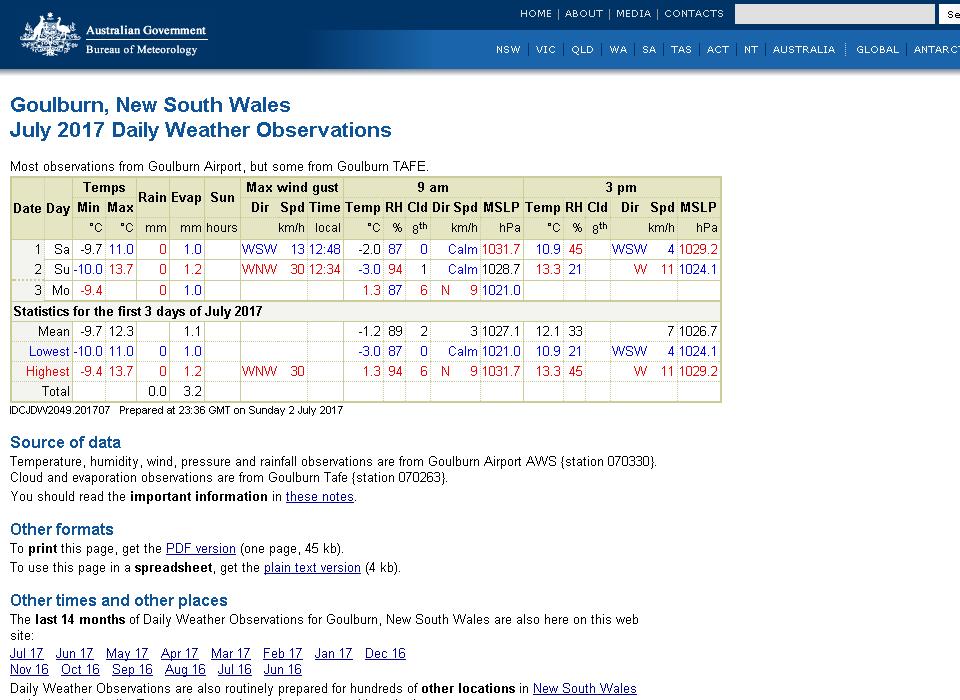
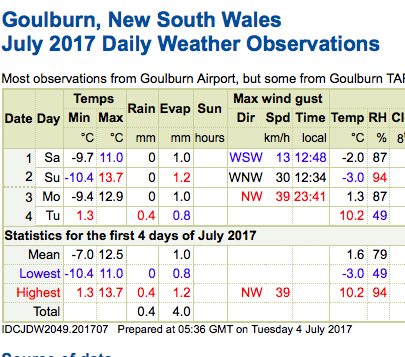
TWO weeks ago, in response to my queries the Australian Bureau of Meteorology acknowledged that it had put in place limits on the lowest temperature that an individual weather station could record.  So, when the automatic weather station which now operates in the town of Goulburn (not far from Canberra), recorded a measurement of minus 10.4 degree Celsius, the ‘quality control’ system in place ‘corrected’ this to minus 10.0 degree Celsius. None of this is denied.  When we protested, the Bureau emailed:

“The correct minimum temperature for Goulburn on 2 July, 2017 is -10.4 recorded at 6.30am at Goulburn Airport AWS… The Bureau’s quality control system, designed to filter out spurious low or high values was set at -10 minimum for Goulburn which is why the record automatically adjusted.

The error was picked up yesterday internally and quality control processes are being reviewed for those stations where temperatures below -10 are possible.

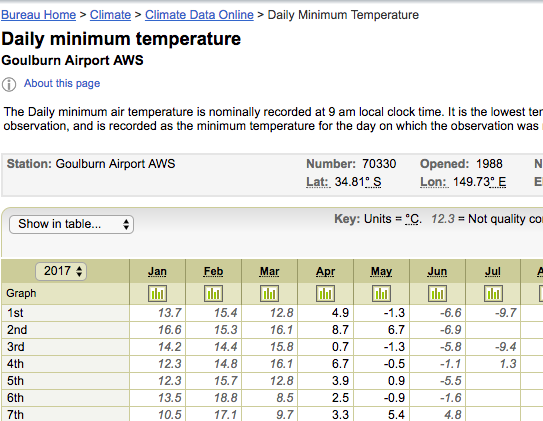
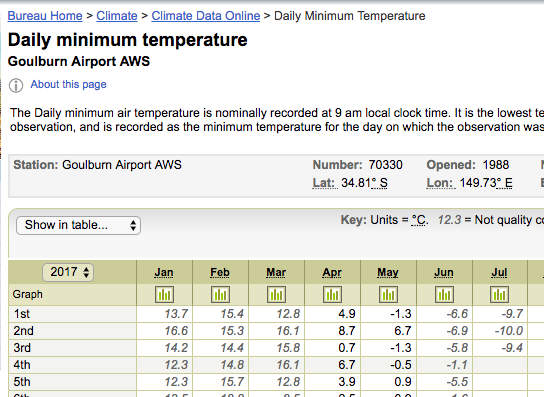
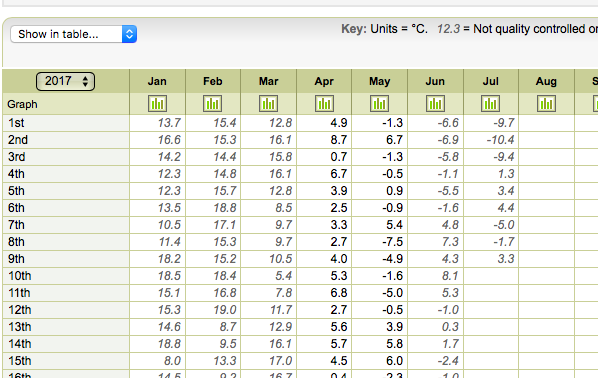
Further attempts at clarification have been met with stonewalling. Though after three days the Bureau did insert the correct measurement of -10.4 degree Celsius into the CDO dataset, where -10.0 had previously been showing.

I reported some of this in a note for The Spectator.

I had assumed that after this unfortunate incident the Bureau would remove the new absurd limits on how cold a temperature could actually be measured.   Indeed, the implications for the integrity of invaluable historical meteorological records are too horrible to contemplate.

I suffer, however, from a propensity to always check things.  So, when I thought temperatures might yet again dip below -10.0 degrees Celsius somewhere, I set my alarm for 5am, to get up early that morning to check (yes check) the values actually being recorded by the new automatic weather stations — particularly those scattered across the Australian Alps, given the weather-setup.  Then I would be in a position to subsequently check (yes check), to be sure any values measured below -10.0 were also taken forward into the official raw temperature dataset.

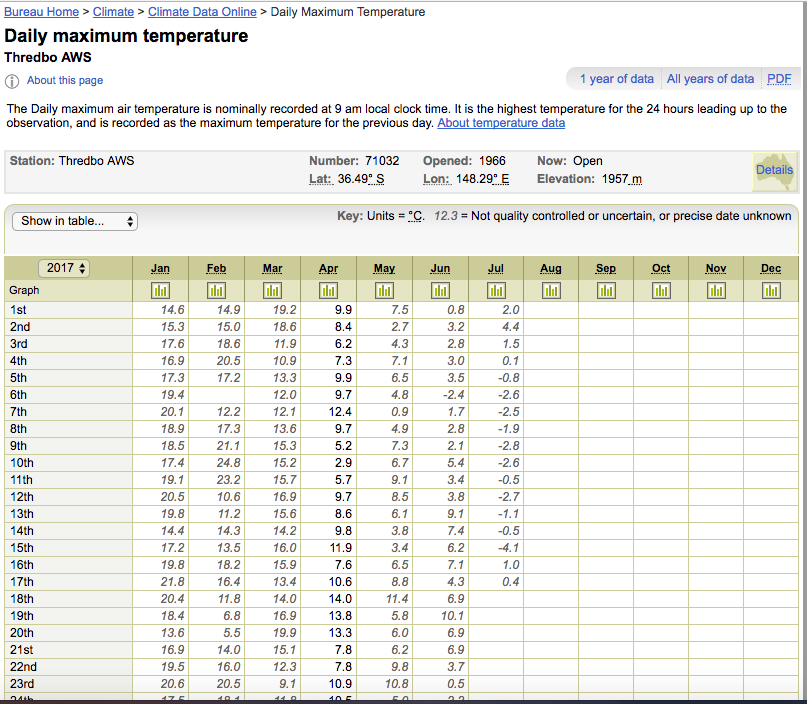
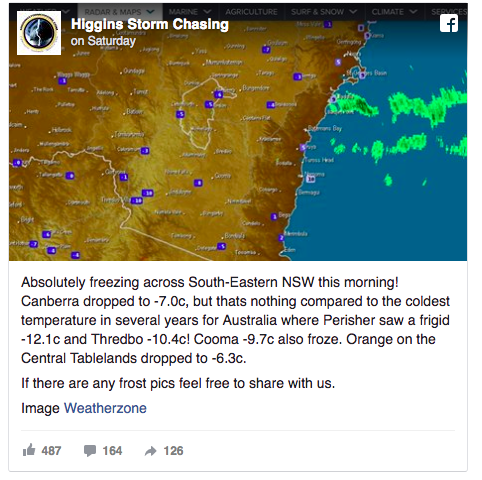
So, last Sunday morning (16 July) I got up at 5am and started checking the latest weather observations for the Snowy Mountains, including the locations of Perisher, Cooma and Thredbo.  At 5.30am the automatic weather station at the Thredbo Top Station (Number 071032) showed -10.4 degrees Celsius. I took a screenshot, and saved it on my computer.

The screenshot taken soon after 5.30am on the morning of Sunday 16th July 2017. This clearly shows the Automatic Weather Station at Thredbo recorded a temperature of -10.4 degree Celsius.

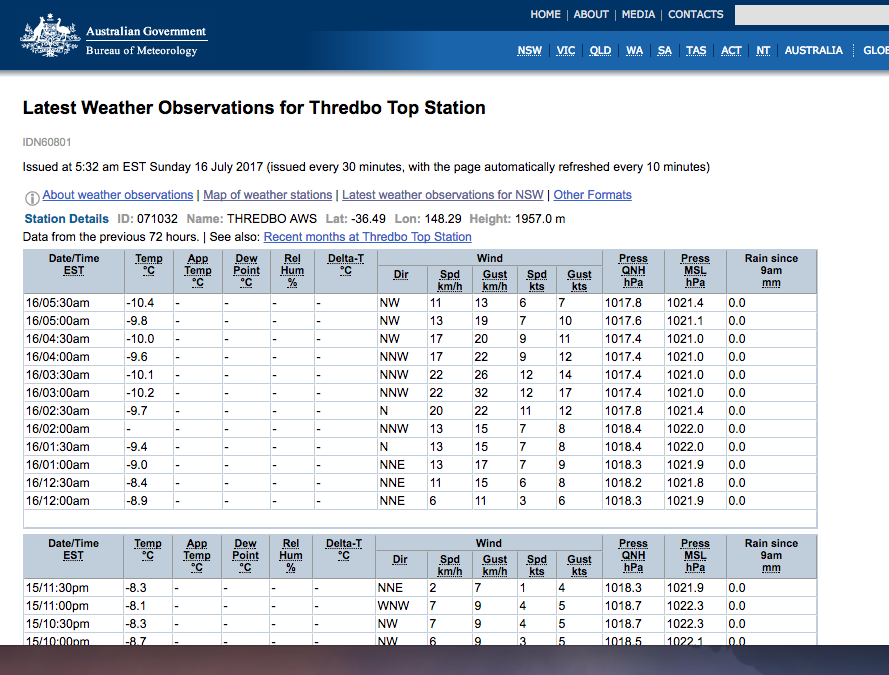
This ‘latest weather observation’ pages automatically refreshes every 10 minutes. So, if this value was going to be erroneously reset to -10.0 — as the Bureau wrongly reset the -10.4 recorded at Goulburn two weeks earlier — I would want the screenshot as evidence.

I thought this would probably be the end of it.  Temperatures have actually got as low as -14.7 at Thredbo Top Station – with this value recorded on 28th July 1980.  Surely the Bureau would not reset the cold, but not exceptionally cold, value of -10.4 at Thredbo that I saw measured at 5.30 by that AWS on Sunday 16th July 2017.

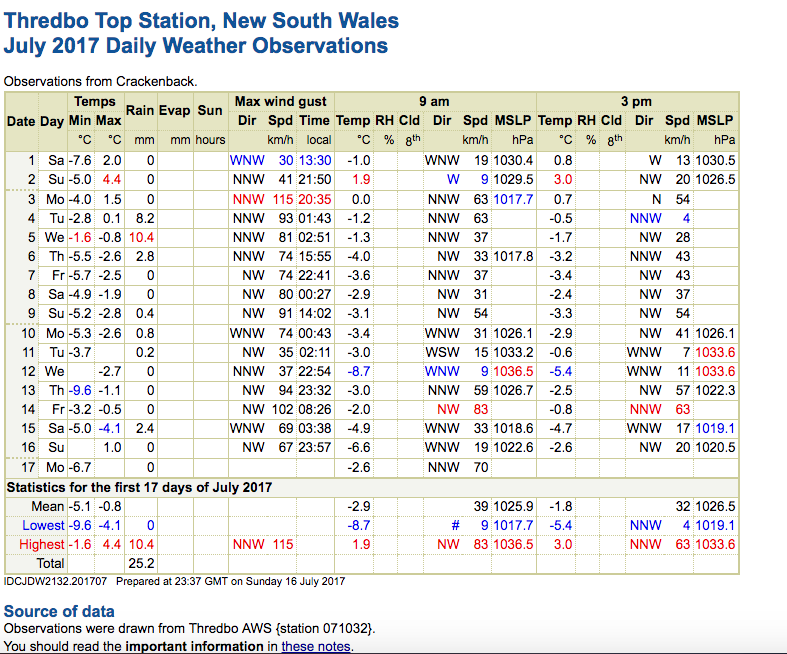
Nevertheless, the next morning (Monday morning) I checked the ‘Daily Weather Observations’ sheet for the Thredbo Top Station at the Bureau website to be sure that the value of -10.4 had indeed been brought forward as the lowest value recorded so far this month at that weather station.

But alas! There was no minimum value recorded for Sunday 16th July.  And the sheet stated that -9.6 was the lowest/the coldest value so far recorded at Thredbo this July 2017.

The ‘Daily Weather Observations’ page does not show the lowest minimum recorded on Sunday of -10.4. Rather it suggests no minimum temperature value was recorded on that day.

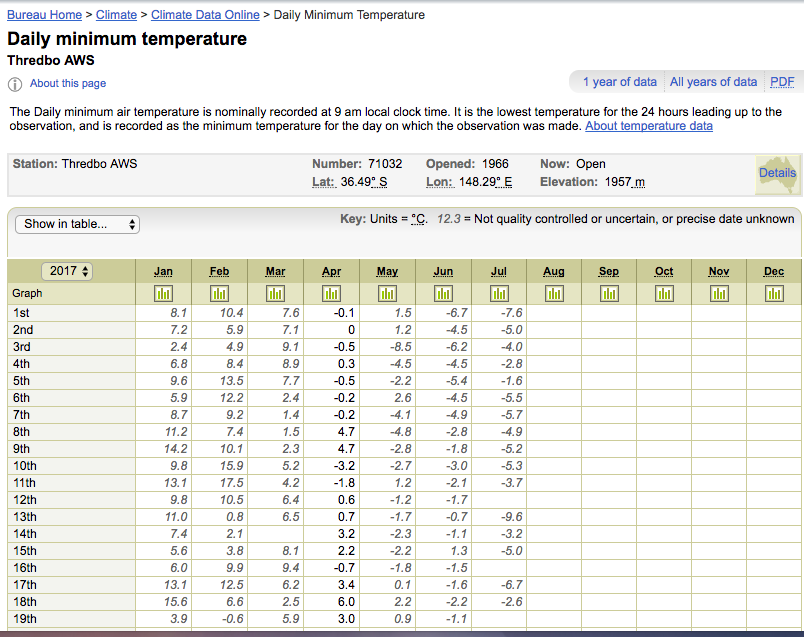
This morning (Tuesday), I held out some hope that the correct value of -10.4 would nevertheless be recorded in the CDO database as the minimum for Thredbo on Sunday 16th 2017. But alas, they are again leaving a blank.

This is a screenshot of the ‘Daily Minimum Temperatures’ for the Thredbo Top Station (number 71032). These are the raw values that comprise the historical record for this location.  The value of -10.4 has not been recorded for Sunday 16th July.

This is unforgiveable, surely someone is going to be sacked?  This either reflects an extraordinary incompetence, or a determination to prevent evidence of low temperatures.

While the Bureau just two weeks ago was adjusting values below -10.0 to -10.0 creating something of a bodge at Goulburn, they now appear to be leaving a blank — at least at Thredbo.

We know from the Climategate emails that the Manager of Climate Monitoring and Prediction at the Bureau, Dr David Jones, has little regard for numbers.  He wrote in an email on 7th September 2007 (ten years ago) that: “Truth be know, climate change here is now running so rampant that we don’t need meteorological data to see it.”


*****

Additional information

A simple frequency plot of all daily minimum temperatures record at Thredbo Top Station and entered into the CDO dataset indicates that it is likely temperatures will sometime drop below 10.0 degree Celsius.


While there is no minimum value recorded in the CDO dataset for Thredbo, a maximum value was recorded on Sunday 16th July 2017.


Thredbo is skewed normal as many data samples for the warmer months (January to April) are missing for the period from 1981-1997. Then for the period 1997-2003 nearly ALL daily values for Thredbo are rounded to the nearest degree! Thanks to Jaco for this information, and the charts.  [added 20th July]
The Higgins’s Storm Chasing crew also noticed the very cold -10.4 at Thredbo. Like me they must have been up early checking – because this temperature record has since been erased. More information about how cold it was that morning can be found here: https://www.sunshinecoastdaily.com.au/news/coldest-temperature-years-australia-shivers/3200942/ .  Thanks to Bob F-J for this link, and image. [added 20th July]

Filed Under: Information Tagged With: Temperatures

Bureau Now Sets Strict Limits on Cooling

July 5, 2017 By jennifer

OVER recent years I have documented the blatant remodelling of temperature measurements through the process of homogenisation. I have explained that it is the homogenised datasets that are used to report climate change by the Australian Bureau of Meteorology and the CSIRO.   I had assumed, however, that the raw data, kept in the CDO dataset, represented actual measurements.

Until late yesterday.

Late yesterday it was brought to my attention that the Bureau actually sets a strict lower limit on the extent to which a weather station can record a cold temperature.

So, when the weather station at Goulburn recorded -10.4 on Sunday morning – the Bureau’s ‘quality control system’, ‘designed to filter out spurious low or high values’ reset this value to -10.0.

To be clear, the actual measured value of -10.4 was ‘automatically adjusted’ so that it recorded as -10.0 in the key CDO dataset.

This is how the Bureau has attempted to explain away my concern that the -10.4 measurement as recorded in the Bureau’s observation sheet at 6.17am on Sunday morning, was not carried forward to the CDO dataset.

While it is reasonable to expect that the Bureau would have procedures in place to prevent the measurement of spurious temperatures, a simple frequency plot of minimum temperatures as recorded at Goulburn indicates that temperatures below -10.0 would be expected.

A simple histogram of daily minimum temperatures as recorded at Goulburn airport (station number 70330) from July 1990 to yesterday.

Which begs the question: Q1. When exactly was the limit of the daily minimum temperature for Goulburn set at -10.0 degree Celsius?

We have known for some time that through the process of homogenisation the Bureau practices historical revisionism – whereby adjustments are made to measurements so that regional and national trends better fit the theory of anthropogenic global warming – what I can now report is that procedures have also been put in place to limit the extent to which the actual measurements from individual weather station represent reality.

In particular at Goulburn, the weather station is set to adjust any value below -10.0, to -10.0.  Yet temperatures of -10.9 and -10.6 were recorded at Goulburn in 1994 – just a few years after the weather station was installed there.

So, a second question: Q2. How was it determined that temperatures at Goulburn should not exceed a minimum of -10.0?  

*******************************************************

Update 2.30 pm AEST on 6 July 2017

The following two charts from Jaco Vlok provide further insight into the Goulburn daily TMin data as recorded in the CDO dataset.

A time series plot of all minimum daily temperatures as recorded by the Bureau at Goulburn.
This chart shows an approximate uniform distribution of the first decimal value for the Goulburn data, there is therefore no evidence of data tampering.  Data tampering often results in an uneven distribution.

There is no unusual spike in the occurrence of -10.0.

Filed Under: Information Tagged With: Temperatures

Bureau Erases Goulburn Record Minimum Temperature: Set Sunday 2 July 2017

July 4, 2017 By jennifer

GOULBURN is a town, to the southwest of Sydney, known for its maximum-security prison. It is also a place, that by Australian standards gets quite cold. Temperatures have been measured at the airport since 1988, and the lowest temperature ever record in July is officially -9.1 degrees Celsius.

In fact, Sunday morning this record was smashed!

It got down to -10.4 degrees Celsius, at 6.17am on Sunday 2nd July. This was the official Bureau recording for Goulburn.

The observation sheet shows a minimum of -10.4, this temperature is recorded every second and downloaded every minute. The lowest value recorded becomes the minimum for the day. Except the Bureau has not recorded this value as the minimum.

Except, the Bureau has since erased this measurement.

According to the Bureau’s own rules, the coldest temperature record during a 24-hour period to 9am is recorded as the minimum for that day. So, for Sunday 2 July the carry-over minimum should be -10.4 degrees Celsius. But instead the summary documentation shows -10.0. There is now no public record of -10.4 degrees Celsius.

The summary for Goulburn for Sunday 2 July 2017 incorrectly shows the minimum as -10.0 degree Celsius. It would be inconsistent with global warming theory for the current record to be smashed by a whole 1.3 degree Celsius. So, the Bureau homogenise the temperature record, changing the actual measurement to something more consistent with their perception of how reality should be – with what temperature should be.

I would have the managers at the Bureau put in the Goulburn jail.

*****

Update 9pm Tuesday evening

So, the Bureau has now acknowledged that it really was -10.4 degree Celsius at Goulburn on Sunday morning, and corrected the ‘Daily Weather Observations’ page for Goulburn.

By Tuesday evening this ‘Daily Observations’ sheet had been corrected, now showing -10.4 degree Celsius for Goulburn on Sunday morning.

However, the Bureau has so far not updated the key CDO Online database, the official record of temperatures for Goulburn airport.  This is the dataset used to calculate regional, national and global temperatures.  Rather than replace the bogus -10.0 degree Celsius with the correct -10.4, they are leaving a blank.   Not good enough.

*****

Update 6am Tuesday 10 July 

The following screenshot is provided as further evidence that the Bureau’s ‘quality control’ changed the actual reading of -10.4, to -10.0 which was then entered into the CDO database.  After protests the -10.0 value was removed and no reading recorded.  After more protests, the correct value of -10.4 was inserted.  This is unprecedented.

In this screenshot, taken on the morning of Tuesday 4 July, the bogus value of -10.0 has been entered into the CDO database.

It was not until two days later that the correct value was inserted, as shown in the following screen shot – taken this morning.

Filed Under: Information, Uncategorized

Australia’s Hottest Day on Record Ever – Deleted

February 13, 2017 By jennifer

The last few days have been very hot across eastern Australia. The mainstream media have been reporting ‘unprecedented’ conditions. This fits a popular narrative, but its inconsistent with the original historical record.

It was very hot in Australia in the late 1800s and the early years of the 1900s, particularly in outback Australia – at places like Bourke. Many of the extremely hot days were recorded using non-standard equipment, and so they are not recognised by Australia’s Bureau of Meteorology. Outrageously though, the Bureau has deleted from the raw digitised record the hottest day ever recorded in standard equipment at an official weather station. Ostensibly, because it was recorded on a Sunday – the day that the temperature-recorders normally had off in the days of manual temperature recordings.

No doubt the fellow who recorded temperatures from the thermometer in the Stevenson screen at the Bourke post office got up on the morning of Sunday 3rd January 1909, and decided he was going to work anyway. He was not going to miss what did turn out to be the hottest day of the century.

So, when I went to the trouble of getting access to the log book, now held by the National Archives of Australia, I could see that the fellow had not only written in 125 degree Fahrenheit (equivalent to 51.6 degree Celsius) – he had also underlined it!

I took a photograph of the entry, Exhibit 1.

Exhibit 1. Photograph from log book of temperature recording as made at Bourke post office in January 1909.   Photograph taken by Jennifer Marohasy at National Archives of Australia, Chester Hill reading room, on 26 June 2014.
Exhibit 1. Photograph from log book of temperature recording as made at Bourke post office in January 1909. Photograph taken by Jennifer Marohasy at National Archives of Australia, Chester Hill reading room, on 26 June 2014.

Back then the person who recorded the temperatures each day, known as the ‘Observer’, was not the same person who compiled the ‘Abstract of Results’ at the end of the month. This supervisor (who used a red pen) sometimes made changes to temperatures as recorded by the Observer; and seems to have been initially confused as to the actual temperature on Saturday 2nd January 1909 at Bourke (originally changing it from 112 to 125).

Exhibit 2. 'Abstract of Results' page from the log book.   Photograph taken by Jennifer Marohasy at the National Archives of Australia, Chester Hill reading room on 26 June 2014.
Exhibit 2. ‘Abstract of Results’ page from the log book. Photograph taken by Jennifer Marohasy at the National Archives of Australia, Chester Hill reading room on 26 June 2014.

The supervisor was clear in his summary though, writing in red that the highest temperature at Bourke for the month of January 1909 was 125 degree Fahrenheit recorded on 3rd January, as shown in Exhibit 2.

But if you go to the raw temperature data at the Australian Bureau of Meteorology’s website, there is no entry for this date, as shown in Exhibit 3.

Exhibit 3.  The 'raw data' as archived at the Bureau of Meteorology website has no entry for 3 January 1909.
Exhibit 3. The ‘raw data’ as archived at the Bureau of Meteorology website has no entry for 3 January 1909.

****

If you like what I do, consider making a goodwill contribution.

Filed Under: Information Tagged With: Temperatures

Homogenisation Used to Embed Artificial Warming Trend in Colorado Temperature Record

January 22, 2017 By jennifer

After looking at hundreds of temperature series from different locations across Australia, I’ve come to understand that only cities show the type of warming reported by the IPCC, and other such government-funded institutions. Much of this warming is due to what is known as the Urban Heat Island (UHI) effect: bitumen, tall-buildings, air-conditioners, and fewer and fewer trees, means that urban areas become hotter and hotter.

For example, in a recent study of temperature variability and change for south-east Australia it is evident that maximum temperatures in the cities of Melbourne and Hobart are increasing at a rate of about 0.8 degree Celsius per century; while the rate of increase at the nearby lighthouses is half of this.

While the trend of about 0.4 degree Celsius per century at the lighthouses – as shown in Chart 1 – is arguably an accurate record of temperature change, the Australian Bureau of Meteorology changes this. To be clear, the Bureau changes a perfectly good temperature series from Cape Otway lighthouse by remodeling it so that it has Melbourne’s temperature signal – all through the process of homogenisation.

In developing the series for south-east Australia, I combined the longest continuous series from rural and urban locations and also lighthouses.  The trends from these locations is very different: the cities are effected by UHI, the rural locations by floods and droughts, while lighthouse temperatures reflect the maritime influence.
In developing the series for south-east Australia, I combined the longest continuous series from rural and urban locations and also lighthouses. The trends from these locations is very different: the cities are effected by UHI, the rural locations by floods and droughts, while lighthouse temperatures reflect the maritime influence.

Government agencies in the USA have done exactly the same thing to temperature records for Colorado. This is all explained in detail in this new video by Monte Naylor:
 
https://vimeo.com/196878603/b9ea716a74

The video runs for about 40 minutes, and is quite technical.

The conclusions from this study have been summarized by Monte as follows:

(1) The USHCN Fort Collins station temperature record was not recognized by NOAA as having the heat bias from expanding UHI which has been easily identified by other researchers.

(2) NOAA’s homogenization program adjusted the USHCN Boulder station temperature history in a fashion that does not match any of the four other nearby rural/suburban long-term temperature histories. Nor does the NOAA-homogenized Boulder temperature history resemble the average temperature trend found by this study.

(3) NOAA’s homogenization program adjusted the Boulder temperature history to resemble the UHI-contaminated temperature history of the Fort Collins station.

(4) The best estimate of the northern Colorado Front Range temperature trend is obtained by using the TOB-adjusted Group of 5 average which shows a warming temperature trend of 1.7 °F (0.95 °C) from 1900 to 2015. The NOAA temperature trend, about 4 °F over 115 years, is more than twice the best estimate of this study.

(5) About 70% of the warming shown in the Group of 5 average temperature trend occurred before 1932. Temperatures trends of recent decades do not show anomalous warming.  Distinct warm temperature events occurred in the 1930’s and 1950’s that were much warmer than those observed since the turn of the 21st century.

(6) The Northern Front Range Group of 5 average temperature trend does not increase in a fashion consistent with increasing atmospheric carbon dioxide.

This chart compares the homogenised-temperature trend with a trend based on simple statistical averaging - both series are purported to represent climate variability and change for the Northern Colorado Front Range, 1900 to 2015.
This chart compares the homogenised-temperature trend with a trend based on simple statistical averaging – both series are purported to represent climate variability and change for the Northern Colorado Front Range, 1900 to 2015.

Filed Under: Information Tagged With: Temperatures

Somewhat Contrived: The Bureau’s Approach to Calculating Warmest Years

January 6, 2017 By jennifer

Media reports yesterday claimed that 2016 was another record hot year. However, close scrutiny of all the temperature data from the state of Victoria paints quite a different picture. When all 289 temperature series from Victoria are simply combined, the hottest years are in the early part of the record. In particular, 1914 is very evidently the hottest year on record – see blue time series in Chart 1. This finding builds on a recently published book chapter focused on south-east Australia, and is part of a larger study working towards a realistic reconstruction of Australia’s temperature history.

Chart 1. Two temperature reconstructions for the state of Victoria (blue and red lines), and also a reconstruction for the south-east of Australia (green line) – showing annual mean maximum temperatures from 1910. The three time-series are based on very different methodologies, and show a high degree of inter-annual synchrony – but very different overall temperature trends. The different methods used to construct these three series, and the resulting statistics, are detailed in Table 1.

Yesterday the Australian Bureau of Meteorology released its Annual Climate Statement, claiming 2016 to be the fourth-warmest year on record for Australia – and also an unusually wet year. Wet years are usually much cooler years, but because the overall trend in the ACORN-SAT* time series shows significant warming, even a wet year comes out as relatively hot.

Of course there is no one place in Australia where the average temperature can be measured; so the Bureau relies on a reconstruction to determine how hot 2016 was, relative to the historical record. Their method, however, is quite subjective in terms of choice of locations to include, the method used to remodel the individual temperature series before they are combined (this is refered to as homogenisation*), and the area weighting applied – with the weighting changing on a daily and monthly basis.

Late last year, I had a book chapter, co-authored with John Abbot and published by Elsevier*, which shows historical temperature trends for south-east Australia from 1887 to 2013 based on a more transparent system – that can be easily replicated. We choose the longest continuous series, used the same series to calculate every value, and applied an area weighting based on topography and landuse – and did not remodel individual temperature series. In the chapter we conclude that temperature trends for south-east Australia are best described as showing statistically significant cooling (yes cooling) of 1.5 degree Celsius from 1887 to 1949, followed by warming of nearly 2 degrees Celsius from 1950 to 2013. The warmest year in this reconstruction is 2007, followed very closely by 1914.

A colleague at the University of Tasmania, Jaco Vlok, has compared our south-east reconstruction with a reconstruction based on all 289 temperature series for Victoria – but only from 1910. The different methodologies used to generate these reconstructions, and also the official ACORN-SAT series for Victoria, which is the series used by the Bureau to calculate the official statistics for Australia, are detailed in Table 1.

Table 1.  Statistics for the three temperature reconstructions, and contrasting methods used to construct the series.
Table 1. Statistics for the three temperature reconstructions, and contrasting methods used to construct the series.

There is a very high degree of synchrony between the reconstructions, though when all the raw data is simply combined – Vlok’s approach – the hottest years are all in the earlier part of the record: 1914 (hottest) followed by 1919, 1921, 1938, 1961 and then 2014.

Postscript: I have expanded on this analysis in an article just now published by Graham Young at OLO. Jennifer, Noosa, Monday 9th January, 2017.

_____

* ACORN-SAT stands for Australian Climate Australian Climate Observations Reference Network – Surface Air Temperature and is a dataset developed by the Bureau based on a subset of available temperature series, almost all homogenised, and then combined with an area weighting and used to report climate variability and change. The annual climate statement for 2016, based on this ACORN-SAT dataset, is here: http://media.bom.gov.au/releases/333/2016-a-year-of-extreme-weather-events/

* Homogenisation involves changes to measured temperature values ostensibly to correct for non-climatic variables. These changes to the observational data are quite different from quality assurance. For example, the need for homogenisation most often results from a ‘statistical test’ detecting a break point, these breakpoints often occur after a period of missing data. In response all values preceding the breakpoint are often reduced by a specific amount back to 1910. The amount by which the measured observational values are reduced is determined through the application of algorithms and calculated relative to what are referred to as ‘neighbouring’ stations, which may be Urban Heat Island (UHI) effected, and/or located many hundreds of kilometers from the target location.

* Marohasy, J. & Abbot, J. 2016. Southeast Australian Maximum Temperature Trends, 1887–2013: An Evidence-Based Reappraisal.  In: Evidence-Based Climate Science (Second Edition), Pages 83-99. http://dx.doi.org/10.1016/B978-0-12-804588-6.00005-7 You can read more about this series here: https://jennifermarohasy.com.dev.internet-thinking.com.au/2016/12/temperatures-trends-southeast-australia-1887-part/

Filed Under: Information Tagged With: Temperatures

  • « Go to Previous Page
  • Go to page 1
  • Interim pages omitted …
  • Go to page 19
  • Go to page 20
  • Go to page 21
  • Go to page 22
  • Go to page 23
  • Interim pages omitted …
  • Go to page 71
  • Go to Next Page »

Primary Sidebar

Recent Comments

  • Ian Thomson on Vax-ed as Sick as Unvax-ed, Amongst My Friends
  • Dave Ross on Vax-ed as Sick as Unvax-ed, Amongst My Friends
  • Dave Ross on Vax-ed as Sick as Unvax-ed, Amongst My Friends
  • Alex on Incarceration Nation: Frightened of Ivermectin, and Dihydrogen monoxide
  • Wilhelm Grimm III on Incarceration Nation: Frightened of Ivermectin, and Dihydrogen monoxide

Subscribe For News Updates

  • This field is for validation purposes and should be left unchanged.

November 2025
M T W T F S S
 12
3456789
10111213141516
17181920212223
24252627282930
« Jan    

Archives

Footer

About Me

Jennifer Marohasy Jennifer Marohasy BSc PhD has worked in industry and government. She is currently researching a novel technique for long-range weather forecasting funded by the B. Macfie Family Foundation. Read more

Subscribe For News Updates

Subscribe Me

Contact Me

To get in touch with Jennifer call 0418873222 or international call +61418873222.

Email: jennifermarohasy at gmail.com

Connect With Me

  • Facebook
  • LinkedIn
  • RSS
  • Twitter
  • YouTube

Copyright © 2014 - 2018 Jennifer Marohasy. All rights reserved. | Legal

Website by 46digital