• Skip to primary navigation
  • Skip to main content
  • Skip to primary sidebar
  • Skip to footer
Jennifer Marohasy

Jennifer Marohasy

a forum for the discussion of issues concerning the natural environment

  • Home
  • About
  • Publications
  • Speaker
  • Blog
  • Temperatures
  • Coral Reefs
  • Contact
  • Subscribe

Information

Heron Island Photo Check

November 24, 2021 By jennifer

I am seeking feedback, including comment and corrections, on this draft blog post. I have previously sent an email to Richard Vevers (1 October 2021) and placed a request for more information at the Catlin Survey website (20 April 2021), without receiving any response from either. Irus Braverman was kind enough to reply to my email (30 September 2021) indicating that the photograph used in her book Coral Whisperers was provided to her by Richard Vevers. 

If all science is either ‘physics’ or ‘stamp collecting’ as once suggested by Ernest Rutherford, I would argue that it is important that we not knowingly distribute fakes. 

Corals Healthy, Photograph Bleached – Draft 

Does it matter if the Internet is replete with fake photographs accompanying fake stories? Does it matter that these photographs keep children awake at night – worrying about climate change and the impending doom of our Great Barrier Reef? 

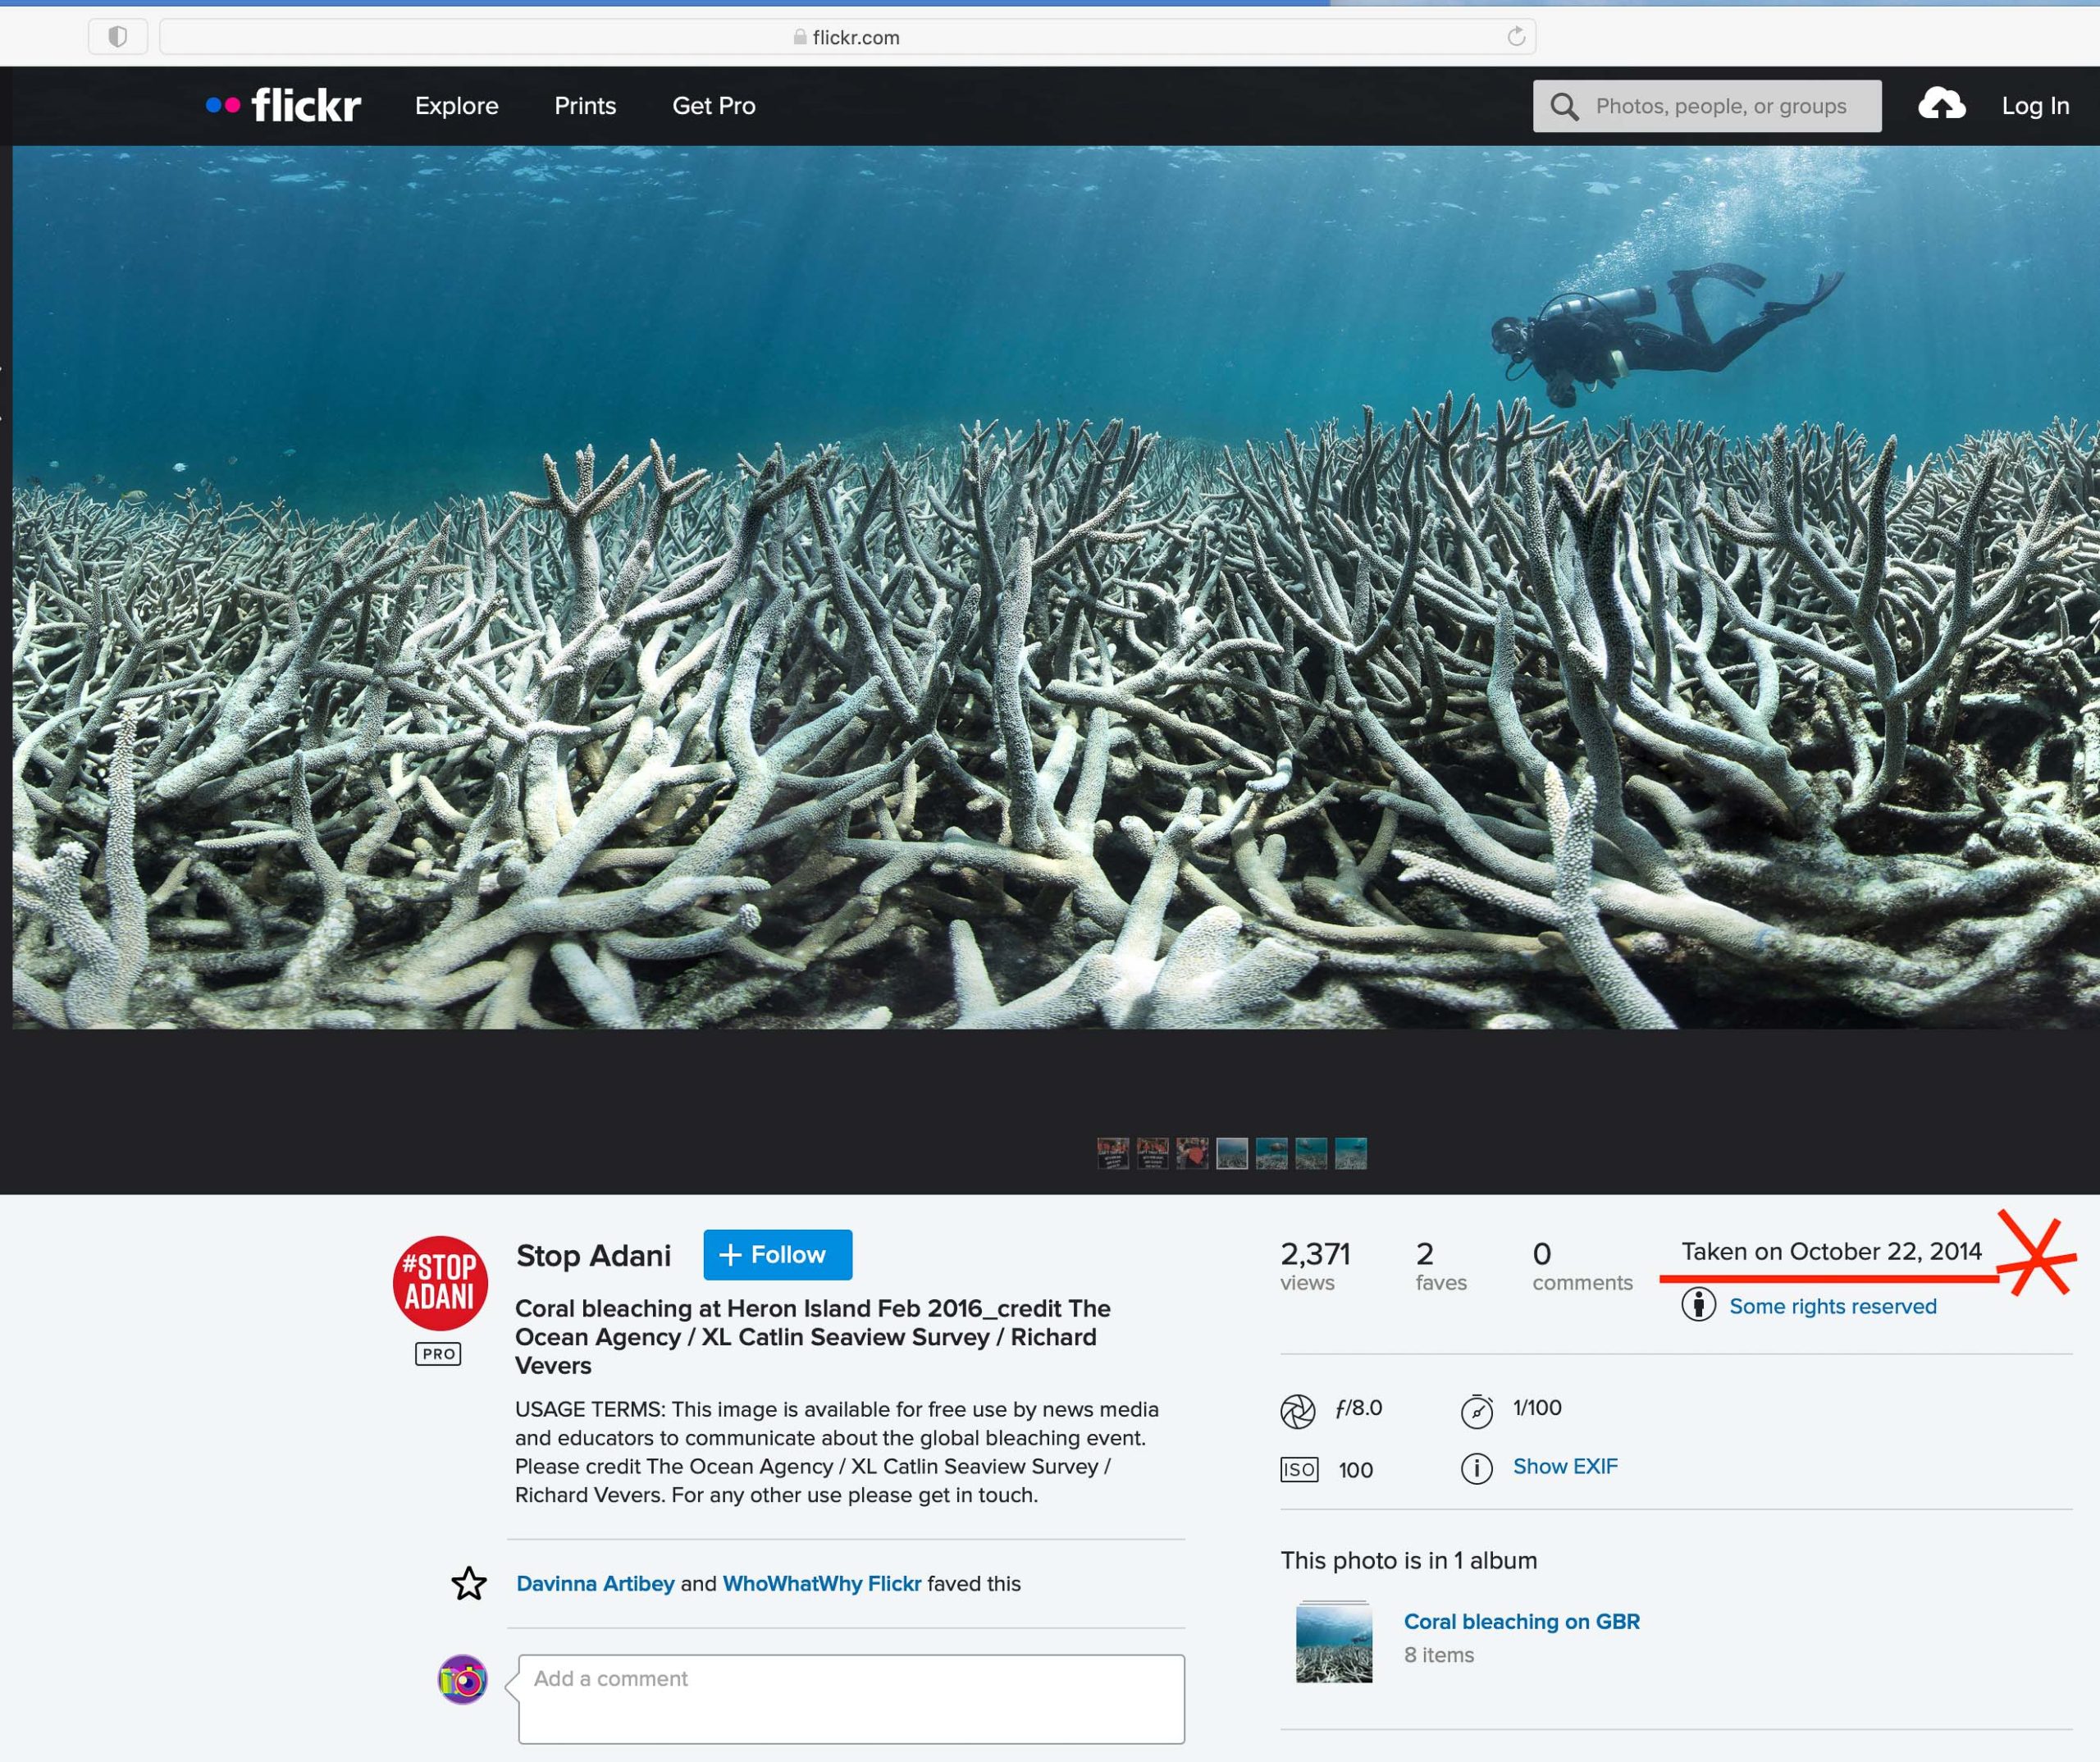
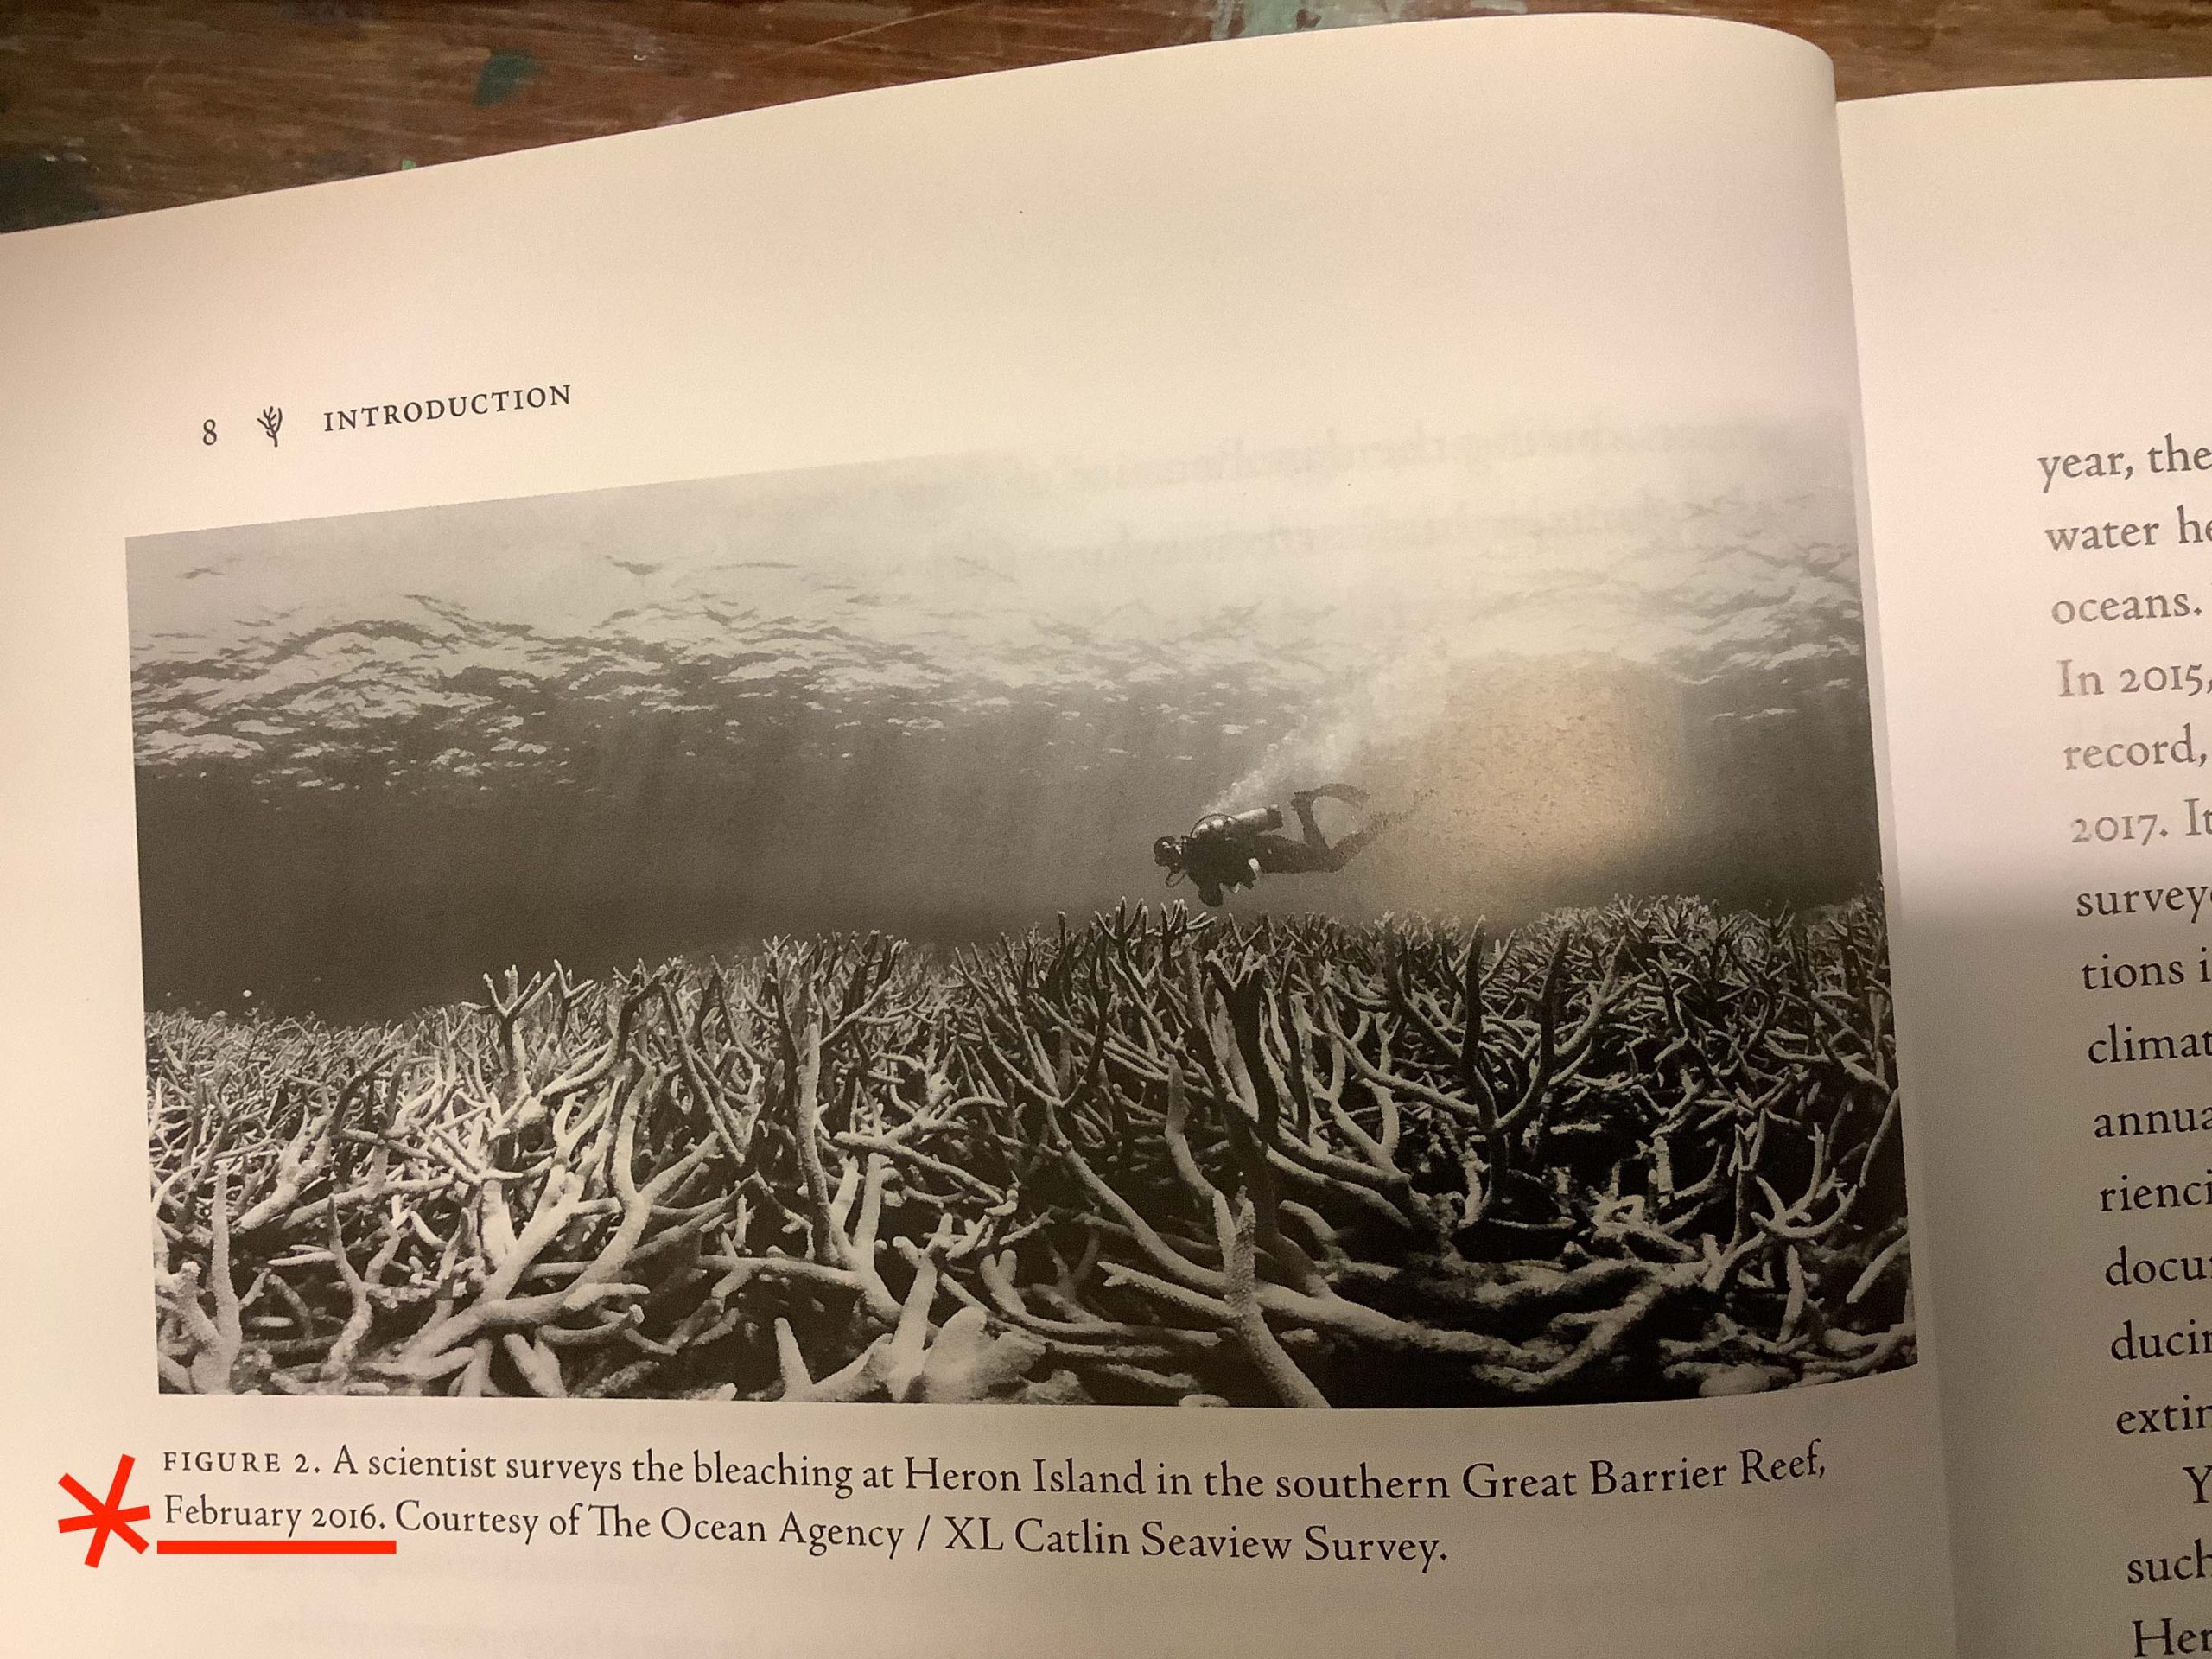
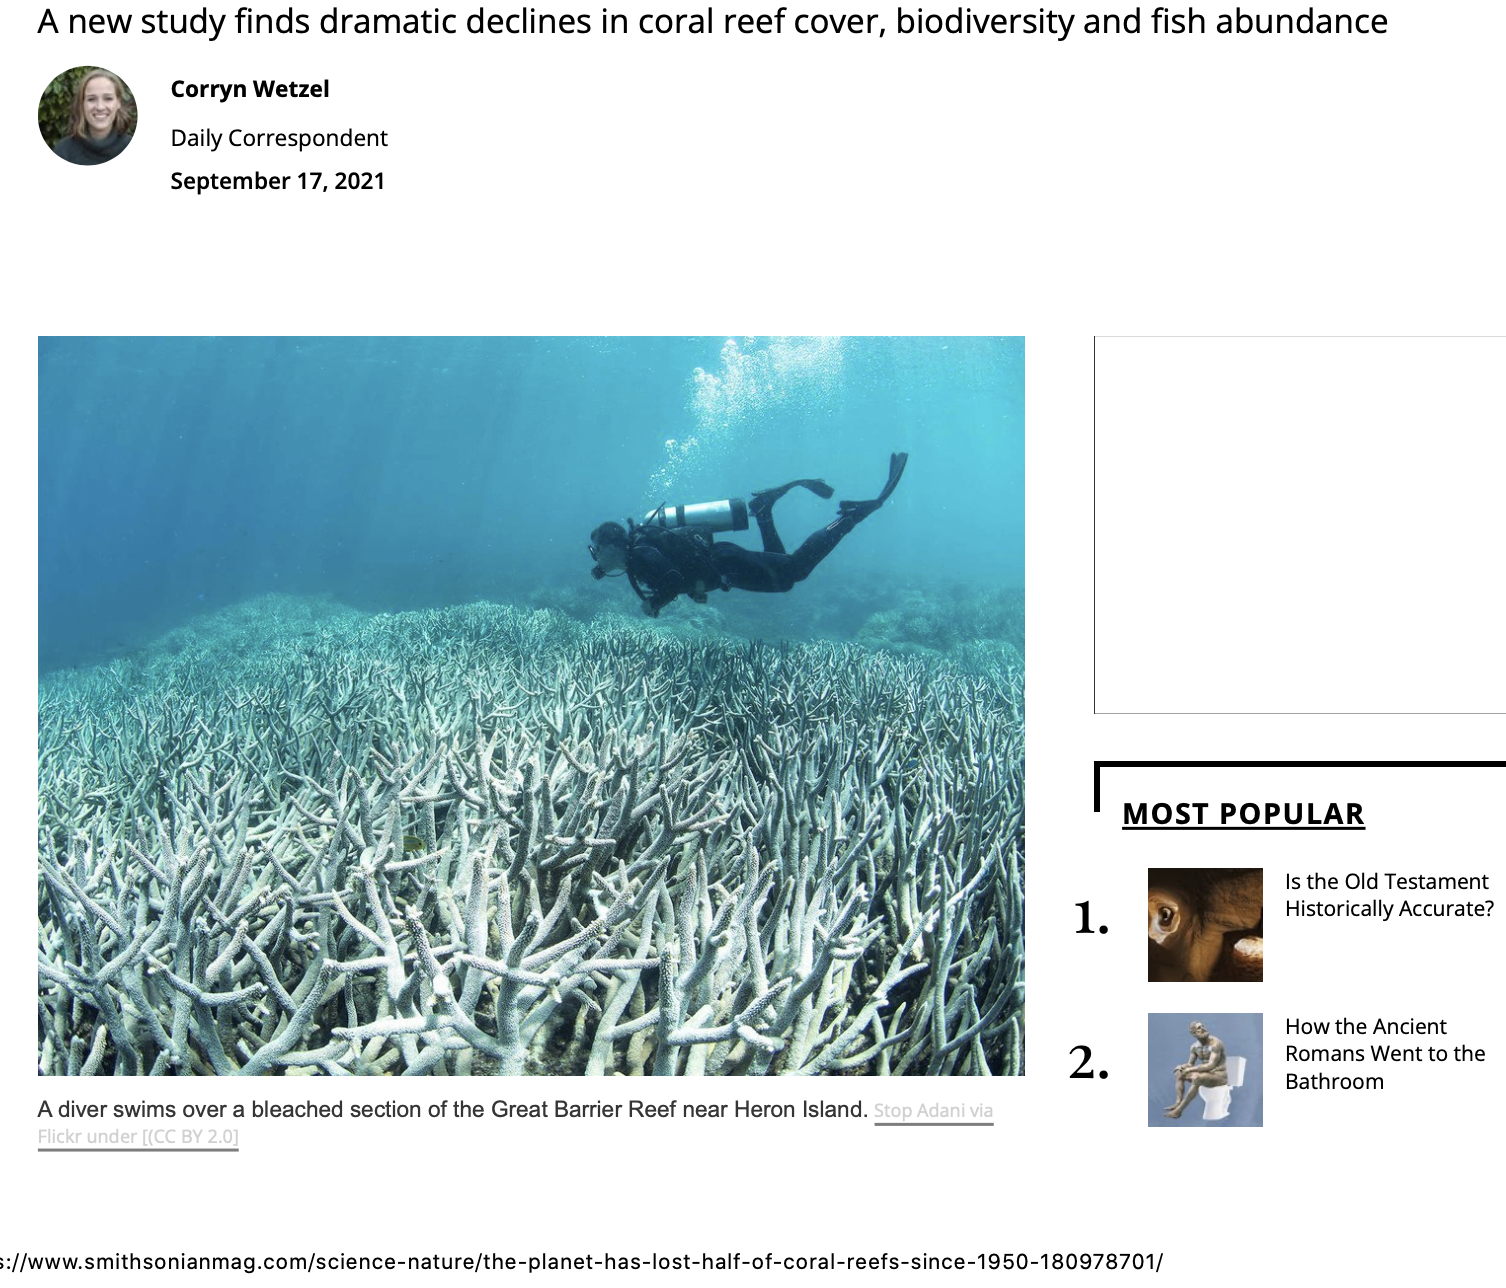
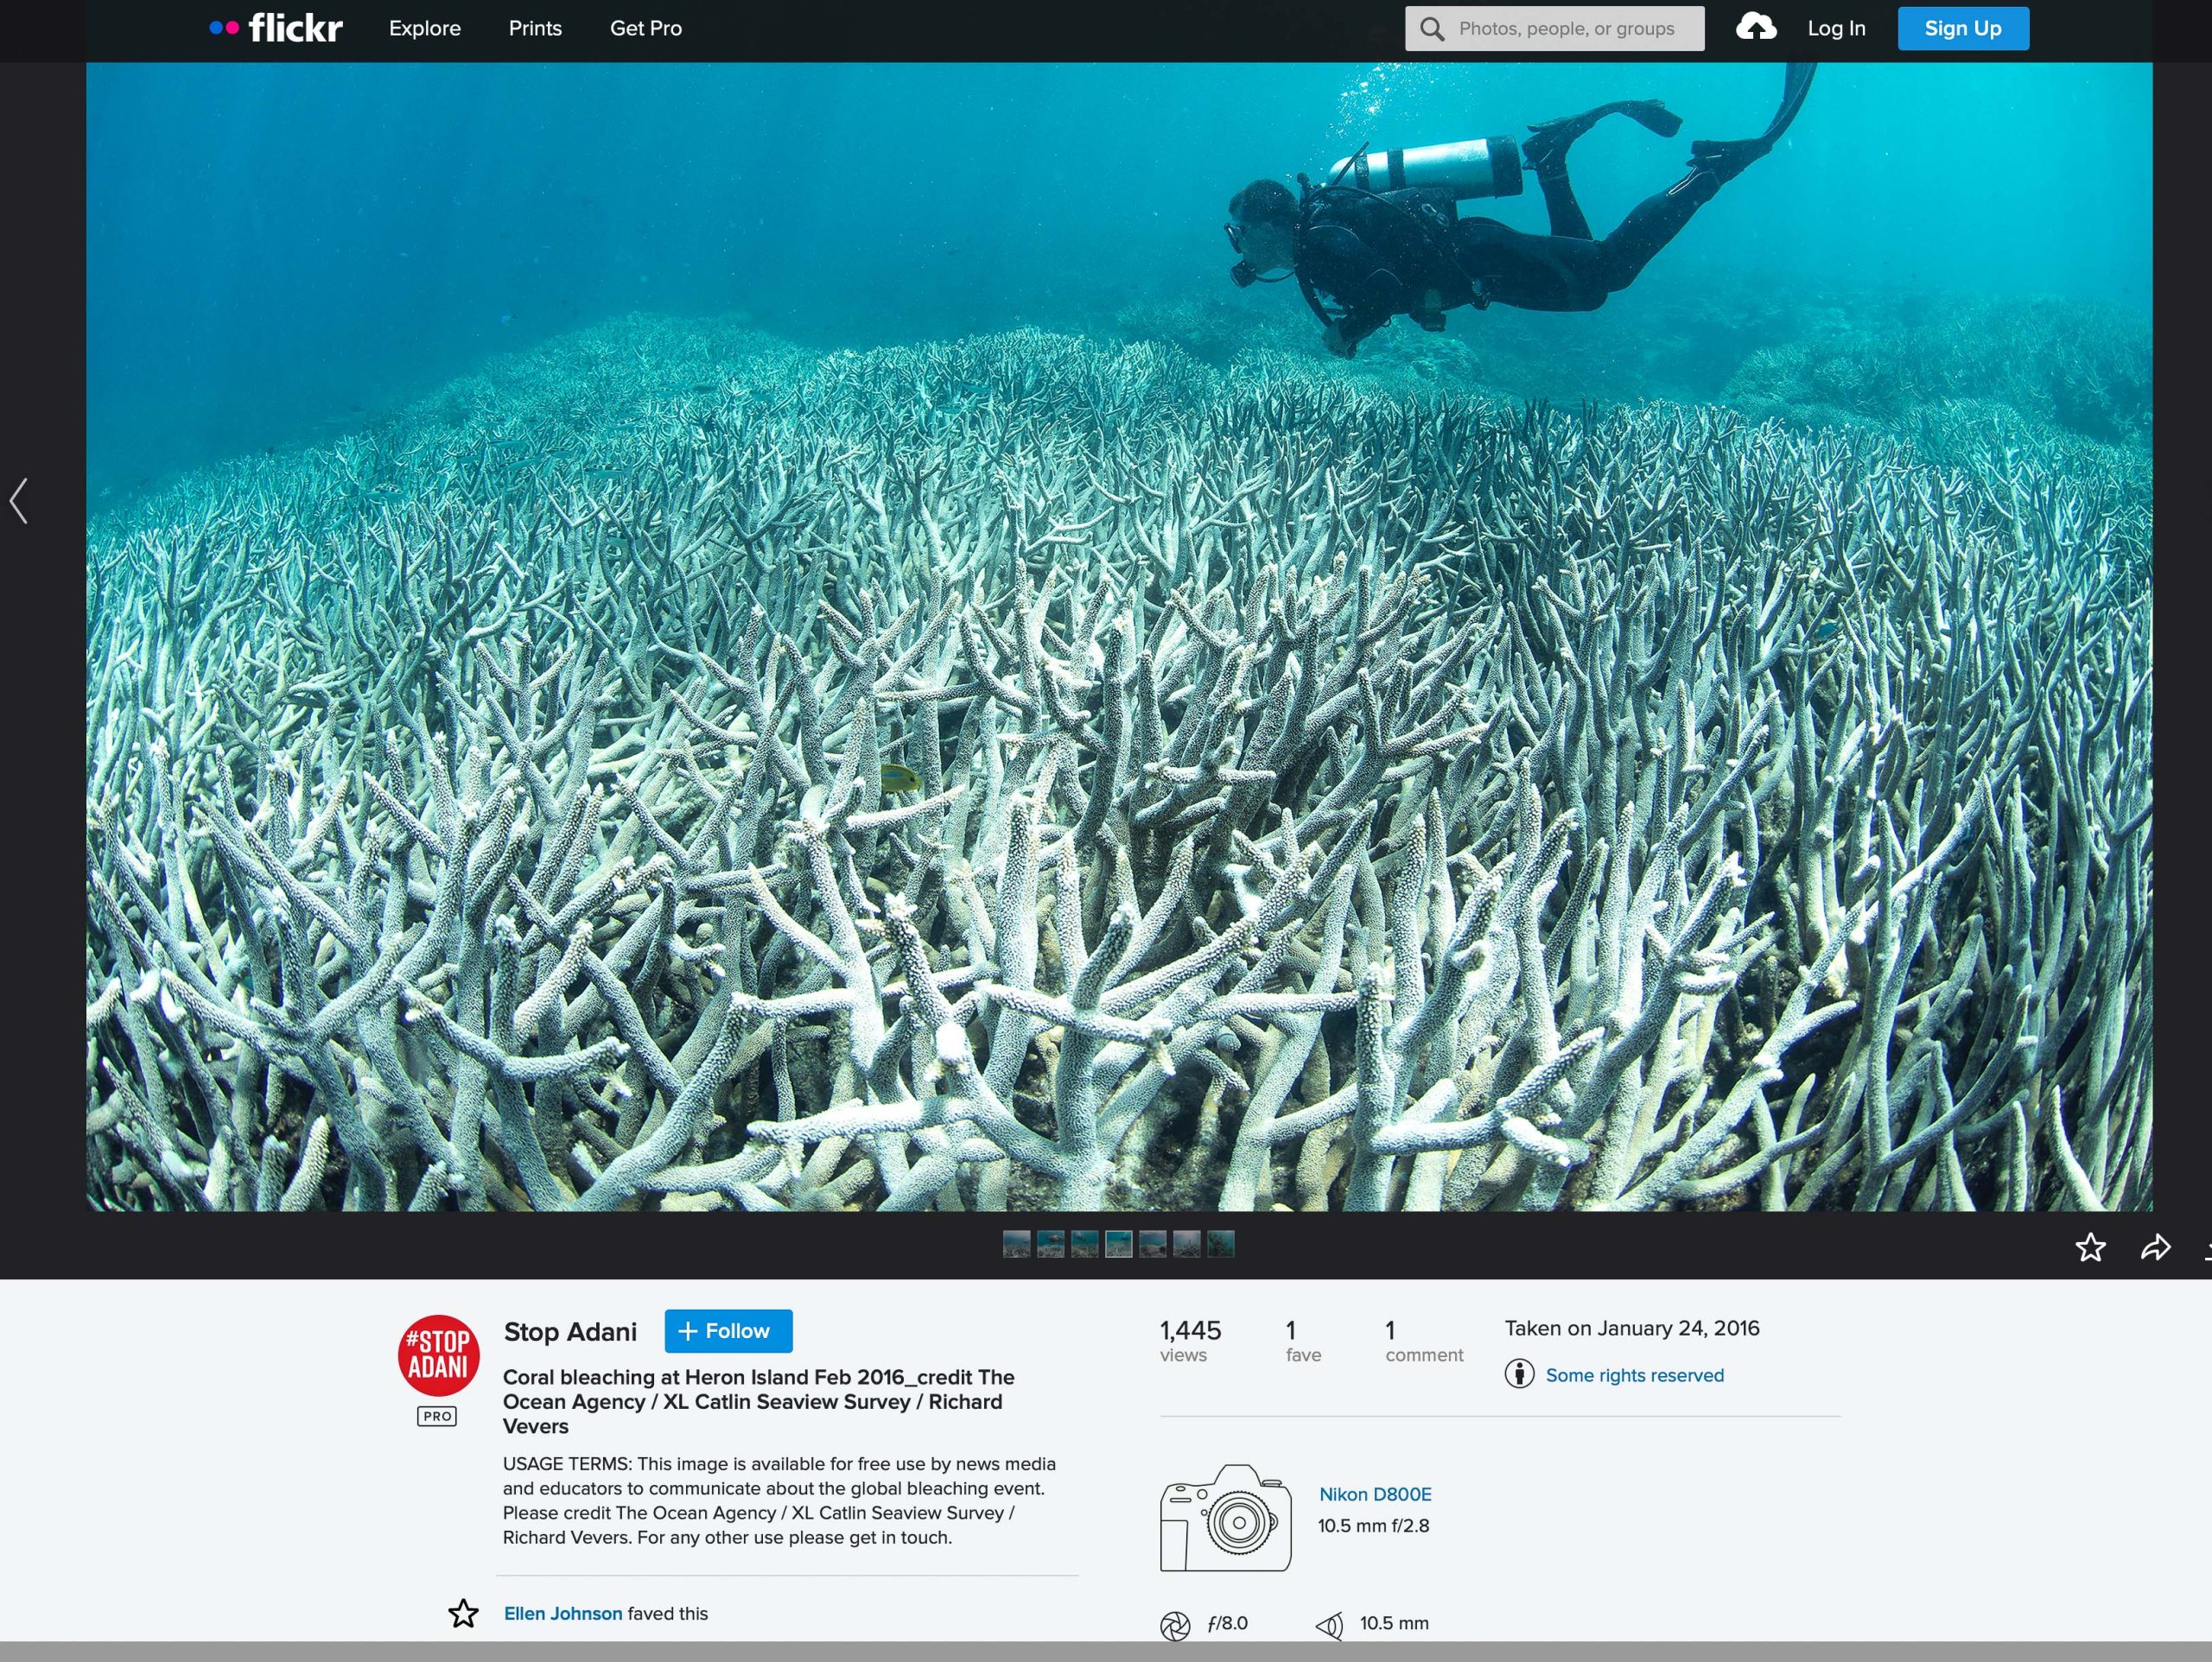
There is a photograph that has been promoted by Richard Vevers, the founder, and CEO of The Ocean Agency, a Washington-based international not-for-profit that is purportedly dedicated to marine conservation. It is described on his The Ocean Agency website as having been taken at Heron Island in 2015. On Flickr, the same photograph is described as having been taken in 2014, and in Irus Braverman’s book Coral Whisperers as having been taken in 2016. 

Screenshot from The Ocean Agency Website.  The red asterisk has been added by me, to draw attention to the date as indicated at this website.
Screen shot from Flickr website. Red underline added to draw attention to the date.
Photograph from Irus Braverman’s book. Red underline added, to draw attention to the date.

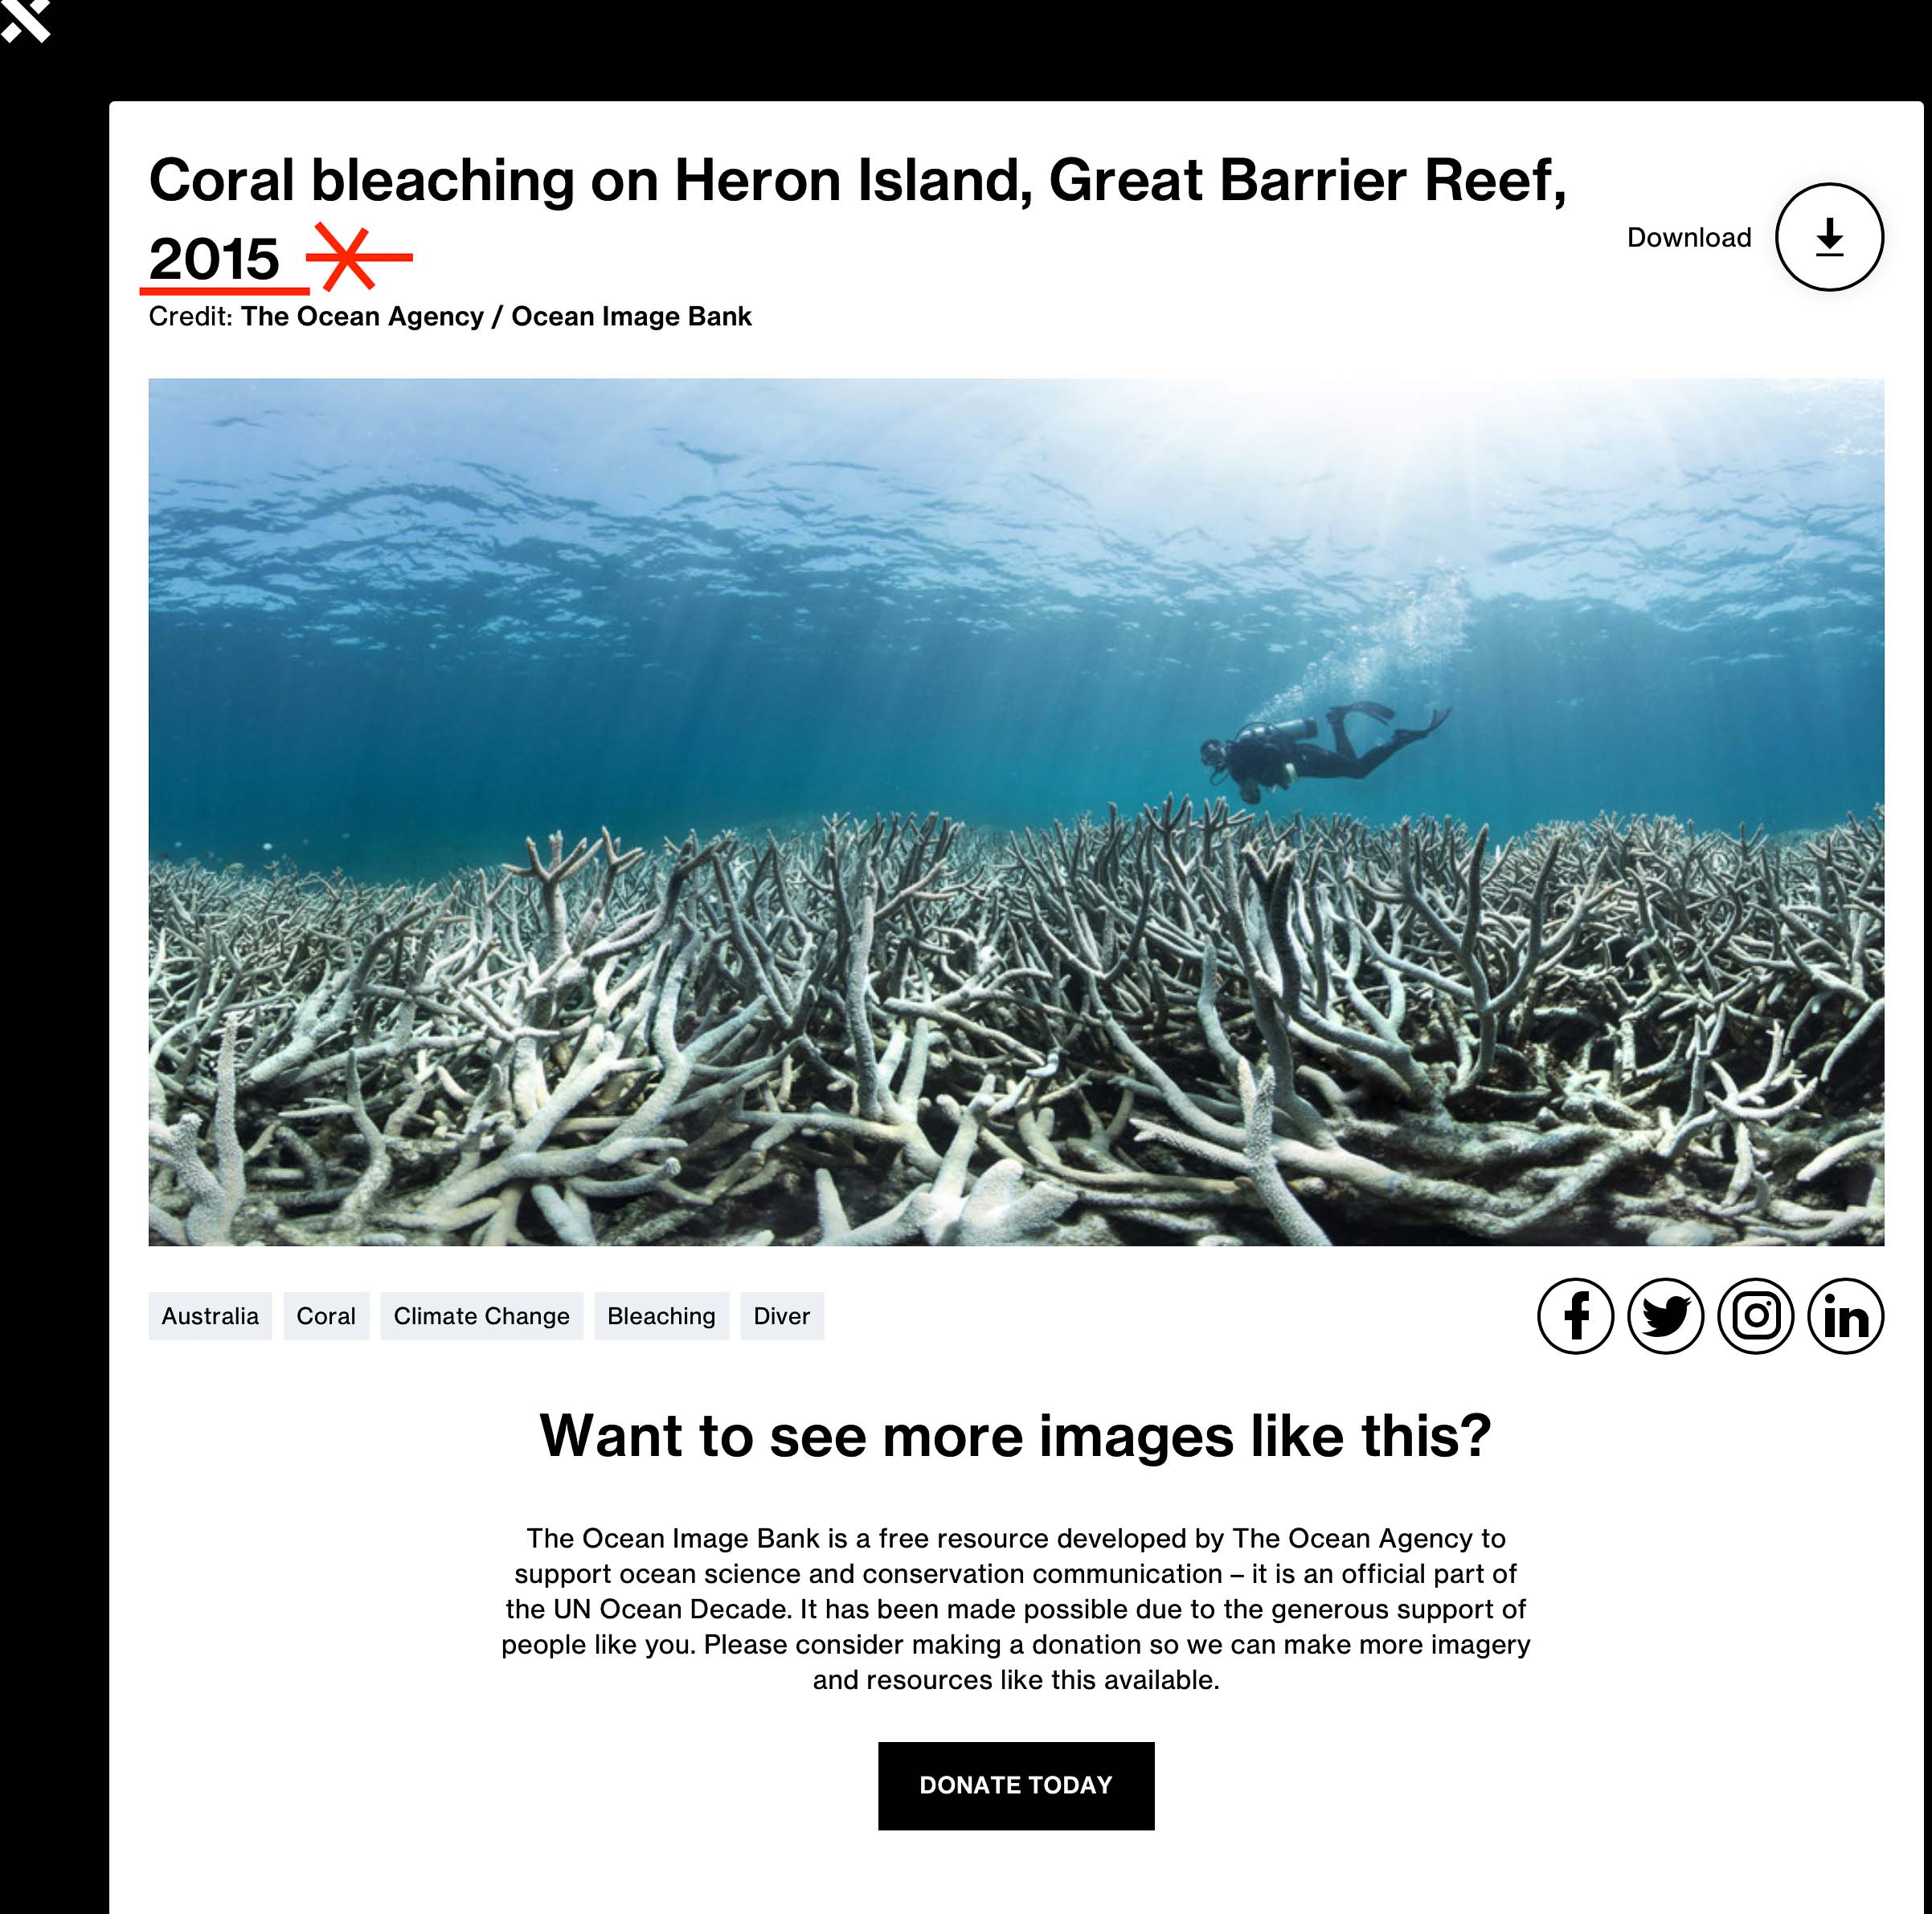
At least two of these photographs must be incorrectly labelled. 

It is the prestige associated with the XL Catlin Seaview Survey – touted as ‘the largest survey of the Great Barrier Reef ever undertaken’, ‘using unique SVII underwater camera systems’ and which commenced back in 2012 – that has given the photograph credibility.

The XL Catlin Seaview Survey was undertaken by The University of Queensland in partnership with Google, the International Union for the Conservation of Nature (IUCN), the United Nation’s Education, Scientific and Cultural Organisation (UNESCO), the United States’ National Oceanic and Atmospheric Administration (NOAA), and others. The expedition visited Heron Island on 4 November 2012. The photographs from this survey can be viewed online, but this photograph is not among them. 

According to the survey’s website, the XL Catlin returned to the Great Barrier Reef in 2014 following cyclone Ita, and again in 2016 following a mass coral bleaching. However, none of the 226,000 georeferenced coral reef survey images are publicly available from these expeditions.  

According to a different survey, which was an aerial survey undertaken in 2016 by Terry Hughes from James Cook University, it was mostly the northern section of the Great Barrier Reef that bleached in that year; however, Heron Reef, which is part of the southern Great Barrier Reef, did not bleach at all at that time.  

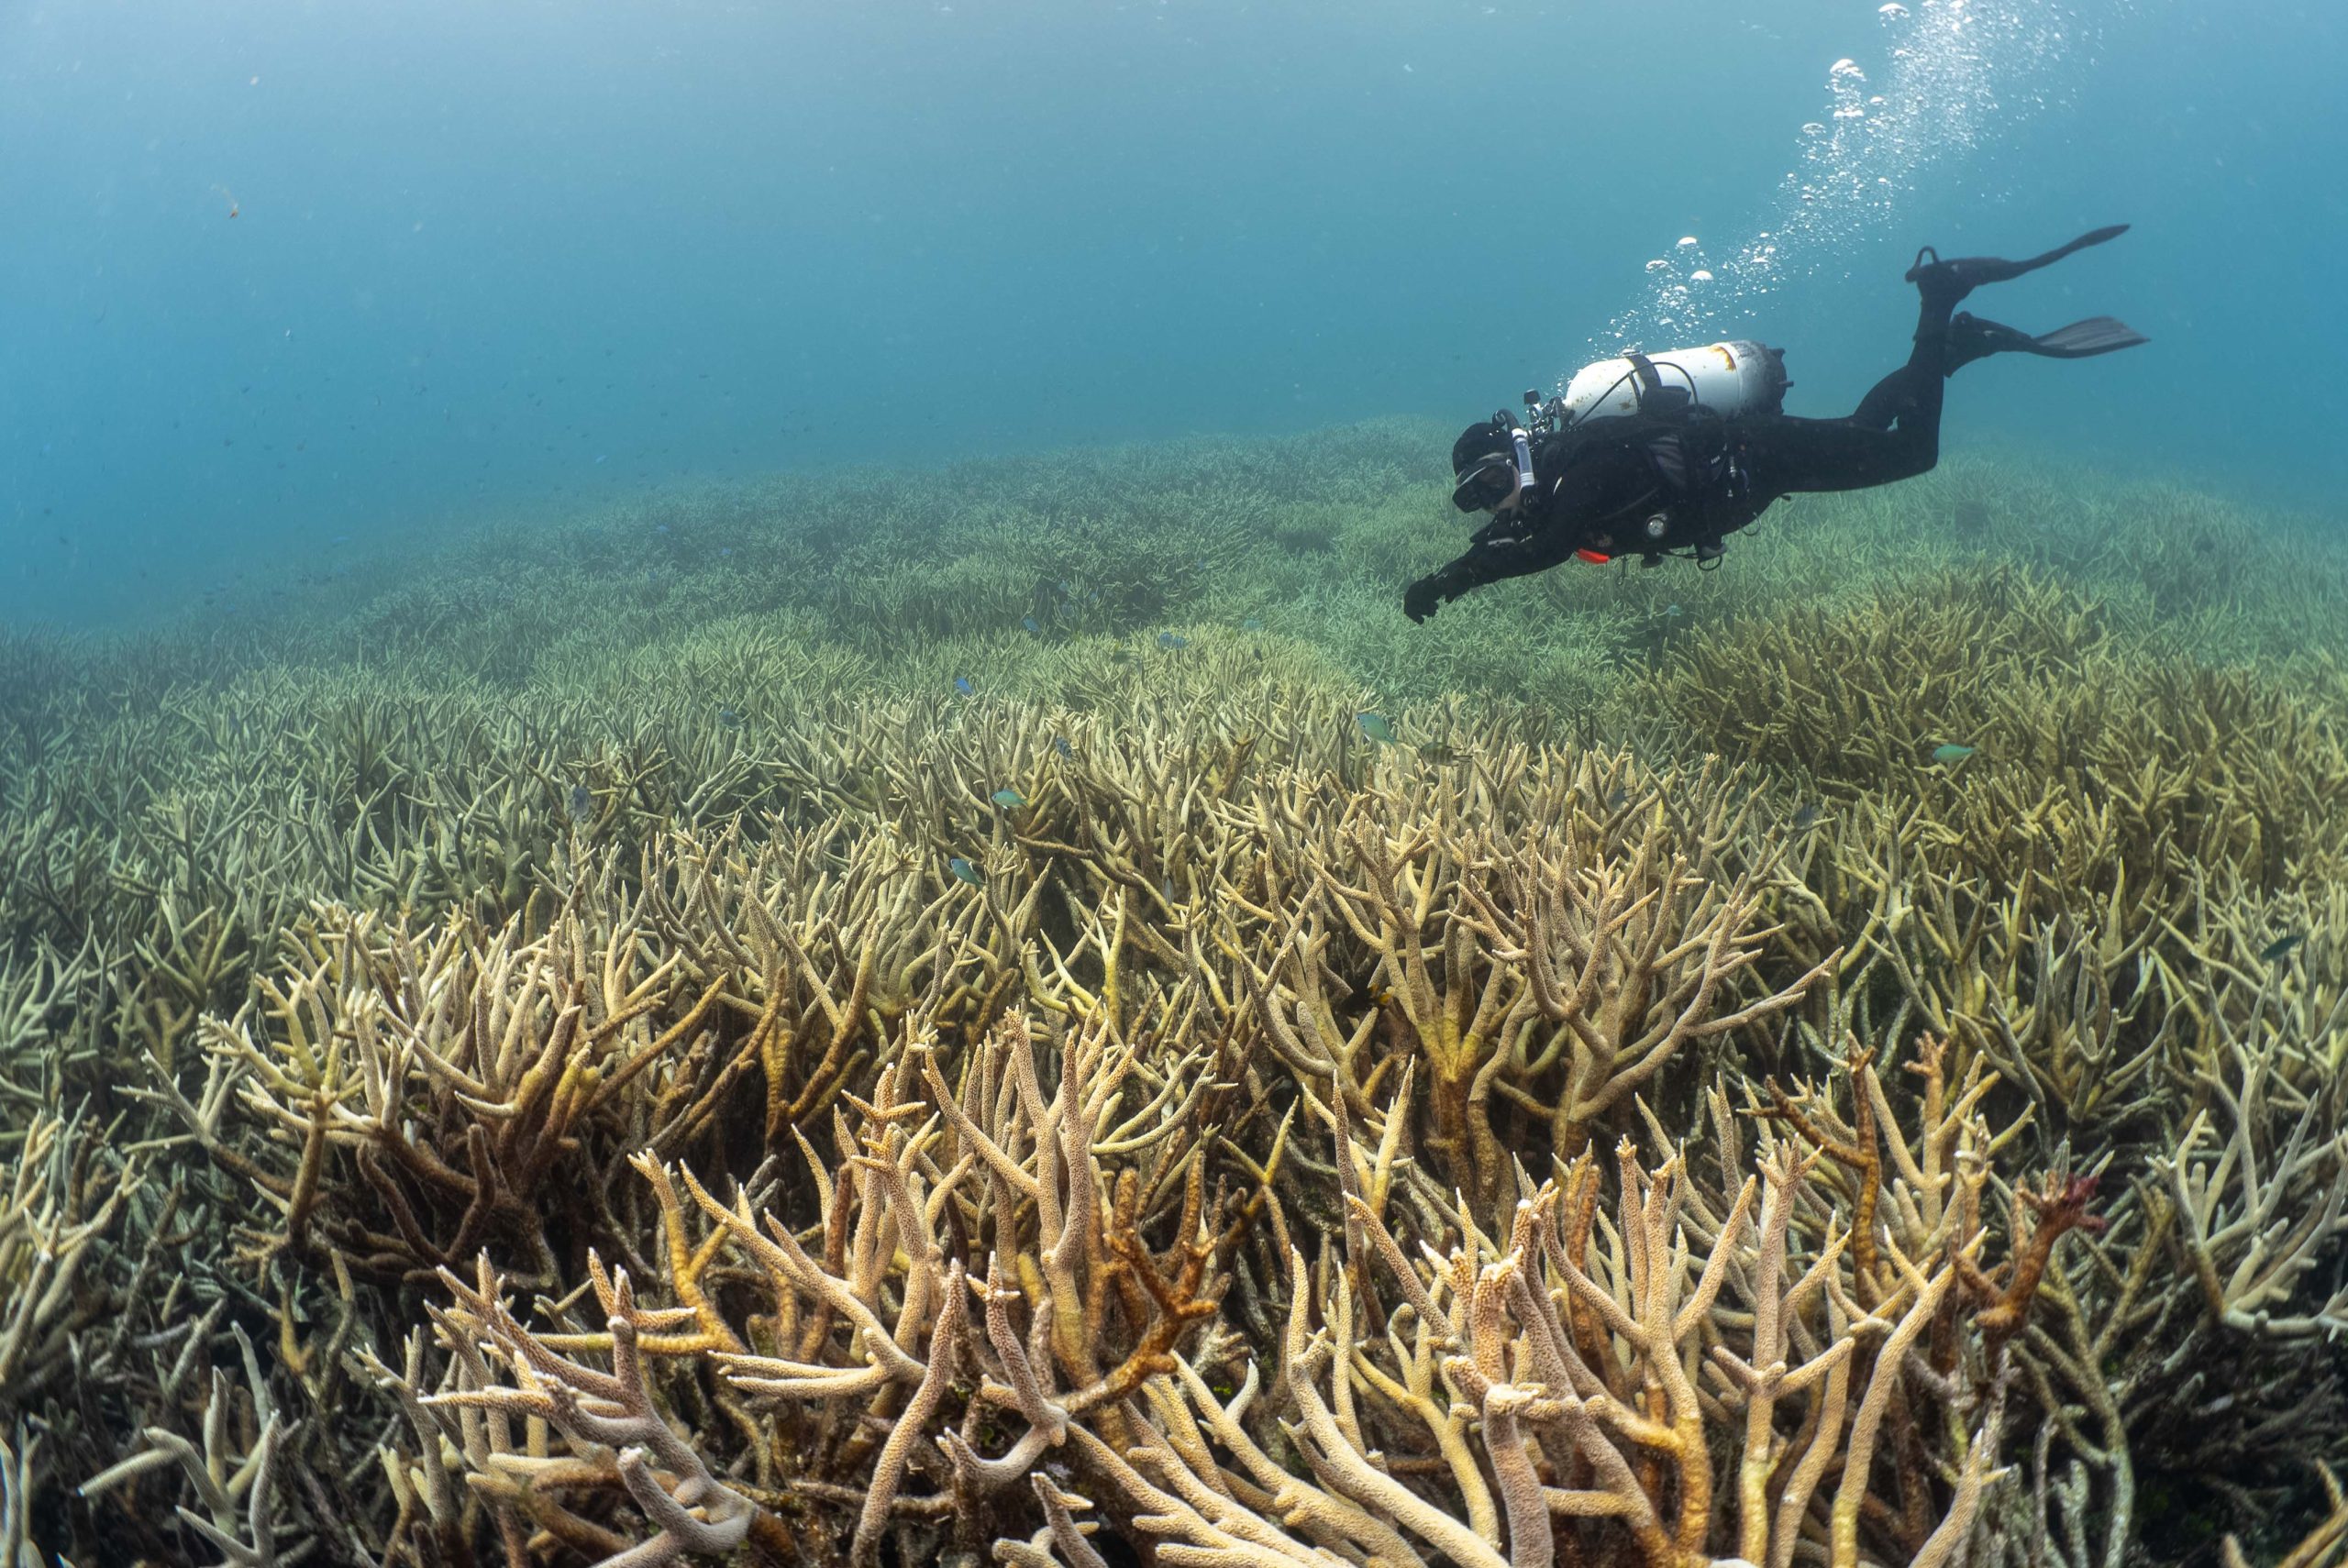
In fact, the photograph was almost certainly taken on 22 October 2014, and it is not coral bleaching that is being seen. I hypothesise that the corals appear bleached because the photograph has been taken through layers of water that absorb light in the red spectrum and/or because some of the colour has been stripped from the photograph in post-production. Either way, it is not fit for purpose; it cannot credibly be presented as evidence of coral bleaching at the Great Barrier Reef in 2016.

Vever’s organisation has the official endorsement of the United Nation’s Ocean Decade, and the photograph may have been promoted by him ostensibly to support ocean science and conservation, and as evidence of bleaching at Heron Island in 2016. But this doesn’t make the image a true likeness. In fact, the photograph fits all the criteria of being a fake. I believe it does not show coral bleaching and there was no mass coral bleaching at Heron Island in 2016, or in 2015 or 2014.

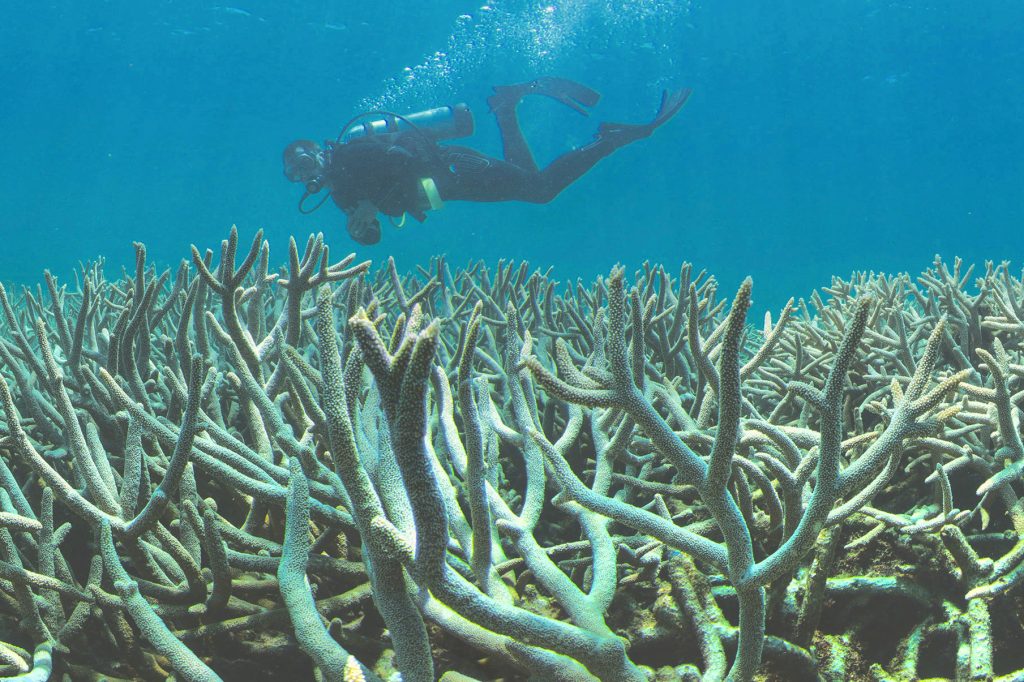
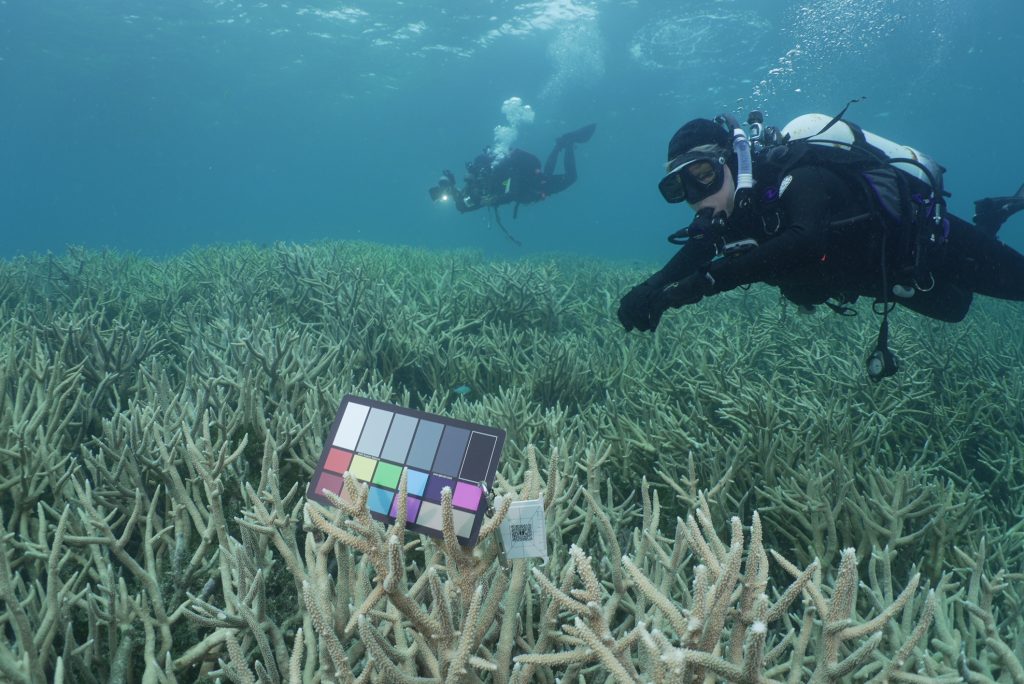
I visited Heron Island earlier this month (November 2021) with underwater photographers Stuart Ireland and Leonard Lim. There we found the fringing reef to be healthy, including the fields of staghorn coral. We didn’t have the ‘unique SVII underwater camera systems’, nor the endorsement and sponsorship of a university, or Google, or the United Nations, but I did have the sense to place a colour chart among the corals to facilitate correct white colour balance in post-production.  

Jen Marohasy (foreground) and Leonard Lim (background) with a colour chart above the fields of staghorn coral, Heron Reef, 9 November 2021.  Photo credit Stuart Ireland.
Jen Marohasy above the fields of staghorn corals, Heron Reef, 9 November 2021. Photo credit Stuart Ireland.

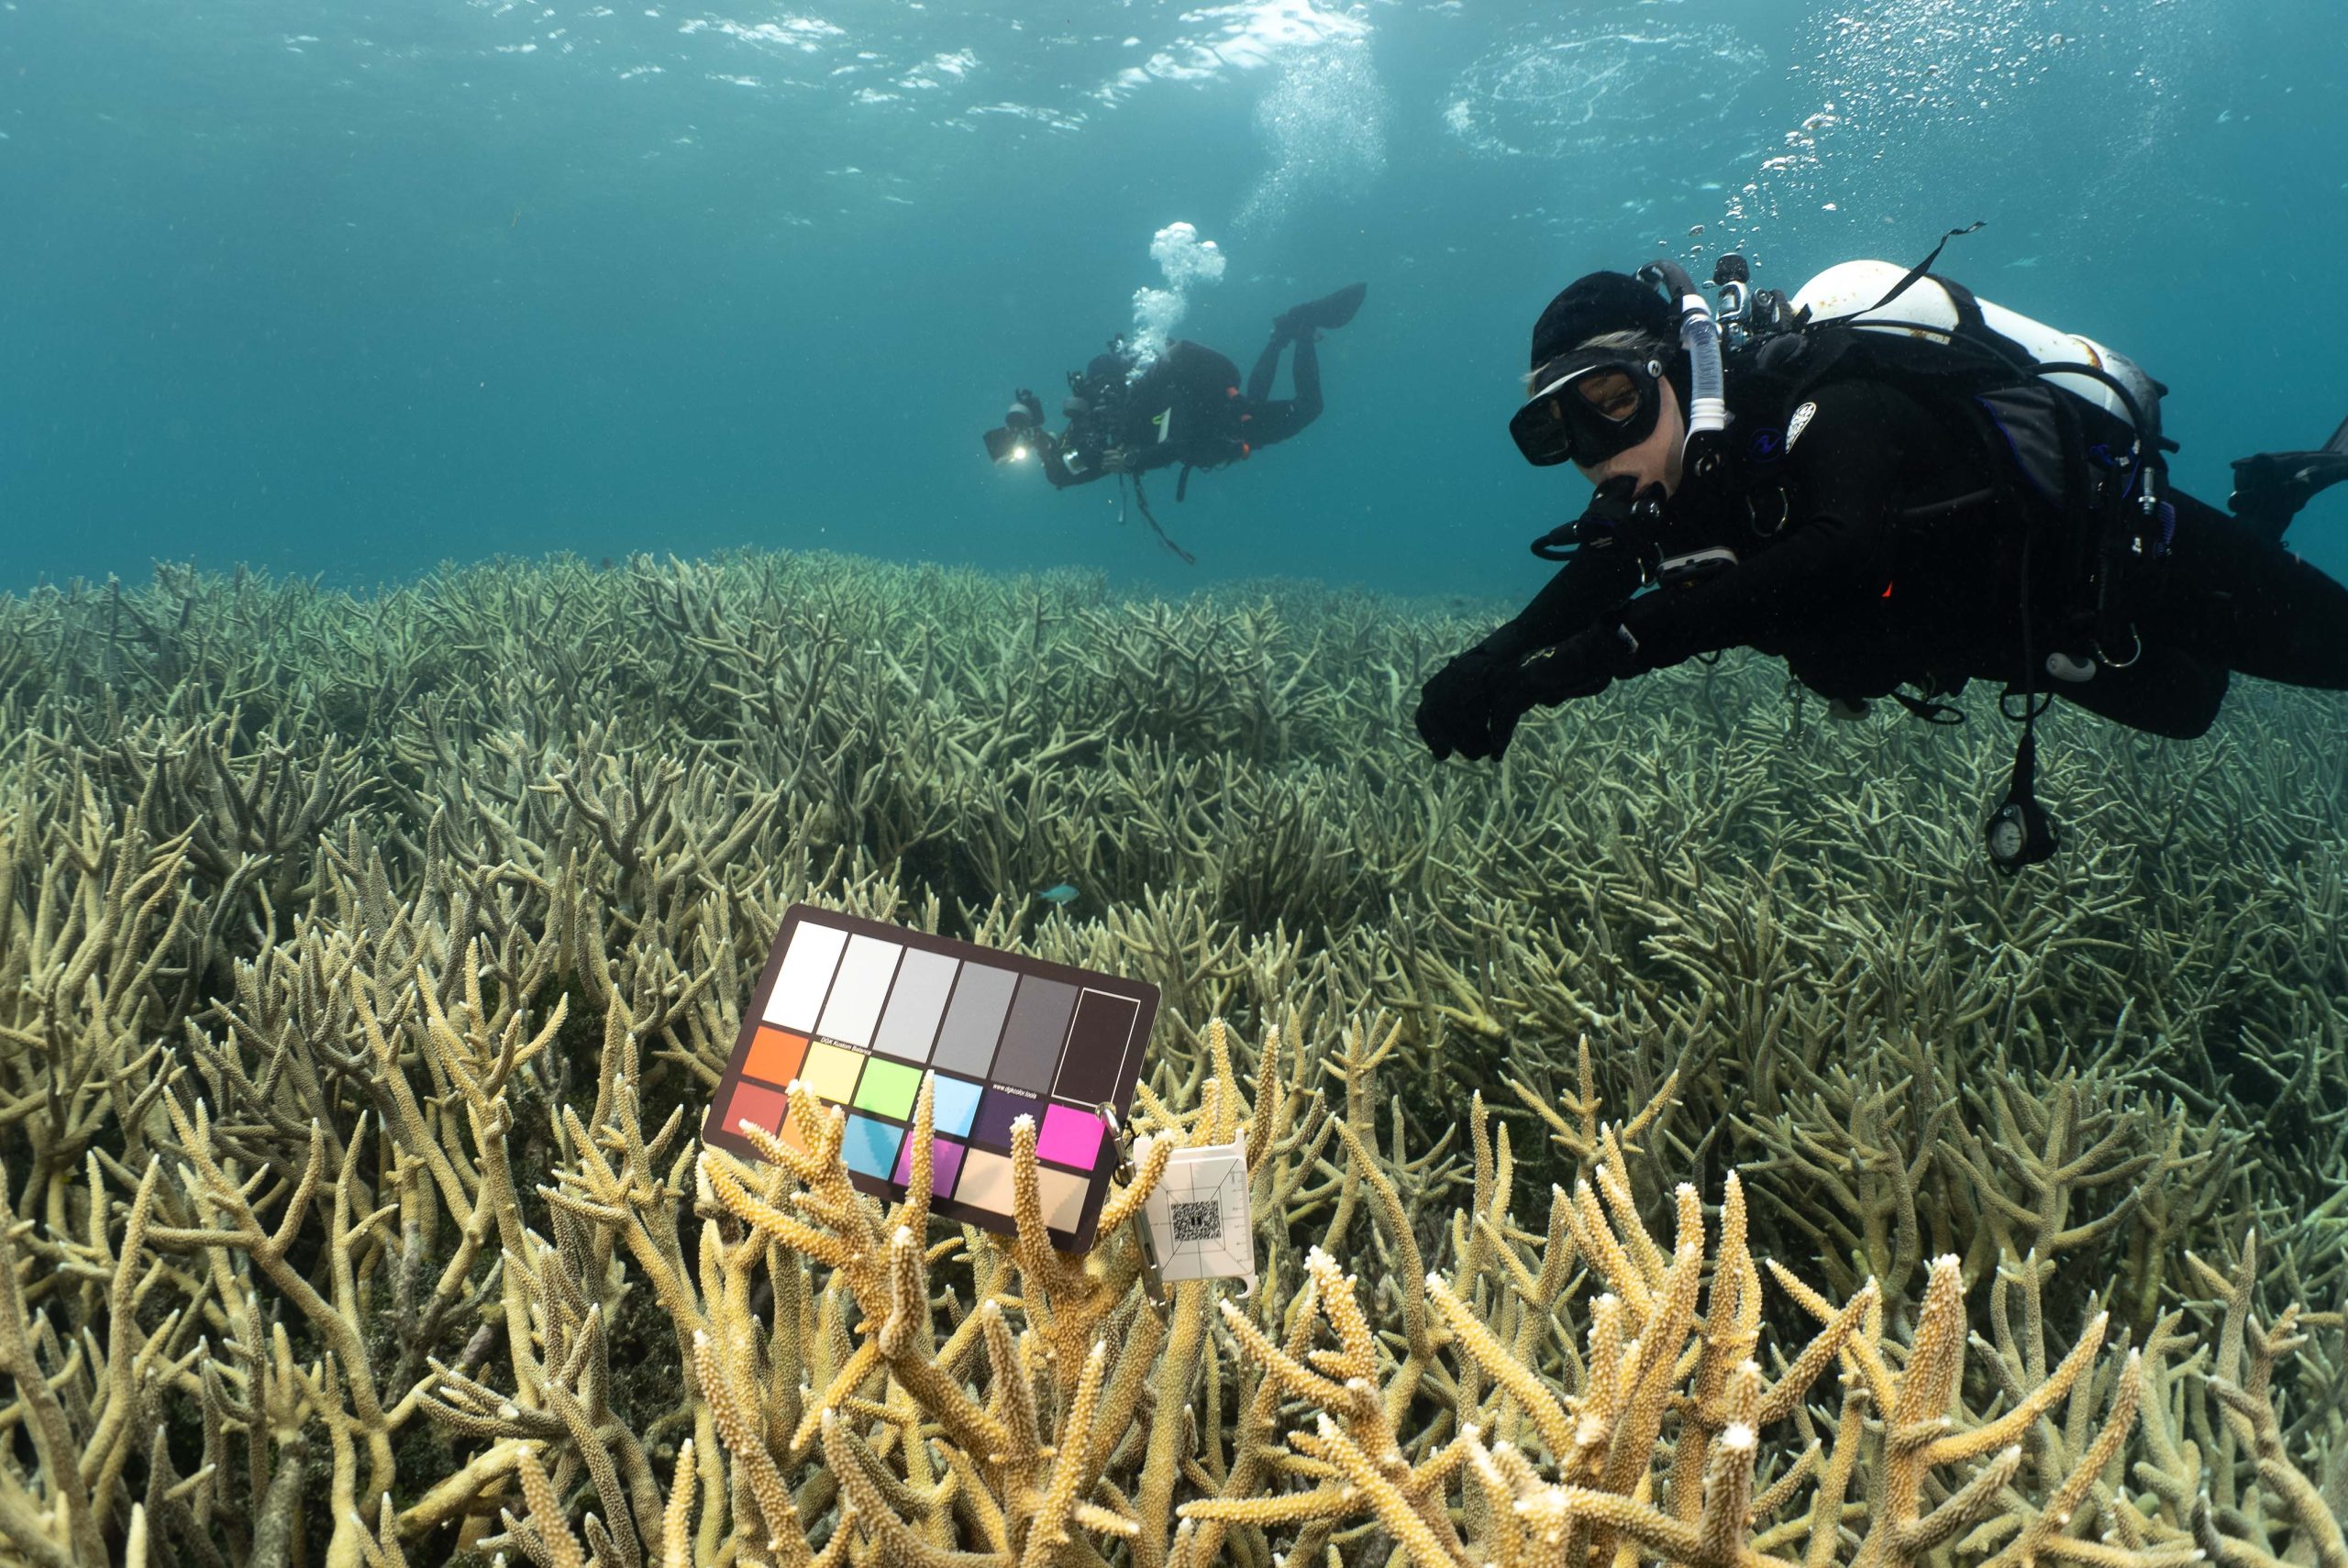
It is evident from our photographs, with the colour chart providing some quality assurance, that the fields of staghorn corals at Heron Island are not bleached – not this year anyway. Maybe next? 

Yet the XL Catlin Survey and Richard Vevers, via the Flickr website, continue to perpetuate the myth that they are bleached – most recently in the pages of the prestigious Smithsonian magazine.

Surely the children of the world deserve to know the truth about Heron Reef’s corals. 

The Smithsonian Institute is the world’s largest museum, education and research complex. But it seems they don’t have much of a process for quality control of the information in their magazine.
Screen shot. This photograph has been published and republished, including by the Sydney Morning Herald in April 2021.

*****

Tues. 30th November 2021

– A Note from Arthur Day

Dear Jen, 

Inspired by your request for help I offer the following:

Firstly, I used the uncorrected (white balance not corrected) native image you sent me the other day as one reference and adjusted the ‘fake image’ to match it.

Close-up showing the diver and also coral in the Ocean Agency image after the full image was colour corrected by Arthur Day.  To be clear, the colour correction was done to the entire image, and it was possible to restore the original colours by ‘reverse bleaching’.

That was EASY and did not require anything more of an adjustment than a global whole-of-image change, much the same as doing a simple white balance adjustment but this time mainly increasing the saturation and warming the colour temperature.

Secondly, I then selected two corresponding sets of detailed images from the before (fake) and after (adjusted) images to compare the corals with your unadjusted image (emailed to me).

The image that I emailed to Arthur before Leo undertook the colour correction using the colour chart.

The corals are definitely not dead.  And, furthermore, allowing the possibility it was more sunny or shallower water when they took their shot, I think those details demonstrate a pretty-close match to your uncorrected ‘beige shot’ if also viewed in equivalent detail. Now, for additional confirmation they have faked the bleaching, contrast the diver’s yellow belt in my corrected images with the image as published by Ocean Agency and Flickr.

In summary:

1. The coral in that fiddled/fake image is definitely still alive.

2. It is important to observe that all (or much) of the original colour information remains in that altered image. It has just been greatly suppressed (‘washed out’) when the image was manipulated.

3. It should therefore be possible to restore the original colours by reversing the adjustment that washed them out. That is, at least to a large degree, it should be possible to restore the original colours.  As I have done.

4. When we do that, it becomes apparent that this coral was alive and unbleached when the photograph was taken.

Regards Arthur

****

And so ‘Arthur’s image’ has become the feature image at the very top of this blog post.

Filed Under: Information Tagged With: Great Barrier Reef

If the South Pole Melted, A Note from Arthur

November 21, 2021 By jennifer

Over the last few decades there has been an overall decrease in the amount of ice at the North Pole, and an increase in the amount of ice at the South Pole. Should all the remaining ice melt at the North Pole it will have hardly any effect on global sea levels because it is sea ice not land ice.  Should all the ice melt at the South Pole, well this could cause global sea levels to rise by quite a bit.

I wrote something along these lines during that Glasgow talkfest. I received various emails telling me that it was not the sea ice I should be concerned about, but rather the glaciers.

There are some very large glaciers at the South Pole.  For a time there was concern about the Pine Island Glacier, but then it stabilised.  Then there is the Thwaites Glacier.  It is about the size of Britain, and melting.

I got chatting with my friend Arthur Day about this glacier, asking him whether we should be concerned, and he explained:

By far the main glacier of concern is the Thwaites glacier and its ‘rapidly’ thinning ice shelf.

This enormous glacier, described in the mainstream media as ‘the world’s most terrifying glacier’, is about the size of Britain. It is one of the largest glaciers on Earth. It has recently gained notoriety because it is currently undergoing a phase of relatively rapid flow into the sea. There is a fear that the faster flow is the beginning of an ‘irreversible collapse’ that will eventually contribute a ‘devastating amount’ of meltwater to sea level rise. Fuelling this fear is the knowledge that the glacier feeds a marine ice sheet where almost all of the basement supporting it is well below sea level, potentially making it unstable. Currently it is believed this glacier alone could already be contributing about 4% to global sea level rise.

If its ice shelf is weakened from beneath due to melting by ‘warm’ sea water, then it could lead to destabilisation of the main glacier behind, making it flow into the sea much faster than otherwise. This in turn could contribute to a faster rate of sea-level rise. While there is a lot of concern about this, there is no actual evidence it is anything more than a natural process. The glacier flows into the Amundsen Sea along the West-facing coastline of the Antarctic Peninsula and, today, its movement can be easily measured. However, just because it has been possible to easily measure the flow of the glacier over the few decades since the satellite era began in 1979, it cannot be claimed that ‘fast’ glacier flow is a ‘new’ phenomenon and, therefore, ‘unprecedented’. Glacier flow and ice shelf melting needs to be assessed from a much longer-term historical perspective with one eye on what glaciology teaches us about the complex dynamics of ice flow. For example, glaciers can start and stop moving again for no apparent reason, as has recently been demonstrated by the sudden stabilisation of the Pine Island Glacier.

In January 2020, an expedition by the US-UK International Thwaites Glacier Collaboration melted a 30 cm wide and 600-metre-deep hole through the floating ice shelf in front of the Thwaites glacier. For the first time they were able to directly measure the temperature of the ‘warm’ sea water right at the point where the ice meets the sea. The water temperature was 2°C. But this is just one measurement. A single temperature snapshot in time and place does not constitute a trend!

The seawater beneath the ice shelves is linked to an upwelling of ‘warm’ circumpolar deep water carried on an offshoot of the Antarctic Circumpolar Current. This is the strongest and most important ocean current on Earth. It is the only current linking all the major oceans. It flows around the Antarctic continent from west to east, at least in part whipped along by the drag from the strong westerly winds that blow around the polar regions. It is estimated that this current transports somewhere between 100 and 150 million cubic metres of heat-carrying sea water per second. Without the Antarctic Circumpolar Current, and its impact on planetary heat redistribution, the global climate would be very different. One of the curiosities about the Southern Ocean is that the deep water circulating Antarctica, the ‘Circumpolar Deep Water’ and the ‘Antarctic Bottom Water’ circulations, are warmer than at the surface. This happens because the deep water is also more saline, making it denser despite its higher temperature.

The Southern Ocean is a critical component of the global climate system because it is a key region for the upwelling of deep ocean waters to the surface. These upwelling waters are very old and have not been to the surface of the ocean for centuries or even millennia. It means that this water has not interacted with the atmosphere since well before the industrial era, certainly not since any human impacts on the atmosphere due to increasing CO2 were even possible. These upwelling waters bring heat to the shallower seas of the Antarctic continental shelves. When an offshoot of this current emerges along the western coastline of the Antarctic Peninsula, it can find its way to shallower depths and interact with the ice shelves in front of marine-terminating glaciers such as the Thwaites Glacier. Assisted by the prevailing westerly winds, enough heat can be transported to locally warm the climate of West Antarctica, so this current has potential consequences for the marine-terminating glaciers and the stability of the West Antarctic Ice Sheet. If the current or the assisting winds change, then the local climate can change. In fact, careful analyses suggest the strength of the upwelling and the associated currents experience significant inter-decadal variability, perhaps driven by changes in the westerly wind patterns.

What really counts in terms of judging human impacts on this natural process is whether any mooted acceleration in melting at the ice shelves can be attributed to human activity, or not. Are any short-term changes, such as they are, simply a function of natural variability in the temperature, speed, and distance at which the ‘warm’ currents pass along the coastline, or are they ‘unprecedented’ changes that lie outside the range of natural variability? It remains entirely unclear how the circulation of circumpolar deep water might change in the future. If the cause of changes in circulation is unknown, then changes could simply be random and a function of entirely self-contained ‘internal’ natural variability in the flow of the current. Imagine for a moment the flow of water in a turbulent stream. Watching closely, does the water always follow exactly the same path past any point? Ocean currents are the same but they operate on vastly greater scales over much longer time frames. In climate science, natural internal climate variability is a well-established fact. It is most pronounced at the local scale within individual climatic regions. The volatile climate of polar regions like West Antarctica is a good example.

In any case, the combined amount of ice in the affected ice shelves is only a fraction of the total amount of shelf ice that fringes the rest of the Antarctic continent. The threat that ice shelf thinning poses to the stability of the glaciers behind them is the subject of extremely challenging computer modelling. Theoretical understanding is still incomplete and there are not enough measurements in the critical areas. While of concern and worthy of monitoring, because the Thwaites Glacier behind the ice shelf is ‘the size of Britain’, should a ‘collapse’ commence at some time in the coming centuries then it would still take many thousands of years to unfold. That is because a glacier this size cannot simply ‘collapse’. It is just too big for that to occur. Geological studies of past events over the last million years show that the transition between glacial, intermediate, and collapsed states takes one to several thousand years. This is an entirely natural process, but it hasn’t stopped the Thwaites being dubbed the ‘doomsday glacier’ in headline-grabbing news articles such as one by the BBC entitled ‘Antartctica melting: Climate change and the journey to the doomsday glacier’, which is an impression cemented into folklore by many similar articles.

There is an extensive body of scientific literature that documents the past geological and climate history of West Antarctica. It documents a multi-thousand-year record of entirely natural climate volatility. This record is stored in both the offshore sediments, beneath the ice shelves, and within the ice sheet itself. The geology shows there is no evidence that current-day natural swings in climate along the West Antarctic coastline are in any way unprecedented. The ice sheet has undergone multiple massive volume changes over just the last million years alone in response to the global ‘ice age’ glaciation cycles. At times, parts of the West Antarctic Ice Sheet have disappeared almost entirely, along with its associated massive Ross and Ronne-Filchner ice shelves which combined are hundreds of times more massive than the Thwaites ice shelf. But each time, the ice has returned and, ten thousand years ago, the ice sheet on the Marie Byrd Land coast in West Antarctica was actually more than 700 m thicker than today.

These ice sheet cycles have been repeating for millions of years and therefore any current thinning of the ice beneath the ice shelves cannot simply be attributed to human activity, just because we now have the technology to measure it.”

But Arthur, they are!   By those who have no concept of our climate history, or of how much ice there is in Antarctica.

My friend Stuart Ireland scuba dove under Antarctica a few years ago and made a little video about it. I’ve taken a clip from this for the feature image and adjusted the tone curve on it to make him look colder.  Stuart told me that one of the most painful things he has ever experienced is defrosting his fingers after staying in the water with the sea lions for so long.  He did get some brilliant footage.

There is a whole section in my book ‘Climate Change: The Facts 2020’ about Antarctica including a chapter about volcanoes by Arthur.

Filed Under: Information Tagged With: Antarctica

Cyclones Downs, Corals Up – Except in Glasgow

November 4, 2021 By jennifer

It is impossible to reconcile the official statistics and what is under-the-water with the media reporting – including the reporting from Glasgow. There are meant to be more cyclones and less coral, but we have quite the reverse according to the official statistics. It is also making no sense that those who purport to care so much about the Great Barrier Reef still haven’t visited it. Then there are those who have visited it once, and then there are those who have visited it but never actually got in the water. Some of them are in Glasgow.

It was not for nothing that former Australian Prime Minister Malcolm Turnbull – he apparently visited Magnetic Island some years ago but never got in the water – approved a A$443 million grant to the tiny Great Barrier Reef Foundation. As far as I can tell it is paid out in little bits to all those in proximity who are prepared to lament how the corals are dying. I’ve meet so many who have received something, and so the useful idiots are paid off by the special people now in Glasgow.

On the eve of Glasgow, the same foundation put out comment:

Insufficient global action on climate change is taking a serious toll on the health of our Great Barrier Reef and coral reefs around the world. The facts are clear – coral reefs and their communities are on the front line. We know current climate change commitments don’t go far enough to protect them and we know this is the critical decade in which to act with urgency. Next month’s UN Climate Change Conference – COP26 – will be a pivotal moment in the global response to climate change.

Cyclones are a major problem for corals. They must be increasing.

On Tuesday 13th October 2020, the Australian Bureau of Meteorology put out a media release ‘Tropical Cyclone seasonal outlook for The Coral Sea’ in which it was acknowledged that, and I quote:

Recent decades have seen a decline in the number of tropical cyclones in our region.

Bureau climatologist, Greg Browning, went on to explain that this summer is likely to buck that trend, and that:

On average Australia sees 9 to 11 tropical cyclones each year, with 4 crossing the coast.

Cyclones can be devastating to coral reefs. Huge waves pound relentlessly smashing branching and fan corals. Sponges and squirts are upended. Massive Porites can be lifted and thrown metres – sometimes beyond the reef proper and onto the beach.

Given the Great Barrier Reef, as one ecosystem comprising nearly 3,000 individual reefs stretching for more than 2,000 kilometres, cyclone damaged areas can almost always be found somewhere. A coral reef that is mature and spectacular today, may be smashed by a cyclone tomorrow. So, I’m always in a hurry to visit my next reef particularly given all the modelling suggesting an inevitable increase in the number of cyclones and an inevitable decline in coral cover.

Yet!

The 2020–21 Australian region cyclone season was another ‘below average’ season, producing a total of just 8 tropical cyclones with just 3 of these categorised as severe. So since records began it is a case of less cyclones and less severe cyclones which must be good for the corals.

The Bureau has not updated this chart since the 2016/2017 season. The trend continues a downward trajectory with just 8 tropical cyclones last season (2020/2021) with 3 categorised as severe. http://www.bom.gov.au/cyclone/climatology/trends.shtml

Perhaps not surprisingly we are also seeing an increase in coral cover, and this is exactly what the latest report from the Australian Institute of Marine Science concludes. According to their Long-Term Monitoring Program (LTMP) based on surveys of 127 reefs conducted between August 2020 and April 2021, and I quote:

In 2021, widespread recovery was underway, largely due to increases in fast growing Acropora corals.

Survey reefs experienced low levels of acute stressors over the past 12 months with no prolonged high temperatures or major cyclones. Numbers of outbreaks of crown-of-thorns starfish on survey reefs have generally decreased; however, there remain ongoing outbreaks on some reefs in the Southern GBR.

On the Northern GBR, region-wide hard coral cover was moderate and had continued to increase to 27% from the most recent low point in 2017.

On the Central GBR region-wide hard coral cover was moderate and had increased to 26% in 2021.

Region-wide hard coral cover on reefs in the Southern GBR was high and had increased to 39% in 2021.

More information at https://www.aims.gov.au/reef-monitoring/gbr-condition-summary-2020-2021

Meanwhile former US President Barack Obama – who has never ever actually visited the Great Barrier Reef – confirmed he will attend the COP26 climate change summit in Glasgow. He is apparently meeting young climate change activists and highlighting their work around the world. I’m wondering when he will bring them to see the corals. The closest he has got, so far, is to Brisbane back in November 2014. He gave a speech at my old university lamenting the parlous state of the corals and claiming he wanted to take his daughters to see the corals before they were all gone.

But. We are still waiting. As far as I can tell, like Malcolm Turnbull, Barack Obama frightens the children about that which they have never actually seen or experienced with his own eyes – and with opinion that often does not even accord with the available statistics.

Former US President Bill Clinton hasn’t made it to Glasgow, but he did visit the Great Barrier Reef back in November 1996. He apparently spent a short hour snorkelling at a reef off Port Douglas.

If I didn’t know something about the scientific method, greenhouse gases, the Great Barrier Reef, and that foundation, I would be inclined to believe there was a crisis – and that there really was something I should do about it. As it is, I know that coral bleaching occurs as part of a natural cycle that will repeat irrespective of any agreements made in Glasgow. I also know as fact that there has been no increase in the incidence of cyclones and that coral cover is good and improving. It is also fact that coral reefs would benefit if there was rising sea levels because they could keep growing-up and also that they grow faster as sea temperatures increase. Did you know that there are arguably more colourful corals and even better coral cover in waters just a few degrees warmers? The warmer waters are just to the north of Australia around New Guinea and Indonesia.

UPDATE 8PM, 4TH NOVEMBER 2021

There is now an updated cyclone chart at the Bureau’s website.

Much thanks to the Bureau for updating the chart to this year, to the 2020-2021 season. The chart and report is here: http://www.bom.gov.au/cyclone/tropical-cyclone-knowledge-centre/history/climatology/

And much thanks to Charles for reposting at WUWT.

***
The feature image shows a blue Acropora, one of the genera most susceptible to devastation by cyclones and one that has done well at many reefs over recent years. The photograph was taken at Pixie Reef just to the north of Cairns by me.

Filed Under: Information Tagged With: Great Barrier Reef

If Only Climate Activists Cared About Elephants

November 2, 2021 By jennifer

Despite their large size, I’m told that counting polar bears is not easy; that they move around a lot. The modelling is always suggesting population decline, but best estimates indicate polar bear numbers have been increasing since effective bans on hunting were introduced in the early 1970s. Contrast this with the situation in Africa where best estimates indicate more than 100,000 elephants have been slaughtered since 2006. The problem for the elephants is hunting – illegal poaching – which was once such a problem for polar bears.

Rather than worrying about polar bears (and penguins) the special people in Glasgow could be worrying about Africa’s elephants.

I spent some time amongst the elephants of East Africa in the late 1980s when I worked as a field biologist based in Nairobi. During the years I was there the elephant populations in the national parks were decimated by poachers.

Official estimates put Kenya’s total elephant population at 167,000 in 1973, and just 16,000 in 1989. That was when there was major legislative change, rangers were issued with semiautomatic weapons and told to defend the remaining herds. At the same time elephants were listed in Appendix I of CITES with an international commitment to halt the trade in ivory. The slaughter stopped, temporarily.

African elephant populations began to recover. By 2007 there was estimated to be about 470,000 elephants across Africa (savannah and forest).

Then environmental activists became obsessed with climate change to the exclusion of most everything else, and the wholesale price of raw ivory in China tripled and poaching started again. Best estimates indicate the trend of increasing elephant numbers for some yeasr during the 1990s has reversed, and that more than 100,000 African elephants were slaughtered between 2006 and 2015 – for their ivory, for the Chinese.

When I was last in Kenya (18 months before covid), I visited the Sheldrick Wildlife Trust that seeks to make a difference by looking after orphaned baby elephants and being a part of anti-poaching efforts. The feature image, at the top of this blog post, shows me with a baby elephant just outside Nairobi in 2018.

Filed Under: Information Tagged With: conservation, elephants

Do Glaswegians Mostly Breathe Nitrogen?

October 30, 2021 By jennifer

I wonder how many of the approximately 30,000 ‘special’ people who are on their way to Glasgow for COP26 know that 78 per cent of the atmosphere is made-up of nitrogen. I asked this question of a group of retired professionals just yesterday and there was silence. My second question was about oxygen and a retired airline pilot answered correctly: she said that 21 per cent of the atmosphere is oxygen.

My late father was an agronomist who once worked for CSIRO and for a period led aid programs in different parts of Southeast Asia – he always used to say that his big issue was working out how to get more nitrogen into the soil because it was so important for plant growth.

I just asked my husband – a chemist who once worked in pulp and paper – what the cardboard box on the floor beside my desk would be composed of. He ventured about 40 per cent carbon, 40 per cent oxygen,10 per cent hydrogen and 10 per cent other elements. The box is empty so inside it would be about 78 per cent nitrogen and 21 per cent oxygen with trace amounts of carbon dioxide.

While few people seem to know that carbon dioxide makes up only 0.04 per cent of the Earth’s atmosphere, I’m often told that carbon dioxide is a greenhouse gas: FACT!

They do shout the bit about it being a ‘fact’, as though that makes it special because it proves that carbon dioxide is warming the Earth. But it doesn’t. The fact that carbon dioxide is a greenhouse gas is meaningless if we don’t place this in some context given the complexity of real-world physics and chemistry when it comes to climate change.

There are other greenhouse gases, including water vapour which spectroscopy has shown to be 12 times more active than carbon dioxide in long-wave radiation absorption and re-radiation. This is because water vapour is both more abundant and absorbs the long-wave radiation over a larger band of wavelengths.

An important research paper published 20 years ago by Richard Lindzen, Ming-Dah Chou and Arthur Hou (Bulletin of the American Meteorological Society, Volume 81) contradicts the popular IPCC-endorsed theory that water vapour concentrations increase with atmospheric carbon dioxide concentrations, causing a positive feedback and thus more global warming as the consensus theory goes. Specifically, Lindzen et al. showed that the area of upper-level cirrus cloud decreased as temperatures increased in the tropics, providing negative feedback that cancels any positive water-vapour feedback.

I know this is more information than most people who want to be an expert on carbon dioxide care to think about. In fact, even those who are experts on carbon dioxide and climate change would prefer not to know about the Lindzen et al. 2001 paper. The response to that paper was for the editor of that publication, the Bulletin of the American Meteorological Society, to be immediately replaced. The next issue of the Bulletin contained an attack, not in the form of a letter (to which Richard Lindzen would have immediately replied had he been given an opportunity) but as a separate article (Hartmann & Michelsen 2002). The title of the article was ‘No Evidence for Iris’, with the new editor appending a subtitle ‘Careful analysis of data reveals no shrinkage of tropical cloud anvil area with increasing sea surface temperature (SST)’. This rebuttal muddled Lindzen et al.’s method but did have a compelling title.

Facts often need context, but in the case of world-wide polar bear numbers it is straightforward: since bans on hunting were introduced in the 1970s numbers have increased from about 10,000 in the late 1960s to an official estimate of 26,000 in 2015. Surveys conducted since then, by those reluctant to report a further increase, suggest a modest 28,500 bears. When estimates for subpopulations are added to this, the more realistic number becomes 39,000 – that could be rounded to 40,000. 

The bottom-line is that despite a reduction in sea ice at the North Pole over this same period, there has been an increase in polar bear numbers. Which is good news that runs contrary to the zeitgeist. 

Successful Australian businesswoman Gina Rinehart reported the increase in polar bear numbers in a lecture she gave to her former girls’ school; it sent the ‘fact’ checkers at the Australia Broadcasting Corporation (ABC) into a spin resulting in a long essay that was short on facts and big on snow. How dare Ms Rinehart – whose profits from mining fund them – have an opinion on bears. I suspect Twiggy Forest is allowed to have an opinion on bears because he knows better than to explain that despite a decrease in the amount of ice at the North Pole, polar bear numbers have been increasing.

It is a fact that over the last few decades there has been an overall decrease in the amount of ice at the North Pole, but there has been a contrasting increase in the amount of ice at the South Pole. It is also a fact that should all the remaining ice melt at the North Pole it will have hardly any effect on global sea levels because it is sea ice not land ice. Should all the ice melt at the South Pole, well this could cause global sea levels to rise by some 70 metres. So, we might be grateful that it is trending as it is, with more ice at the South Pole even though there are no polar bears there. But whenever I talk about the South Pole to those wishing they were off to Glasgow I’m told I should be talking about the North Pole as though I am trying to trick them with any mentions of the South Pole.

Just yesterday I was told that what is most important is not that carbon dioxide is a greenhouse gas or the amount of new ice accumulating at the South Pole, but that atmospheric carbon dioxide concentrations are increasing. When I ventured that this could be a consequence of increasing temperatures I was shouted at. Specifically, I was told that while atmospheric levels of carbon dioxide-increase does lag behind temperature increases, this is not relevant, and this does not prove that carbon dioxide is not a greenhouse gas. I had to write that down to check I wasn’t missing something, that I was being thrown a non sequitur.

It is difficult having a rational and logical discussion with a true believer. I suspect they get very emotional very quickly, because climate change is a topic to which they are very attached, while knowing really very little about. It is something like an infatuation – not to be scrutinised, lest the feeling dissipates, and the individual find themselves all alone again and without a cause.

If none of this makes sense to you, it is probably a good thing that you are not going to Glasgow where they could probably be convinced that 78 per cent of the atmosphere is carbon dioxide and 21 per cent oxygen with this percentage rapidly declining with every new coal fired power station.
If you do want a day-by-day account of what is happening in Glasgow consider signing up to the IPA’s daily newsletter for the period of COP26, Net Zero.

Each of these daily newsletters will include commentary from Aynsley Kellow who is Professor Emeritus of Government, University of Tasmania, and author of Negotiating Climate Change: A Forensic Analysis and Transforming Power: The Politics of Electricity Planning – and an all-round sensible fellow. Following is his contribution just yesterday:

Australia has an embarrassment of riches. It possesses vast resources of high quality coal, both coking coal (for iron ore production) and steaming coal (for energy production), with low sulphur and low ash. Much of it can be mined at low cost by open cut methods. This endowment has become an embarrassment because coal combustion gives rise to the emission of the highest levels of CO2 of all the fossil fuels. Australia exports both large quantities of coal and of energy-intensive products like aluminium, so that emissions occur here rather than in consuming nations.

On the other hand, Australia has a vast land area and a dispersed, though comparatively centralised, (growing) population, so transportation requires more energy than is the case with many other nations, with fossil fuels powering this.

Both these factors make reducing greenhouse gas emissions in Australia difficult and relatively costly. How should it respond to the challenge of anthropogenic climate change?

Many Australians are under the impression that it can meet the challenge easily and cheaply. ALP leader Anthony Albanese stated in an interview on 20 October 2021, that renewables were now the cheapest form of electricity, suggesting that wind generators, solar panels and electric transportation would make the response an easy one.

But this was wrong – and typical of the mistaken beliefs of many renewables enthusiasts.

Non-hydro renewables have indeed become much cheaper when measured by what is called the Levelised Cost of Energy (LCOE), (which is a tool used to do comparisons, see here for example) although spot prices of the polysilicon used to make solar panels have increased six-fold in the past year, thanks largely to the energy problems that have beset China and elsewhere. But LCOE misses many of the disadvantages and costs of renewables in an electricity system. What matters is the System Levelised Cost of Energy, and when this is considered, renewables cannot compete. Moreover, while their cost has declined markedly, the cost curve for both wind and solar has followed that typical of new technologies and flattened out – suggesting most of the cost reductions have already accrued.

The problems with renewables stem from the fact that they are intermittent and weather-dependent. Solar cannot produce electricity at night and its output is reduced when there is heavy cloud – such as that which crashed the network in Alice Springs a year or so back. Wind is variable and ‘wind droughts’ can occur for hours or even days.

A heavily renewables system requires storage, and storage Is expensive, driving its cost above coal. Storage is necessary on an inter-day as well as intra-day basis, and even inter-seasonal. The capacity factor of renewables is often 25-30 per cent, so to meet average demand a generating capacity of three or four times the average is required – in fact more, because storage and discharge is often of the order of 85 per cent efficient, so storage consumes perhaps 15 per cent.

Storage is expensive. The US group Environmental Progress has calculated that it would require 15,280 storage centres the size of the largest existing in the US to provide 4 hours back-up for the US grid at a cost $764 billion, and 696 Hornsdale (South Australian) batteries are required to provide just 4 hours of backup power for the Australian grid. But that is only intra-day storage. What of inter-day storage?

The United Kingdom has recently had to fire up a retired coal-fired station because of a shortage of gas (especially inadequate storage capacity) and problems with the cable that allows it to draw on France’s predominantly nuclear capacity. But it has also experienced a prolonged period of very low winds – lots of what the Germans call a Dunkelflaute (dark doldrums) days.

This prompted Professors Peter Edwards and Peter Dobson and Dr Gari Owen to calculate the cost of backup required for a 50 per cent renewables UK and a 100 per cent renewables UK. Their estimate for 50 per cent was £1.5Trillion ($A2.75T) and £3T ($A5.5T) for 100 per cent renewables. If anything, this was an underestimate, because it assumed 100 per cent efficiency of storage. But, of course, it was assumed that there was adequate excess renewable generation capacity pre-Dunkelflaute to charge the battery storage. (It should be noted that the UK system is of the same order of magnitude as that of Australia, but has fewer solar resources).

Renewables also incur substantial network costs. Non-hydro renewables have a very low density and considerable land-use requirements. To transmit the energy generated – which is Direct Current (DC) and must be run through an inverter to synchronise with the Alternating Current (AC) grid frequency – vast additional transmission resources are required, and must be capable of coping with peak generation, but with only 25-30 per cent utilisation. (Because of the DC rather than AC issue, a largely renewables system lacks the inertia of a traditional electricity system which is underloaded with a ‘spinning reserve’ to cope with fluctuations in generation or load; the presence of high levels of renewables on the system requires batteries like the one in South Australia to stabilise voltage and frequency).

Moreover, if renewable electricity is to replace petroleum fuels for transportation (directly or in hydrogen fuels), huge amounts of additional capacity will be required.

Any sensible energy policy must consider all sources: nuclear, hydro, renewables and coal. Simply writing coal out of the equation because it generates the most CO2 per unit of electricity is simplistic foolishness. Technological advances mean that coal-fired electricity can produce cheap, reliable electricity with substantially lower GHG emissions, and therefore reduce Australia’s emissions if it were to replace existing plants. (It is also significant for developing countries, which are likely to want to industrialise and do so economically).

GE is now marketing advanced ultra-supercritical (AUSC) technology, calling it SteamH. SteamH combines steam plant technology operating with advanced ultra-supercritical conditions and a digital power plant data platform called Predix. GE claims 49.1 per cent efficiency for AUSC, and the first plant, Pingshan power plant phase two in China of 1350MW was commissioned in December 2020. The average efficiency of the existing global coal fleet is 34 per cent, and every 1 per cent improvement in efficiency can reduce GHG emissions by 2–3 per cent. So AUSC could reduce emissions from coal-fired power stations by 30–45 per cent if they were replaced by best available technology.

Unfortunately, current Australian policy settings effectively preclude the construction of an AUSC station, and a crunch is looming. As noted above, the LCOE of renewables is usually quoted, but the effect of expanding renewables capacity on the reliable, dispatchable system is being ignored. In point of fact, the expansion of renewables is cannibalising the dispatchable capacity, because it is effectively parasitic on the system.

The economics of renewables in a traditional, dispatchable system is well established. While the value of renewables initially increases, its value declines as its share of total generation increases. Australia’s renewables share has now passed 20 per cent and the value of additional renewables capacity will in future decline considerably as backup and network cost accumulate. Coal cannot compete with subsidised, privileged near zero marginal cost renewables, so lower capacity factors destroy the value of existing generation plant.

In addition to the greenhouse gas (GHG) emissions and economics of different energy sources it is also important to note their resource requirements, life cycle impacts and other environmental impacts. For example, it has been estimated that the installation of sufficient wind turbines to meet US demand would increase the surface temperature of the country by 0.24°C mostly at night (when the increase would be 1.5°C).

But the really telling evaluation of renewables is in their resource impacts, especially compared with nuclear energy. For the same energy production, solar energy requires about 450 times the land area of nuclear and wind 400 times. Wind requires seven times the amount of concrete of nuclear, and solar about two and a-half times. Each of them requires about 17 times as much steel. Add in copper for generators and transmission.

What also must be considered is the energy consumed in the production of renewables, much of it in China where most PV panels and many wind turbines are manufactured, using coal-fired energy. Moreover, the manufacture of PV panels releases solvents such as sulphur hexafluoride and nitrogen trifluoride, with Global Warming Potential numbers about 20,000 times that of CO2.

When it comes to the end of economic life, solar panels produce 300 times the amount of waste as does nuclear energy, and both wind and solar are made of composite materials that are difficult to recycle, so most are currently sent to landfill. Both are at risk from extreme weather, and catastrophic failure of wind turbines is well-documented.
Then there is the well-documented impact on birds and bats, an impact that extends to solar thermal generation, where the focused sunlight turns unwary birds into ‘streamers’.

A balanced energy policy must consider all sources and all their advantages and disadvantages – including all environmental impacts.

Looking only at coal-fired electricity generation without considering best available technology or the GHG emissions related to renewables regardless of where they are released is not a wise climate change policy.

Simplistic responses such as attempting to ban coal simply opens the door for rent seekers who have invested in the alternatives while shutting another door – that to economic development for the millions who lack access to affordable energy and the opportunity for the prosperity we take for granted.

Thanks for reading this far.
Dr Jennifer Marohasy

PS Thanks to Dr Arthur Day – who is also contributing to the daily newsletter – for the chart that features at the very top of this note. It does seem to be the case that atmospheric concentrations of carbon dioxide are unaffected by all the meetings and also the reduction in air travel due to Covid, etc. Could it be that atmospheric carbon dioxide is increasing because of ocean degassing and this has absolutely nothing to do with us? It is what would be expected from the solubility curve of carbon dioxide in water. Some of the little bumps on the line can be traced to volcanic events with the oceans scavenging any excess carbon dioxide from volcanic events within about 2 years.

*******
This was written for my monthly e-newsletter and is republished here by popular request. If you want to be sure to get something from me once a month in your inbox, then subscribe to my e-news, by clicking here and then scrolling down.

Filed Under: Information, Opinion Tagged With: carbon dioxide, ice age, Polar Bears, renewables, sea ice

Unable to See the Polar Bears for the Snow

October 28, 2021 By jennifer

Facts often need context, but in the case of world-wide polar bear numbers it is straight forward: since bans on hunting were introduced in the 1970s numbers have increased from about 10,000 in the late 1960s to an official estimate of 26,000 in 2015. Surveys conducted since then, by those reluctant to report a further increase, report a modest 28,500 bears. When estimates for subpopulations are added to this, the more realistic number becomes 39,000 – that could be rounded to 40,000.

The bottom-line is that despite a reduction in sea ice at the North Pole over this same period, there has been an increase in polar bear numbers.

This is good news that runs contrary to the zeitgeist.

Successful Australian business woman Gina Rinehart reported the increase in polar bear numbers in a lecture she gave to her former girl’s school, and it sent the ‘fact’ checkers at the Australia Broadcasting Corporation (ABC) into a spin resulting in a long essay short on facts and big on snow. How dare Ms Rinehart – who’s profits from mining fund them – have an opinion on bears.

This bear hopes Gina keeps speaking out with the facts, and thanks Gina for the royalties that pay for our schools and hospitals.

Canadian Polar Bear expert Susan Crockford describes the ‘fact check’ as convoluted and explains how it ignores the many polar bear subpopulations across the Arctic and still fails to refute the 150% increase in bear numbers between 1960 and 1993 and further 56% increase from 1993 to 2018.

For more information download the IPA’s factsheet.

*******
Filing here:

It is interesting how much interest this information can generate at Facebook, the following screenshot was taken 24 hours after posting.

There is potential for a larger audience by paying to ‘boost’, which I would do if this website was sponsored.

Filed Under: Information Tagged With: Polar Bears

  • « Go to Previous Page
  • Go to page 1
  • Go to page 2
  • Go to page 3
  • Go to page 4
  • Interim pages omitted …
  • Go to page 71
  • Go to Next Page »

Primary Sidebar

Recent Comments

  • Ian Thomson on Vax-ed as Sick as Unvax-ed, Amongst My Friends
  • Dave Ross on Vax-ed as Sick as Unvax-ed, Amongst My Friends
  • Dave Ross on Vax-ed as Sick as Unvax-ed, Amongst My Friends
  • Alex on Incarceration Nation: Frightened of Ivermectin, and Dihydrogen monoxide
  • Wilhelm Grimm III on Incarceration Nation: Frightened of Ivermectin, and Dihydrogen monoxide

Subscribe For News Updates

  • This field is for validation purposes and should be left unchanged.

December 2025
M T W T F S S
1234567
891011121314
15161718192021
22232425262728
293031  
« Jan    

Archives

Footer

About Me

Jennifer Marohasy Jennifer Marohasy BSc PhD has worked in industry and government. She is currently researching a novel technique for long-range weather forecasting funded by the B. Macfie Family Foundation. Read more

Subscribe For News Updates

Subscribe Me

Contact Me

To get in touch with Jennifer call 0418873222 or international call +61418873222.

Email: jennifermarohasy at gmail.com

Connect With Me

  • Facebook
  • LinkedIn
  • RSS
  • Twitter
  • YouTube

Copyright © 2014 - 2018 Jennifer Marohasy. All rights reserved. | Legal

Website by 46digital