• Skip to primary navigation
  • Skip to main content
  • Skip to primary sidebar
  • Skip to footer
Jennifer Marohasy

Jennifer Marohasy

a forum for the discussion of issues concerning the natural environment

  • Home
  • About
  • Publications
  • Speaker
  • Blog
  • Temperatures
  • Coral Reefs
  • Contact
  • Subscribe

Humour

Opera House Still Above Sea Level: Despite Homogenisation

October 5, 2014 By jennifer

ONE of the longest continuous sea level measuring gauges is not far from the Sydney Opera House at Fort Denison. The mean sea level trend is 0.65 millimetres per year based on monthly sea level data from 1886 to 2010.

Except that sea levels haven’t trended consistently up each year but rather follow 50-60 year cycles, then there is the impact from El Nino events, and of course the moon is responsible for the neap tides and the king tides.

To be clear, that is NOT 0.65 centimetres per year, but rather MILLImetres per year. Tiny. Particularly given much of the New South Wales coastline has sustained an approximate 2 metre drop in sea levels over the last few thousand years. Not a 2 centimetre drop, but a 2 metre drop. This is not controversial, but rather a well-established fact in the technical literature. The arguing is not that the fall has been of this approximate magnitude, but whether the approximate 2 metre fall in sea levels has been more-or-less continuous or through step changes.

In the scheme of things the rise since 1886 is but a blip in an otherwise falling trend. Of course go back just 16,000 years and sea levels were rising, and significantly faster than at present. Yes. The climate changes.

But, what about Tuvulu, I hear someone ask? It’s an atoll in the Pacific that is sinking. Add to this pressure from a growing population resulting in the depletion of aquifers, and saltwater intrusion can give the false impression of sea level rise.

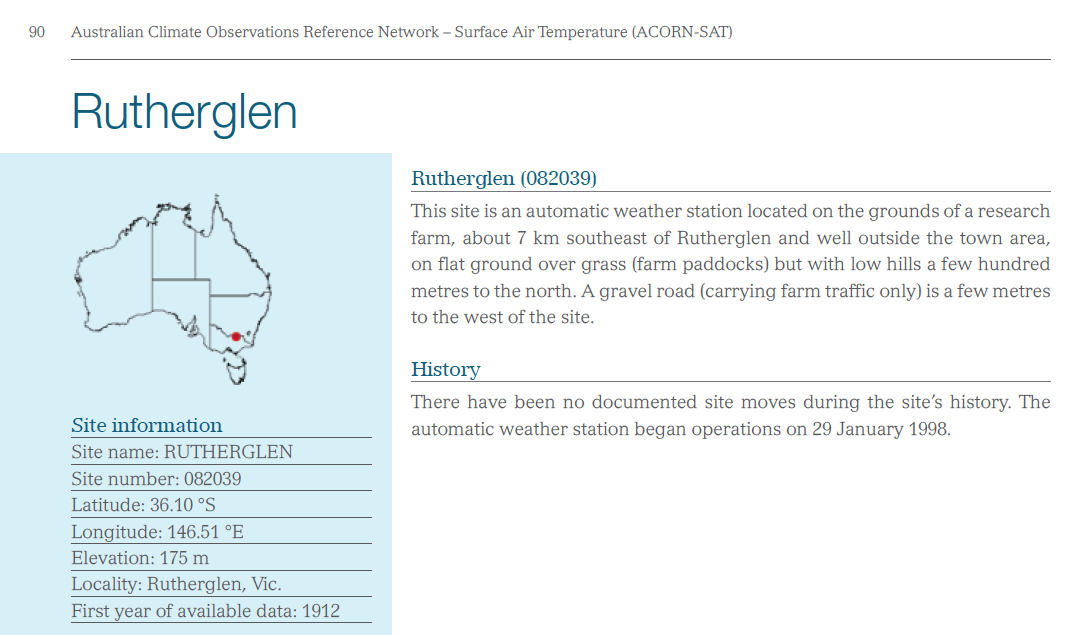
But none of this is new information to readers of this blog. What is new, is that Bob Carter and colleagues have just written a long report pointing out that there are wide variations in rates of tectonic uplift and subsidence (sinking) around the world at particular times and that any coastal management plan for New South Wales should be based on a good understanding of the local geology, as well as long-term rates of sea level rise. Professor Carter’s new report also suggests that in order to create an impression of sea level rise, rather than just plot raw data, there is a good amount of homogenization. In particular, the high sea-level rise figure of 3.3 mm per year reported for the Fort Denison tide gauge in the report does not represent the original data measurements, but results from computer modeling combined with the selection of a short and atypical section of the available sea-level record.

All this as rebuttal to what might appear to be an innocuous report by Whitehouse and Associates entitled ‘South Coast Regional Sea Level Rise Policy and Planning Framework’. But apparently it could become something of a blue print for the further erosion of the property rights of coastal residents more generally.

Bottom-line: we are unlikely to lose the South Coast or the Opera House to sea level rise from climate change, but it doesn’t hurt to have your own plan in case of a tsunami. According to Ted Bryant, recently retired from the University of Wollongong, six big tsunamis have hit Sydney during the last 10,000 years, the most recent in 1491.

I’m adding this youtube on a bad moon rising for fun.

Filed Under: Humour, Information Tagged With: sea level change

Who’s going to be sacked for making-up global warming at Rutherglen? Part 2.

September 19, 2014 By jennifer

THE Bureau of Meteorology has spent several weeks looking for documentation to support its recent claim that, contrary to what is written in its published station catalogue, the weather station at Rutherglen was once moved. Station Catalogue

The Bureau hasn’t been able to find any actual documentation to verify this move. But this hasn’t stopped it nevertheless concluding that there was a station move and publishing a document, not in the peer-reviewed literature, but on the Internet to conclude that the weather station was once moved between paddocks.

Furthermore, but not even published on the Internet, this move between paddocks, that could have occurred in 1966 or even 1974 apparently justifies a drop down in minimum temperatures, with the largest change a 1.8 degree Celsius difference between recorded and homogenised temperatures for Rutherglen in 1913. The net effect on the temperature trend is the creation of a 1.73 degree Celsius per century warming, where previously there was a 0.35 degree C per century cooling in the minimum temperature series.

It makes no sense!

But it hasn’t stopped the alarmists on Twitter and at HotWhopper claiming the Bureau was right all along: the weather station had moved, there are maps and photographs and conclusions, just no actual documented evidence. Indeed it doesn’t seem to have occurred to Lotharsson and the rest of the HotWhopper cheer squad, that if the Bureau was able to find inspection reports, requests for replacement equipment and more, that there should also be documentation if the station had actually been moved!

Of course it may have been moved, and the documentation may have been lost, but that still doesn’t justify the change in magnitude and direction of the temperature trend for Rutherglen that the Bureau has made.

My colleague, Bill Johnston, has forensically examined the temperature data generated by the weather station at Rutherglen. Dr Johnston is of the opinion that it is possible that there was a site move in 1965. He can find a break in the data at this time. But even accounting for this, there is no overall warming trend in the data either side of this break. So, Dr Johnston has concluded after running three independent statistical tests over the data, that it is the Bureau that has changed the data, resulting in a bias in the data series where none previously existed.

HotWhopper haven’t actually examined the data, or thought about whether moving a weather station between paddocks in a relatively flat rural terrain could cause a change in the direction and magnitude of the temperature trend. They are just celebrating that the Bureau could publish on the Internet claiming a site move.

According to HotWhopper, quoting the Bureau, the need for an adjustment to the Rutherglen data was made through the application of, “an objective statistical test that showed an artificial jump in the data during this period” prior to 1966.

In fact statistical tests cannot show “artificial jumps”. What empty heads they are at HotWhopper and the Bureau!

Statistical tests can detect breakpoints in temperature series. These may be attributable to climatic or non-climatic factors.

The Bureau claims that, 1966 and 1974 dates match the two breakpoints in minimum temperatures through a “statistical comparison of its [Rutherglen] data with other site data in the region.”

So, the Bureau is suggesting the “jump” is non-climatic and due to the weather station being moved because, while there is “no firm documentation” for a site move, 12 documents have been located that together, they claim, provide some circumstantial evidence for the weather station having been moved between paddocks.

Importantly, the Bureau is not claiming any breakpoints in the Rutherglen data per se, but rather that the trend at Rutherglen is not consistent with its neighbours at about the times for which there is circumstantial evidence the station was moved from one paddock to another.

It is in fact disingenuous and illogical for the Bureau to suggest that what could only be considered an insignificant move, if indeed it did occur, that is a move between paddocks in a relatively flat rural terrain could create a change in the direction and magnitude of the temperature trend.

But there is more. While the BOM claim a discontinuity based on neighbouring stations the algorithms and/or test that might show such a result are not disclosed. We are expected to believe this is the case, but this is not science because no methodology has been provided. In fact, when one of my colleagues, Ken Stewart, tested this proposition. He found that the raw data for Rutherglen has a virtually identical trend to its neighbouring comparison sites, while the homogenised ACORN-SAT data for Rutherglen is strongly biased towards warming relative to those neighbouring sites.

So, I ask again, who is going to be sacked for making up global warming at Rutherglen?

Filed Under: Humour, Information, News Tagged With: Temperatures

The ABC of Rutherglen

August 28, 2014 By jennifer

IF global warming is the greatest moral issue of our time, then the truth really does matter. But this morning, I felt that I had been shut outside, or at least cut-off, without having a chance to tell the whole story.

Jennifer Marohasy feeling left out.

Bronwen O’Shea the host of an ABC radio program for the Goulburn Murray, a region that includes the town of Rutherglen, was interviewing me.

Bronwen invited me on to her program, and also someone from the Australian Bureau of Meteorology to discuss the temperature record for Rutherglen. The Bureau declined.

Bronwen began the interview by suggesting that Bureau have only tweaked the figures for Rutherglen. I disagreed. I explained that the Bureau has actually completely trashed the temperature record by changing what had been a slight cooling trend into warming of 1.73 degree C for the last 100 years.

I also explained that this had been achieved by progressively dropping down the original temperatures from 1973. I wanted to explain that the largest change was back in 1913, with the difference between the actual recorded temperature, and the new official temperature a massive 1.8 degree C.

I was cut-off, before I got to explain too much.

I waited, assuming the line had dropped out. But after no one phoned me back I rang back myself. I phoned ABC Goulburn Murray and was put on hold. Guess whom Bronwen was now interviewing?

Answer: the infamous John Cook, a faux sceptic from the University of Queensland.

    Answer: Someone who mentioned the blog site ‘Sceptical science’ and who I assumed was John Cook.**

Mr Cook

    This person

was telling Bronwen that the temperature record for Rutherglen had to be corrected because it was different from everywhere else.

But that is just not true. I haven’t looked at all the weather stations for Victoria. But I have looked at trends for all the stations with long continuous records for the state of New South Wales, which is just across the Murray River from Rutherglen.

Most of the inland records show a very similar trend to Rutherglen. In fact, if we consider the raw data for Deniliquin from 1913 through until the end of the record in 2003 we see a similar pattern of cooling.

Deniliquin is not some random choice of my own. It is listed in the Bureau’s official station catalogue as being one of three nearest sites to Rutherglen, the other two sites listed are Wagga Wagga and Cabramurra. I will look at the data for these locations in due course.

As detailed in my recent paper to the Sydney Institute: after considering all the locations in New South Wales where there are long continuous temperature records available, I have calculated that the net temperature change for New South Wales shows cooling of 0.021 degree per century. That is the net change for the entire state.

In contrast the BOM claims for NSW that there has been a 1 degree C per century warming.

Before I start doing the calculations for all of Victoria, I suggest you get the complete picture for Rutherglen.

To this end I’ve just created a dedicated page for Rutherglen and dedicated it to a real trooper and truth seeker, Judy Ryan.

Here’s the page…

https://jennifermarohasy.com.dev.internet-thinking.com.au/temperatures/rutherglen/

Now. Before anyone makes comment at this thread, could I suggest they at least scan the information as provided… sort of the ABC of Rutherglen that I wasn’t quite able to communicate this morning on the ABC.

* I have been contacted at my Twitter account to say that it was not John Cook. He apparently even has an alibi. So, sorry for misleading anyone. After I phoned back I was put on hold, and could hear Bronwen talking with someone. I wondered who that was. I heard them recommend the website Sceptical Science and assumed, it now appears incorrectly, that it was John Cook.

—————
Photograph by Lyndon Mechielsen.

Filed Under: Humour, Information, Opinion Tagged With: Temperatures

Open Thread, & Happy New Year

December 31, 2013 By jennifer

Inconvenient Truth

Filed Under: Humour

When Is the Right Time to Abandon Ship?

December 30, 2013 By jennifer

IN September, Patrick J. Michaels likened the Intergovernmental Panel on Climate Change to a treed cat. He wrote, “Instead of closing its eyes and scurrying to the ground, it climbs onto even higher and thinner branches, while yowling ever louder.”

Dr Michaels then went on to ask, how does the IPCC back down from a quarter-century of predicting a quarter of a degree (Celsius) of warming every decade, when there’s been none for 17 years now?

Chris Turney, professor of climate change at the University of New South Wales, could be described as a cat stuck on a high branch tweeting, but he’s actually at the Antarctic and should be considering abandoning ship, except that there is no clear water into which to launch a life raft.

According to the website Boatsafe.com it can be a difficult decision knowing just when to make the call and it is quite common for captains to wait too long to successfully get clear of a floundering foundering boat.

Four days ago the Professor Captain tweeted: “Great news. Icebreaker Snow Dragon on horizon with penguins! Everyone very happy!”Penguins_n_SnowDragon

Happy because the Chinese ice-breaking vessel Snow Dragon was expected to clear a path for the stricken ship by Friday night, avoiding the need to abandon ship.

That was after this 233-foot-long Russian-flagged ship sent out a distress signal on Christmas Eve, which was picked up by the Falmouth Maritime Rescue Coordination Center, in the U.K. As the floundering ship is in the Australian search-and-rescue region, the message was passed on to AMSA, and three ice-breaking ships were sent to the rescue.

So far there has been no mention of the climate by the professor of climate change.

But some positive reporting of the weather.

When it looked like the Snow Dragon would be unsuccessful in its bid to cut through 20 kilometres of sea ice frozen to an average depth of perhaps 10 metres, Professor Captain Turney explained that the weather had improved and the ship was no longer in a blizzard.

So, presumably no need to abandon ship.

Next day the Professor Captain tweeted that the ice was cracking. Still no mention of climate. But this time he did report that the weather had deteriorated with snowfalls and stronger winds.

Still no suggestion they abandon ship. In fact Turney tweeted confidently that the second ice-breaker, an Australian ship the Aurora, would be able to successfully rescue them. This despite reports that there was a growing distance between their floundering stricken ship and open water.

Oh. And wind conditions were putting a lot of strain on one side. Turney added that, “The build-up of ice on one side has given it quite a tilt.”

Not the climate, but the ship.

In fact must be five days stranded now, no clear water, and no mention of climate change.

I am surprised because there is surely potential for some simple climate change type calculations that could be done by the many scientists onboard.

For example, Professor Captain Turney has explained that sea ice can buildup fast because of high winds. Note. High winds, no mention of climate change.

But let me continue.

When the Captain Professor first realized there was no open channel through the ice they were only about two nautical miles from open water. Next thing, more than 20 miles of ice had built up. Now it’s apparently closer to 50 kilometers.

As someone genuinely interested in climate change I ask, “Given the tilting ship, is about 2,800 kilometres south of Hobart, if this catastrophic cooling trend continues, how many days before it is possible to skate across Bass Strait, from Hobart to Melbourne?”

But I digress. Back to the key issue: When is the right time to abandon ship?

As I write the distance between open water with the ice breakers and the tilting ship is somewhere in the vicinity of 50 kilometres. I don’t know how many penguins.

Of possible significance they are running out of coffee.

***
Sources of information
http://www.cato.org/publications/commentary/ipcc-political-suicide-pill

http://worldnews.nbcnews.com/_news/2013/12/27/22059393-great-news-rescue-vessel-within-sight-of-explorer-ship-stuck-in-antarctic-ice

http://www.news.com.au/travel/travel-updates/rescue-vessel-near-university-nsw-professor-chris-turneys-icetrapped-cruise-ship/story-fnizu68q-1226790782675

http://worldnews.nbcnews.com/_news/2013/12/27/22068563-icebergs-blizzards-and-a-creaking-ship-antarctic-explorers-tense-wait-for-rescue?lite

http://www.iol.co.za/scitech/science/environment/vessel-still-stuck-in-antarctic-ice-1.1627313#.UsFrbf2Tqro

Filed Under: Humour, Information Tagged With: Climate & Climate Change

Your Temperatures Diddled

July 31, 2012 By jennifer

ALMOST exactly three years ago Michael Hammer showed that the official temperature rise profile for the 20th century in the United States is largely, if not entirely, an artifact of adjustments applied after the raw data is collected from the weather stations [1]. It was a very neat little analysis, first published at this blog. It was a neat little analysis that was, for the most part, ignored.

Back then, meteorologist Anthony Watts was busy documenting evidence of problems with the official temperature record in the US because of poor placement of weather stations and Ross McKitrick was attempting to calculate just how artificially elevated temperatures might be as a consequence.

Then interestingly, just last month, John Hinderaker cited the original study by Mr Hammer at Powerline [2] and other studies, concluding:

‘These disclosures highlight a key fact with respect to global temperature data: the data sets are utterly lacking in integrity. Global warming alarmists confidently announce that worldwide temperatures have risen by, say .1 degree over a decade. It would be extraordinarily difficult to take measurements at many locations around the globe that would actually demonstrate that proposition. But the real situation is much worse: no one tells you what temperatures were actually measured at the world’s weather stations. Rather, they report claims of global warming based on “adjusted” temperature data–adjusted by alarmists, with the systematic purpose of manufacturing a rising temperature trend. If you subtract the “adjustments,” it may well be that there has been no net warming over the last 100 years at all.’

Ho Hum. But no one was publishing the proof in the technical literature.

[Read more…] about Your Temperatures Diddled

Filed Under: Humour, Information, Opinion Tagged With: Climate & Climate Change, Temperatures

  • Go to page 1
  • Go to page 2
  • Go to page 3
  • Interim pages omitted …
  • Go to page 9
  • Go to Next Page »

Primary Sidebar

Recent Comments

  • Ian Thomson on Vax-ed as Sick as Unvax-ed, Amongst My Friends
  • Dave Ross on Vax-ed as Sick as Unvax-ed, Amongst My Friends
  • Dave Ross on Vax-ed as Sick as Unvax-ed, Amongst My Friends
  • Alex on Incarceration Nation: Frightened of Ivermectin, and Dihydrogen monoxide
  • Wilhelm Grimm III on Incarceration Nation: Frightened of Ivermectin, and Dihydrogen monoxide

Subscribe For News Updates

  • This field is for validation purposes and should be left unchanged.

November 2025
M T W T F S S
 12
3456789
10111213141516
17181920212223
24252627282930
« Jan    

Archives

Footer

About Me

Jennifer Marohasy Jennifer Marohasy BSc PhD has worked in industry and government. She is currently researching a novel technique for long-range weather forecasting funded by the B. Macfie Family Foundation. Read more

Subscribe For News Updates

Subscribe Me

Contact Me

To get in touch with Jennifer call 0418873222 or international call +61418873222.

Email: jennifermarohasy at gmail.com

Connect With Me

  • Facebook
  • LinkedIn
  • RSS
  • Twitter
  • YouTube

Copyright © 2014 - 2018 Jennifer Marohasy. All rights reserved. | Legal

Website by 46digital