• Skip to primary navigation
  • Skip to main content
  • Skip to primary sidebar
  • Skip to footer
Jennifer Marohasy

Jennifer Marohasy

a forum for the discussion of issues concerning the natural environment

  • Home
  • About
  • Publications
  • Speaker
  • Blog
  • Temperatures
  • Coral Reefs
  • Contact
  • Subscribe

Michael Hammer

AGW Falsified: NOAA Long Wave Radiation Data Incompatible with the Theory of Anthropogenic Global Warming

December 17, 2013 By Michael Hammer

ANTHROPOGENIC Global Warming (AGW) theory claims the earth is warming because rising CO2 is like a blanket, reducing Earth’s energy loss to space. However, data from the US National Oceanic and Atmospheric Administration (NOAA) shows that at least for the last 30 years, Earth’s energy loss to space has been rising. The last 30 years of NOAA data is not compatible with the theory of AGW. It would appear that either 30 years of NOAA data is wrong or the theory of AGW is flawed. This is Michael Hammer’s conclusion following analysis of the official outgoing long wave radiation (OLR) data.

Read the complete article here: ‘The NOAA Outgoing Long Wave Radiation Data Appears to be Incompatible with The Theory of Anthropogenic Global Warming’ by Michael Hammer. Michael Hammer Chart
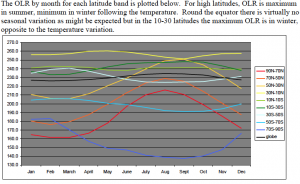
The research uncovers some interesting trends and most importantly highlights that:

1. Earth can only warm if the rate of energy input exceeds the rate of energy loss;

2. Thus earth would warm if energy absorbed from the sun increased or energy loss to space (outgoing longwave radiation or OLR for short) decreased – or of course both;

3. The theory of AGW claims that Earth is warming because rising CO2 is reducing the energy loss to space i.e. is causing OLR to decrease;

4. Thirty years of experimental data published by NOAA (one of the prime AGW reference sites) shows OLR has been rising progressively between 1980 and 2010 and is now 2.5 watt/sqM higher than in 1980; and

5. The period between 1980 and 2010 is when almost all the CO2 induced warming is supposed to have taken place.

“If the corner stone of AGW theory says earth is warming because outgoing long wave radiation is decreasing yet 30 years of experimental data shows OLR is rising (remember 30 years is the time AGW proponents claim is the interval necessary to separate climate from weather) it would seem the theory of AGW is as a minimum extremely seriously compromised.”

Read the complete article here: https://jennifermarohasy.com.dev.internet-thinking.com.au/wp-content/uploads/2013/12/AGW_Falsified_Michael_Hammer.pdf

****
Michael Hammer has a B Eng Sci and M Eng Sci from Melbourne university. His original training was as an electrical engineer but for the last 35 years he has been employed to carry out research across a wide range of technologies for a major multinational spectroscopy company. Over that time he has taken around 20 patents and his work has resulted in a significant number of commercially successful products.

To read older blog posts from Michael Hammer click here and scroll down: https://jennifermarohasy.com.dev.internet-thinking.com.au/author/michael-hammer/

Filed Under: Information, News Tagged With: Climate & Climate Change

Why I am an Anthropogenic Global Warming Sceptic: Michael Hammer

September 21, 2009 By Michael Hammer

I HAVE been asked several times ‘why am I so sceptical of the anthropogenic global warming (AGW) hypothesis’?  There are many reasons, some of which I have documented in previous articles at this weblog, but these have relied on sometimes complex calculations which I admit can be difficult to appreciate.  So I would like to outline here a few of my reasons based only on simple consistency with the AGW proponents’ own data.

1.  The AGW movement claims there has been a global temperature rise of 0.5C over the last 60 years and that this is due to increasing CO2.  Both AGW proponents and sceptics accept that the relationship between energy retained and CO2 concentration is logarithmic (a constant increase in retained energy for each doubling of CO2).  The AGW movement data also shows that since 1900 CO2 has risen by very close to half a doubling  over this 60 year period.

IPCC have claimed in their 4th assessment report (summary for policy makers), that the most likely temperature rise by 2070, when CO2 will have risen by a further half doubling to twice the level in 1900, is a further 3C rise  (page 12).  Why would the first half doubling give 0.5C rise while the second half doubling gives 3C or 6 times as much rise?

2.  One claim I have heard is that it takes the climate a long time to respond to the change in CO2 concentration and we have not yet seen the entire rise from the first half doubling.  The same IPCC 4th assessment report (page 12, 13 and 14) indicates that if CO2 were stabilised at the current level, the temperature would rise by a further 0.2C over 2 decades stabilising at 0.7C above the 1900 level. 

If the current temperature rise is not yet at the equilibrium level then for the business as usual scenario the temperature rise by 2070 will also not be at the equilibrium level.  Yet the IPCC data suggests the equilibrium rise from the first half doubling is not even one quarter of the less than equilibrium rise from the second half doubling.  To me this is illogical.

3.   IPCC claim an increase in retained energy of around 3.7 watts/sqM for each doubling of CO2 (1.66 watts/sqM for the current rise page 4).  They admit this is much too small to result in a 3+ degree temperature rise.  The large temperature rise is based on claims of very large net positive feedback in the climate system.   [Read more…] about Why I am an Anthropogenic Global Warming Sceptic: Michael Hammer

Filed Under: Opinion Tagged With: Climate & Climate Change, Philosophy

A Climate Change Paradox (Part 2)

July 14, 2009 By Michael Hammer

ocean heat hammer blogAUSTRALIA’S Minister for Climate Change, Penny Wong, recently suggested that most of the global warming since 1960, about 85 percent, has happened in the oceans and that change in ocean heat content is thus the most appropriate measure of global warming.
 
In my previous post, working from first principles, I determined a discrepancy of 9:1 in the rate of warming from Australian government data relative to IPCC findings.  In reviewing these calculations I now realise I made a significant error.  I had wrongly assumed that the claimed positive feedback from water vapour was proportional to the carbon dioxide concentration.  This is not correct, the claimed positive feedback is proportional to the temperature rise and that change does make a difference to the calculations and needs to be corrected.  The revised calculations still show a paradox although only about 3:1. 

[Read more…] about A Climate Change Paradox (Part 2)

Filed Under: News, Opinion Tagged With: Climate & Climate Change

A Climate Change Paradox

July 5, 2009 By Michael Hammer

ocean heat hammer blogAUSTRALIA’S Minister for Climate Change, Penny Wong, recently suggested that most of the global warming since 1960, about 85 percent, has happened in the oceans and that change in ocean heat content is thus the most appropriate measure of global warming. 
 
But, calculating from first principles, according to this data the oceans have absorbed far less energy than the IPCC estimates for the impact of rising carbon dioxide levels.  While the government data suggests a warming rate of 0.38 watts/ m2 the IPCC data suggests a warming rate of 3.6 watts/ m2 .  This is a significant discrepancy of nearly 10:1 and needs to be resolved.  If the oceans really are the major heat sink for the planet where is the rest of the energy going?  Alternatively, is the error in the IPCC estimates.

**************

UPDATE JULY 14, 2009

While in the following calculations I determined a discrepancy of 9:1 in the rate of warming from Australian government data relative to IPCC findings.  In reviewing these calculations I now realise I made a significant error.  I had wrongly assumed that the claimed positive feedback from water vapour was proportional to the carbon dioxide concentration.  This is not correct, the claimed positive feedback is proportional to the temperature rise and that change does make a difference to the calculations and needs to be corrected.  The revised calculations still show a paradox although only about 3:1.

READ MORE HERE: https://jennifermarohasy.com.dev.internet-thinking.com.au/blog/2009/07/a-climate-change-paradox-part-2/ 

*************************

Here’s my logic:

On June 24, 2009, the Minister for Climate Change posted ‘Response to Senator Fielding’s questions about the climate change science’ ( http://www.environment.gov.au/minister/wong/2009/tr20090624c.html ).

This article included the above graph and comments reproduced below.  The straight red line on the ocean heat content graph, however, is my addition and was not part of the original article.  The line was placed by eye and is not claimed to be a least squares line of best fit.

The quoted items below are taken from the Minister’s website. 
 
“In terms of the climate system as a whole, only about five percent of the warming since 1960 has taken place in the air.”

“Most of warming since 1960 (about 85 percent) has happened in the oceans. Thus, in terms of a single indicator of global warming, change in ocean heat content is the most appropriate.”

“The change in ocean heat content since 1960 is shown in the figure below. Note the significant warming trend since 1998.”

I note that the graph is labeled ocean heat content which cannot be correct given that the value is shown as zero prior to 1975.  However the text suggests it is actually change in ocean heat content which would seem reasonable.  I have assumed that to be the case.
 
The graph shows that over the last 30 years the oceans have absorbed 15*1022 joules of energy and as the red line shows this has been very close to linear over that time.  Using a linear approximation implies the oceans have absorbed about 15*1022 / 30 or 5*1021 joules per year.
 
How does this compare with the claimed degree of global warming from rising carbon dioxide – expressed in watts / m2.  Convert ocean warming first to watts =  joules per second.  There are 60 * 60 * 24 * 365 seconds per year = 3.15*107 seconds per year.  So the oceans are absorbing 5*1021 / 3.15*107 joules per second = 1.6*1014 watts
 
Now to get watts / m2 we need to divide the watts by the surface area of Earth. The Earth is a sphere of radius 3960 miles = 6336 km.  Its surface area = 4*pi*radius2 = 5*108 sq km (Wikipedia quotes 5.1*108 sq km).  Since there are 106 m2 per km2 this equates to 5*1014 m2.  Thus the oceans are absorbing energy at the rate of 1.6*1014 / 5*1014 watts/ m2 which equals 0.32 watts/ m2. 
 
The article states that 85 percent of the warming has taken place in the oceans which would seem to be saying that 85 percent of the retained heat due to AGW is being stored in the oceans.  From this it follows that the total retained heat is 0.32/0.85 or 0.38 watts/ m2.
  
The Intergovernmental Panel on Climate Change in their 4th assessment report (summary for policy makers) claim (page 12, 4th bullet point) that “…..global average surface warming following a doubling of carbon dioxide concentrations.  It is likely to be in the range 2 to 4.5C with a best estimate of about 3C”. 
 
Now to get a 3C rise at the average claimed emission temperature (255K) requires an additional energy input (additional energy retained by greenhouse gases) of 11.3 watts/ m2.  This assumes the 3C is an equilibrium level.  If it is not then the retained energy must be still higher so the 11.3 is a minimum figure. 
 
The ocean heat graph from the Minister ends in 2006.  According to Mauna Loa data in 2006 the carbon dioxide concentration was 383 ppm which represents 0.45 doublings and hence an increase in global warming retained energy of 11.3 * 0.45 = 5.1 watts/ m2.  Not all of this represents energy absorbed by the planet because of the claim that the planet has warmed.  This warming will increase the energy radiated back out to space. 
 
The  Climate Research Unit at the University of East Anglia ( http://www.cru.uea.ac.uk/cru/info/warming/ )  shows the claimed warming in 2006 was 0.4C.  SkepticalScience.com ( http://www.skepticalscience.com/global-warming-stopped-in-1998.htm ) shows temperature rise graphs from three sources and all show about 0.4C temperature rise in 2006.  Using the same claimed effective emission temperature as above (255k), a rise of 0.4C will increase emitted energy by 1.5 watts/ m2.  Thus the net additional energy retained by Earth will be 5.1 – 1.5 =  3.6 watts/ m2.  
 
This presents a considerable conflict.  Ocean heat assessment suggests earth is gaining energy at the rate of 0.38 watts/ m2 while carbon dioxide analysis suggests the rate is 3.6 watts/ m2.  This is a difference of nearly 10:1 in two different analyses of the same quantity.  Both cannot be right.
 
I note that the Minister specifically draws attention to the “significant warming trend since 1998”.  This could be taken to mean a claim that the linear slope does not apply. 
 
This is a somewhat risky assumption since there are other periods where the slope is well above the slope of the red line.  None the less, using the local slope over the years since 1998 corresponds to about 8.8*1021 instead of the average of 5*1021.  That would make the retained heat in the oceans about 0.56 watts/ m2 for a total retained heat of 0.66 watts/ m2.  This is still 5.5 times lower than IPCC claim for the impact of carbon dioxide.  Also, if we accept the higher slope since 1998 it means the average ocean energy absorption over the earlier years is reduced to 8*1022 joules over 23 years corresponding to 0.22 watts / m2.  Since the carbon dioxide concentration from the Mauna Loa data in 1998 was 366.6 ppm this represents 0.39 doublings equivalent to an additional 4.4 watts / m2 or about 3 watts/ m2 after allowing for temperature rise making the discrepancy over those years worse (3 vs 0.22 is a ratio of 13.6:1)..
 
What the Minister’s own data shows is that the oceans have only absorbed between about 9 and 14 percent of the excess anthropogenic global warming energy implied by IPCC data.  Yet they claim the ocean absorption represents 85 percent of this energy.  The oceans are by far the biggest heat sink on the planet.  If they are only absorbing at most 14 percent of the excess energy it is extremely difficult to see where the rest of the energy could be going.
 
Could the error be in the ocean heat content – maybe the exponent should be 23 not 22?  Oceans cover 70 percent of the Earth’s surface or 3.5 *1014 m2.  If the energy is spread over the top 700 m as the graph caption states, the volume of water is 3.5 * 700 * 1014 =  2.45 * 1017  m3 .  Water has a thermal capacity of 4.18 million joules per degree per m3.  Hence the 15 * 1022 joules will raise the surface ocean temperature by  15 * 1022 / ( 2.45 * 1017 * 4.18 * 106 ) degrees =  0.15C  (This by the way is exactly the same result as Bill Kinninmonth cited in his email to Professor English reproduced on Joanne Nova’s website.).  This result assumes the energy is distributed uniformly throughout the 700 meter depth.  If it is concentrated near the surface the rise would be higher.  To match the IPCC predictions the energy absorption would have to be 5.5 to 10 times higher suggesting an ocean temperature rise of at least 0.8C to 1.5C over the last 30 years.  No such rise has been reported.
 
It would seem that the only plausible alternative left is that the error is in the IPCC estimates and that the current value should be about 1.5 +0.38 = 1.88watts/ m2 (additional energy radiated plus rate of energy storage in the oceans).  If so by 2070 the additional energy input over today would be 1.88 * 0.55/0.45 = 2.3 watts / m2 (We have had 0.45 doublings with a further 0.55 to go by 2070.). 
 
Such an energy rise at equilibrium would give an additional temperature increase of 0.6C.  This is of course if we assume that the currently claimed temperature rise is correct and is all due to carbon dioxide.
 
So many assumptions and such a paradox!

Michael Hammer,
Melbourne, Australia

*****************
 
Notes and Links

This article has been cross-posted at Joanne Nova:  http://joannenova.com.au/2009/07/06/the-antidote-to-150-million-quadrillion-joules/ 

More from Michael Hammer here: https://jennifermarohasy.com.dev.internet-thinking.com.au/blog/author/michael-hammer/ 

Related information:

http://wattsupwiththat.com/2009/06/02/anomalous-spike-in-ocean-heat-content/#more-8132
 
http://www.woodfortrees.org/plot/hadcrut3vgl/from:1994/to:2010/scale:0.1/mean:10/plot/hadsst2gl/from:1994/to:2010/scale:0.1/mean:10/plot/uah/from:1994/to:2010/scale:0.1/mean:10 

http://www.sciencemag.org/cgi/content/abstract/309/5732/284  versus 
http://www.john-daly.com/mobydick/oceans.htm

Filed Under: News, Opinion Tagged With: Climate & Climate Change

How the US Temperature Record is Adjusted

June 27, 2009 By Michael Hammer

There has been criticism of the potential for official weather stations in the USA to record artificially high temperatures because of the changing environments in which they exist, for example, new asphalt, new building or new air conditioning outlets.   Meteorologist, Anthony Watts, has documented evidence of the problem and Canadian academic, Ross McKitrick, has attempted to calculate just how artificially elevated temperatures might be as a consequence.

A reader of this blog, Michael Hammer, recently studied the official data from the US official weather stations and in particular how it is adjusted after it has been collected.   Mr Hammer concludes that the temperature rise profile claimed by the US government is largely if not entirely an artefact of the adjustments applied after the raw data is collected from the weather stations.

[Read more…] about How the US Temperature Record is Adjusted

Filed Under: Opinion Tagged With: Climate & Climate Change

Hot City or Global Warming?

June 11, 2009 By Michael Hammer

An analysis of the historical temperature data for the state of Victoria in Australia, including the city of Melbourne, suggests an Urban Heat Island (UHI) effect but no general warming trend.

Urban Heat Island versus Global Warming – A Study of One Region
By Michael Hammer

CITIES represent concentrations of commerce and energy use.  This energy release raises the temperatures in the immediate vicinity.  Cities are also areas where there is intense development with extensive masonry constructions, skyscrapers, paved surfaces and little vegetation.

[Read more…] about Hot City or Global Warming?

Filed Under: Opinion Tagged With: Climate & Climate Change

  • Go to page 1
  • Go to page 2
  • Go to Next Page »

Primary Sidebar

Recent Comments

  • Ian Thomson on Vax-ed as Sick as Unvax-ed, Amongst My Friends
  • Dave Ross on Vax-ed as Sick as Unvax-ed, Amongst My Friends
  • Dave Ross on Vax-ed as Sick as Unvax-ed, Amongst My Friends
  • Alex on Incarceration Nation: Frightened of Ivermectin, and Dihydrogen monoxide
  • Wilhelm Grimm III on Incarceration Nation: Frightened of Ivermectin, and Dihydrogen monoxide

Subscribe For News Updates

  • This field is for validation purposes and should be left unchanged.

November 2025
M T W T F S S
 12
3456789
10111213141516
17181920212223
24252627282930
« Jan    

Archives

Footer

About Me

Jennifer Marohasy Jennifer Marohasy BSc PhD has worked in industry and government. She is currently researching a novel technique for long-range weather forecasting funded by the B. Macfie Family Foundation. Read more

Subscribe For News Updates

Subscribe Me

Contact Me

To get in touch with Jennifer call 0418873222 or international call +61418873222.

Email: jennifermarohasy at gmail.com

Connect With Me

  • Facebook
  • LinkedIn
  • RSS
  • Twitter
  • YouTube

Copyright © 2014 - 2018 Jennifer Marohasy. All rights reserved. | Legal

Website by 46digital