• Skip to primary navigation
  • Skip to main content
  • Skip to primary sidebar
  • Skip to footer
Jennifer Marohasy

Jennifer Marohasy

a forum for the discussion of issues concerning the natural environment

  • Home
  • About
  • Publications
  • Speaker
  • Blog
  • Temperatures
  • Coral Reefs
  • Contact
  • Subscribe

jennifer

Last Year, 2013: A Hot Year for Australia

January 7, 2014 By jennifer

ANOTHER year, and another announcement from the Australian Bureau of Meteorology that it is getting hotter. Indeed on January 3, 2014, David Jones, Manager of Climate Monitoring and Predictions at the Bureau, explained in a radio interview that: “We know every place across Australia is getting hotter, and very similarly almost every place on this planet. So, you know, we know it is getting hotter and we know it will continue to get hotter. It’s a reality, and something we will be living with for the rest of this century.”

I’m not sure that its going to continue to get hotter, but last year was hot.

According to Dr Jones, the hottest place in 2013 was Moomba in South Australia where a temperature of 49.6°C was recorded in January. What Dr Jones didn’t explain, however, is that temperatures have only been recorded at Moomba since 1995. So we don’t actually know how hot it was at Moomba during the federation drought or in 1939.

I’ve been following trends at Bathurst where temperatures have been recorded at the jail since 1858 and at the agricultural college since 1908. In October, after plotting days when maximum temperatures exceeded 35 degree Celsius, I indicated that there has been no increase in hot days at Bathurst, http://www.mythandthemurray.org/no-increase-in-hot-days-at-bathurst-or-the-misguided-politics-of-attributing-bushfires-to-global-warming/ .

But after plotting the really hot days through until the end of 2013, I’m happy to concede that it’s virtually as hot now as it was back in 1939, Chart 1. On 11th January 1939 temperatures climbed to 40.7 degrees at the Bathurst agricultural station. In January last year it reached 40.2 degrees. Furthermore, when averages maximum temperatures are combined for each year, there appears to be a slight warming trend, Chart 2.

Charts 1 n 2

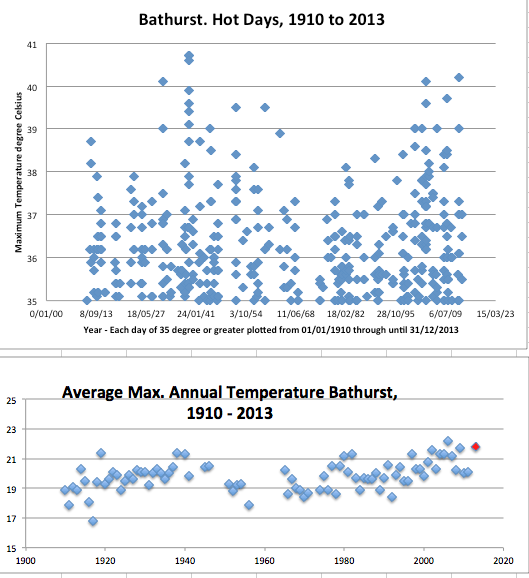
Unfortunately, the average for the year 1939 is not shown in Chart 2 as maximum daily temperatures are not available in the digitized record for May through to September of that year for this site. The hottest year at the Bathurst agricultural college according to this statistic (whereby maximum daily temperatures are averaged for the year) was 2006 with an annual average maximum daily temperature of 22.2 degrees compared to an average maximum for 2013 of 21.8 degrees.

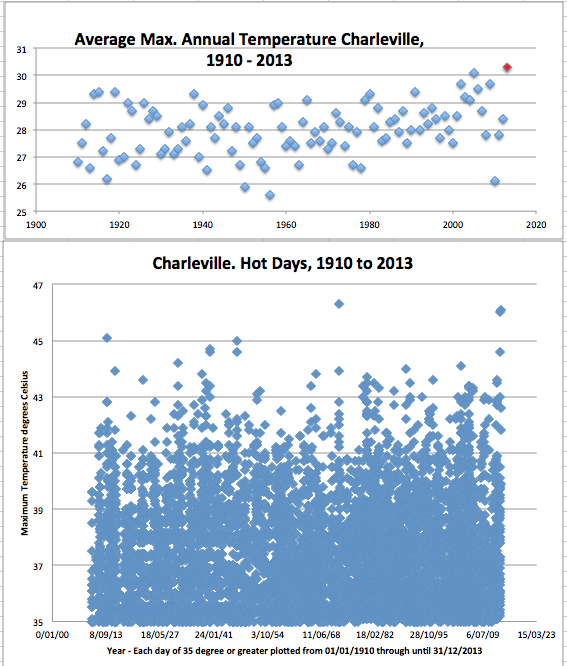
If we go further north to western Queensland and consider the long temperature trend for Charleville, then last year appears to be a record hot year, Chart 3. All years are shown from 1910 based on my averaging of the available daily maximum values from the Bureau’s homogenized ACORN* data set to the end of 2012. I’ve relied on the raw daily values for 2013. I’ve made no adjustments for missing values in this record and have not compared the raw data to the end of 2012 with the ACORN-SAT adjusted data.*

When individual hot days are plotted for Charleville, the hottest day at 46.3 degree Celsius shows as 4th January 1973, Chart 4. This is closely followed by 46.0 degrees recorded just last year on 29th December 2013. And just a few days ago, on 3rd January 2014, it was 46.1 degrees at Charleville.

Charts 3 and 4 revised

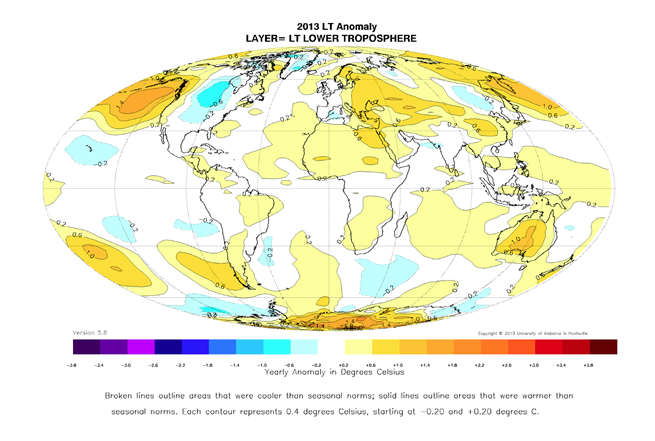
The hotter than average conditions in Australia for 2013 show up in the satellite record as published by the University of Alabama in Huntsville, Chart 5. According to this record, globally 2013 was the fourth warmest year since measurements began in 1978, http://wattsupwiththat.com/2014/01/03/global-temperature-report-december-2013/ .

Satellite Temps 2013

*****

ACORN-SAT is the Australian Climate Observations Reference Network – Surface Air Temperature. Data can be downloaded here http://www.bom.gov.au/climate/change/acorn-sat/ .

Ken Stewart, John Sayers, Jo Nova and others have shown up many issues with this database, for example, http://joannenova.com.au/2012/06/threat-of-anao-audit-means-australias-bom-throws-out-temperature-set-starts-again-gets-same-results/ . It nevertheless remains a useful source of information. For the Bathurst agricultural station the long unadjusted data set (recently purchased by me from the Bureau) accords well with the publically available ACORN dataset. I have no particular opinion on the reliability of the Charleville ACORN data as I do not have access to the unadjusted Charleville data before 1948.

Filed Under: Information, News Tagged With: Climate & Climate Change, Temperatures

King Tides at Cleveland Point, and Sea Level Change Over the Holocene

January 4, 2014 By jennifer

ANOTHER year, and I’ve received another photograph from the Spangled Drongo, a regular commentator at this weblog who visits a waterfront property at Cleveland Point, Moreton Bay, Queensland, Australia, around this time of year.

Spangled is getting older, and back in the late 1940s and early 1950s he remembers the King Tides used to cover the law by about an inch or so.

This time last year, with the barometer reading normal, Spangled saw the King Tide was about 30cm below the lawn height and sent us a photograph, https://jennifermarohasy.com.dev.internet-thinking.com.au/2013/01/king-tide-not-so-high/

This year, according to Spangled, the highest astronomical tides were lower by around 20 cm and 10 cm respectively due to a small surge from the north. The first day of the King Tide, on January 2, Spangled says that the barometer was reading 1012 hPa and then yesterday (January 3) it was reading 1002 hPa.

Cleveland, January 3, 2014

Of course sea levels vary around a coastline depending not only on the tides, but also melting poles (climate change), land subsidence and vertical land motion (tectonic and isostatic phenomena). So around Britain the deglaciation of Scotland that occurred thousands of years ago means the northern part of that landmass is still adjusting and shows uplift (relative sea-level fall) while southern England shows subsidence (relative sea-level rise).[1]

Along the Australian east coast it is well document in the scientific literature that sea level was higher during the mid-Holocene around 6,000 years ago and have fallen in total about 2 m to more or less the present position over the last few thousand years. This is consistent with global climatic change over this period, in particular an overall trend of global cooling since the early Holocene.

So while the Bureau of Meteorology and CSIRO may nag on about a few centimeters of sea level rise over perhaps the last hundred years, the overall more significant trend during the present geological epoch, the Holocene, is one of sea level fall. The only real point of contention seems to be whether the fall has been smooth or oscillating over the last few thousand years.[2]

PS. I shall make some comment on the latest claims from the Bureau of Meteorology that 2013 was the hottest year ever in due course after I have had time to look properly at the data. In the meantime, my blog post from March is still very relevant https://jennifermarohasy.com.dev.internet-thinking.com.au/2013/03/cooking-books-for-hot-summers/

***
References

1. This is all nicely explained in a paper by Ian Shennan et al. entitled Late Holocene vertical land motion and relative sea-level changes: lessons from the British Isles published in the Journal of Quarternary Science (volume 27, pages 64-70).

2. Lewis et al. published a controversial summary in Terra Nova (volume 20, pages 74-81) entitled Mid-late Holocene sea-level variability in eastern Australia.

Filed Under: Information, News Tagged With: sea level change

Open Thread, & Happy New Year

December 31, 2013 By jennifer

Inconvenient Truth

Filed Under: Humour

When Is the Right Time to Abandon Ship?

December 30, 2013 By jennifer

IN September, Patrick J. Michaels likened the Intergovernmental Panel on Climate Change to a treed cat. He wrote, “Instead of closing its eyes and scurrying to the ground, it climbs onto even higher and thinner branches, while yowling ever louder.”

Dr Michaels then went on to ask, how does the IPCC back down from a quarter-century of predicting a quarter of a degree (Celsius) of warming every decade, when there’s been none for 17 years now?

Chris Turney, professor of climate change at the University of New South Wales, could be described as a cat stuck on a high branch tweeting, but he’s actually at the Antarctic and should be considering abandoning ship, except that there is no clear water into which to launch a life raft.

According to the website Boatsafe.com it can be a difficult decision knowing just when to make the call and it is quite common for captains to wait too long to successfully get clear of a floundering foundering boat.

Four days ago the Professor Captain tweeted: “Great news. Icebreaker Snow Dragon on horizon with penguins! Everyone very happy!”Penguins_n_SnowDragon

Happy because the Chinese ice-breaking vessel Snow Dragon was expected to clear a path for the stricken ship by Friday night, avoiding the need to abandon ship.

That was after this 233-foot-long Russian-flagged ship sent out a distress signal on Christmas Eve, which was picked up by the Falmouth Maritime Rescue Coordination Center, in the U.K. As the floundering ship is in the Australian search-and-rescue region, the message was passed on to AMSA, and three ice-breaking ships were sent to the rescue.

So far there has been no mention of the climate by the professor of climate change.

But some positive reporting of the weather.

When it looked like the Snow Dragon would be unsuccessful in its bid to cut through 20 kilometres of sea ice frozen to an average depth of perhaps 10 metres, Professor Captain Turney explained that the weather had improved and the ship was no longer in a blizzard.

So, presumably no need to abandon ship.

Next day the Professor Captain tweeted that the ice was cracking. Still no mention of climate. But this time he did report that the weather had deteriorated with snowfalls and stronger winds.

Still no suggestion they abandon ship. In fact Turney tweeted confidently that the second ice-breaker, an Australian ship the Aurora, would be able to successfully rescue them. This despite reports that there was a growing distance between their floundering stricken ship and open water.

Oh. And wind conditions were putting a lot of strain on one side. Turney added that, “The build-up of ice on one side has given it quite a tilt.”

Not the climate, but the ship.

In fact must be five days stranded now, no clear water, and no mention of climate change.

I am surprised because there is surely potential for some simple climate change type calculations that could be done by the many scientists onboard.

For example, Professor Captain Turney has explained that sea ice can buildup fast because of high winds. Note. High winds, no mention of climate change.

But let me continue.

When the Captain Professor first realized there was no open channel through the ice they were only about two nautical miles from open water. Next thing, more than 20 miles of ice had built up. Now it’s apparently closer to 50 kilometers.

As someone genuinely interested in climate change I ask, “Given the tilting ship, is about 2,800 kilometres south of Hobart, if this catastrophic cooling trend continues, how many days before it is possible to skate across Bass Strait, from Hobart to Melbourne?”

But I digress. Back to the key issue: When is the right time to abandon ship?

As I write the distance between open water with the ice breakers and the tilting ship is somewhere in the vicinity of 50 kilometres. I don’t know how many penguins.

Of possible significance they are running out of coffee.

***
Sources of information
http://www.cato.org/publications/commentary/ipcc-political-suicide-pill

http://worldnews.nbcnews.com/_news/2013/12/27/22059393-great-news-rescue-vessel-within-sight-of-explorer-ship-stuck-in-antarctic-ice

http://www.news.com.au/travel/travel-updates/rescue-vessel-near-university-nsw-professor-chris-turneys-icetrapped-cruise-ship/story-fnizu68q-1226790782675

http://worldnews.nbcnews.com/_news/2013/12/27/22068563-icebergs-blizzards-and-a-creaking-ship-antarctic-explorers-tense-wait-for-rescue?lite

http://www.iol.co.za/scitech/science/environment/vessel-still-stuck-in-antarctic-ice-1.1627313#.UsFrbf2Tqro

Filed Under: Humour, Information Tagged With: Climate & Climate Change

Carbon Off-setting an Expedition to the Antarctic

December 28, 2013 By jennifer

CHRIS Turney is professor of climate change at the University of New South Wales. He recently set off on a 233-foot-long Russian-flagged ship with 70 or so colleagues to check-out the climate by following in the footsteps of famous explorer Douglas Mawson’s 1912 expedition to the Antarctic.

I’m assuming that the ship is running on diesel. So it would be incurring a “carbon debit”. Did Professor Turney make provisions to off-set this debit before he set off?

According to David Suzuki the first thing to consider before buying carbon offsets is:

“Know your carbon footprint and understand what your largest sources of emissions are. Ensure that you include all of your major emission sources, such as electricity consumption, fuel use, and travel.”

Since setting off, the ship has got stuck in ice. Three ice breaker ships have set-off to rescue it.

Should the fuel consumption of the three ice breakers also be included in Professor Turney’s carbon offset calculations?

None of this information about carbon offsets is being communicated by Professor Turney who is sending out lots of tweets and some blog posts. I’m also wondering what the Professor has discovered about climate change and the change in ice cover at the Antarctic since 1912 when Douglas Mawson ventured down there.

Filed Under: Information Tagged With: Climate & Climate Change

Seasons Greetings from the Capricorn Coast

December 23, 2013 By jennifer

I have a home not far from an ICOLL (Intermittently Closed and Open Lake and/or Lagoon) at the bottom of Lammermoor Creek on the Capricorn Coast.

There is a sandbar across the top of the lagoon that stops it emptying at low tide, but allows the sea to fill it on a very high tide.

That was until very recently when the sea pushed in a whole lot more sand, in fact so much sand that the tide can’t top the lagoon up with water at the moment. From the pictures you can see that the trunk of the casuarina in April was high above the lagoon, but now is partially covered in sand.

The ICOLL
Note Casuarina
Orchid flowering
Lammermoor Beach
Casuarina covered
Lagoon drying

If this were the Lower Murray ‘they’ would blame the upstream irrigators.

Season’s Greetings.

****
Click on each photograph to bring up the individual image, and then click a second time to bring up a larger, clearer image… the orchid is especially good in close-up. The last image, photograph looking down at the last of the water in the drying lagoon, is much clearer in close-up. You can see my beautiful daughter if you look at the close-up of the second last image.

Filed Under: Information Tagged With: ICOLL

  • « Go to Previous Page
  • Go to page 1
  • Interim pages omitted …
  • Go to page 45
  • Go to page 46
  • Go to page 47
  • Go to page 48
  • Go to page 49
  • Interim pages omitted …
  • Go to page 445
  • Go to Next Page »

Primary Sidebar

Recent Comments

  • Ian Thomson on Vax-ed as Sick as Unvax-ed, Amongst My Friends
  • Dave Ross on Vax-ed as Sick as Unvax-ed, Amongst My Friends
  • Dave Ross on Vax-ed as Sick as Unvax-ed, Amongst My Friends
  • Alex on Incarceration Nation: Frightened of Ivermectin, and Dihydrogen monoxide
  • Wilhelm Grimm III on Incarceration Nation: Frightened of Ivermectin, and Dihydrogen monoxide

Subscribe For News Updates

  • This field is for validation purposes and should be left unchanged.

November 2025
M T W T F S S
 12
3456789
10111213141516
17181920212223
24252627282930
« Jan    

Archives

Footer

About Me

Jennifer Marohasy Jennifer Marohasy BSc PhD has worked in industry and government. She is currently researching a novel technique for long-range weather forecasting funded by the B. Macfie Family Foundation. Read more

Subscribe For News Updates

Subscribe Me

Contact Me

To get in touch with Jennifer call 0418873222 or international call +61418873222.

Email: jennifermarohasy at gmail.com

Connect With Me

  • Facebook
  • LinkedIn
  • RSS
  • Twitter
  • YouTube

Copyright © 2014 - 2018 Jennifer Marohasy. All rights reserved. | Legal

Website by 46digital