• Skip to primary navigation
  • Skip to main content
  • Skip to primary sidebar
  • Skip to footer
Jennifer Marohasy

Jennifer Marohasy

a forum for the discussion of issues concerning the natural environment

  • Home
  • About
  • Publications
  • Speaker
  • Blog
  • Temperatures
  • Coral Reefs
  • Contact
  • Subscribe

jennifer

Extending the Official Temperature Record Back in Time (Part 1: Bourke)

March 26, 2014 By jennifer

I HAVE repeatedly argued that it is important for Australians to have a better understanding of natural historical temperature variability. I have also stressed that this can not be achieved by the Australian Bureau of Meteorology reporting on a contrived national annual average temperature each year, particularly given that this mean is based on an adjusted and homogenised official record that only begins in 1910.

In a recent letter to Minister Hunt I suggested that the official temperature record for individual localities, where possible, should be extended back in time. I reiterated that the current start date of 1910 for all official records is arbitrary and excludes valuable temperature recordings including those made through the Federation Drought (1896 to 1902).

In recent correspondence concerning my letter to Mr Hunt (but not addressed to me, so I can’t share it at this moment) the Bureau has insisted that temperature records prior to 1910 were reported on more informally and in a range of standard and non-standard ways and are therefore unreliable. Furthermore, it is claimed in supporting materials, that there is no evidence to suggest that the late 1890s and early 1900s were exceptionally hot. A paper by Linden Ashcroft, David Karoly and Joelle Gergis (Australian Meteorological and Oceanographic Journal, Vol 62) is cited in support of this claim.

The Ashcroft et al. paper is not a study of the historical temperature record per se, but rather uses a two-step homogenization process to correct pre-1910 data for select locations in south-eastern Australia.

BREAKING NEWS… Dr Dennis Jensen MP states in the Australian Parliament that the Bureau of Meteorology plays fast and loose with the data and calls for an AUDIT. Watch on YouTube http://youtu.be/WQDjX9uVYMo ****

I am interest in getting a better understanding of the methodology used by Ashcroft et al. and also the reliability of the historical temperature data.

Given the statistical approach they employed, I wonder, for example, if they may have inadvertently and incorrectly adjusted down very hot days during the period of the Federation Drought?

Bourke in central western New South Wales is one of the localities used by Ashcroft et al.

Ian George, a past contributor at this blog with a particular interest in temperature data, has previously brought to my attention adjustments made to data for Bourke in January 1939 with the raw temperatures being reduced by up to 0.9 degrees Celsius in the homogenised official data set. Was a similar methodology applied to the earlier data series by Ashcroft et al.?

Regarding the reliability of the historical data: when was a Stevenson Screen first installed at Bourke? How was the temperature recorded before installation of the Stevenson’s Screen?

The following plot of the annual average maximum temperatures for Bourke theoretically based on the raw unadjusted data was downloaded directly from the Bureau’s website. Does someone know where I can find a plot of the adjusted official annual data for Bourke from 1910 and/or has someone a template that is useful for generating annual values from ACORN daily temperature data – or do I just need to get on and do this myself?

Does someone know how to apply the Ashcroft et al. two-step method to the pre-1910 Bourke data and what might this data series look like?

Update (11pm): A Stevenson Screen was installed at Bourke in August 1908.  An exceptionally high temperature recorded after this date, on 3 January 1909, has nevertheless been expunged from the ‘raw’ temperature record for Bourke by officers at the Bureau.  Even with these unofficial temperature adjustments, it’s evident that temperatures in Bourke have not been increasing since August 1908, rather it would appear, that consistent with the raw temperature data for much of Australia, temperatures have been steady or falling.   The only way the Bureau can get an increasing trend is through data adjustments which should not be necessary anyway post the installation of a Stevenson Screen.


Bourke Annual Mean Max Temp

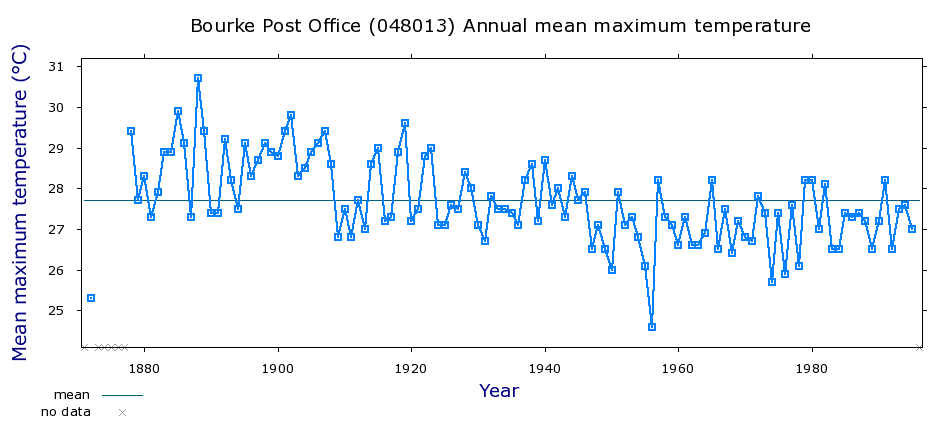
Click on the image/chart to see the entire data series and for a larger view.

***

Some Useful Links

Linden Ashcroft et al. 2012 paper in Australian Meteorological and Oceanographic Journal http://www.bom.gov.au/amoj/docs/2012/ashcroft.pdf

Some of my recent correspondence concerning temperature records and the Bureau https://jennifermarohasy.com.dev.internet-thinking.com.au/correspondence/

Comment made in previous thread by Ian George about Bourke data adjustments https://jennifermarohasy.com.dev.internet-thinking.com.au/wp-content/uploads/2014/03/IanGeorge_AnomalyComment.pdf

Filed Under: Information Tagged With: Temperatures

Part 2 of IPCC Fifth Assessment Report

March 23, 2014 By jennifer

The Intergovernmental Panel on Climate Change’s Fifth Assessment Report (AR5) is being released in four parts with Working Group II due to officially release their contribution on “Impacts, Adaptation and Vulnerability” in Yokohama, Japan, on Monday 31 March.

Comments on the IPCC report, and pre-release publicity, are welcome in the following thread.

For an alternative perspective on climate change the Nongovernmental International Panel on Climate Change (NIPCC) will be posting their second report in the next week or so. In the meantime their March 2014 Archive of Scientific Literature Reviews can be accessed here http://www.nipccreport.org/issues/2014/mar.html

Filed Under: Information Tagged With: Climate & Climate Change

Mega-Drought for Murray Darling, Predicted by Kevin Long

March 21, 2014 By jennifer

I began my most recent newsletter to those subscribed at ‘MythandtheMurray.org’ with reference to the Michael Crichton quote: ‘If you don’t know history, then you don’t know anything. You are a leaf that doesn’t know it is part of a tree.”

I continued by providing a link to a recent blog post where I explain how British Explorer Matthew Flinders missed the Murray River’s mouth when he was mapping the southern Australian coastline in 1802, probably because the Murray’s mouth had closed over.

In response I received an email from Kevin Long explaining that the last mega-drought in the Murray-Darling spanned the period 1790 to 1820.

Kevin Long, a long-range weather forecaster based in Bendigo, Victoria, went on to explain that he believes we are at the beginning of another mega-drought in the Basin because of the solar minimum and phase of the current lunar cycle.

While it is fashionable for many climate scientists, and also social and political commentators, to scoff at the idea that the moon could influence climate, it is not disputed by those with an understanding of conventional physics that the moon’s gravitational field along with the day/night cycle of the spinning earth creates atmospheric tides that modulate high-altitude winds that have a major influence on weather.

The complete email from Kevin Long follows.

While providing a summary of the current extra-terrestrial situation as it affects rainfall in the Murray-Darling, Kevin Long continued with my leaf-tree analogy. In particular suggesting that he is a leaf attached to the big tree of knowledge.

I agree that there exists a vast amount of information concerning astronomy and historical climate patterns. Kevin Long has an intimate knowledge of these patterns as they affect rainfall in the Murray Darling Basin.

Prior to the establishment of the current Australia Bureau of Meteorology in 1909, Australian meteorologist had a keen knowledge of astronomy and considered solar, lunar and planetary cycles in their weather forecasting. I’m told that there was some interest in what was termed ‘solar terrestrial physics’ at the Bureau until the early 1950s. Now this tree of knowledge is ignored.
I’m told modern meteorologists are instead trained in how to interpret the output from general circulation models (GCMs).

It could be that as meteorologists have moved away from a deep knowledge of astronomy, and the influence of the sun, moon and planets on climate cycles, their skill at medium and long-range rainfall forecasting has greatly deteriorated.

Email from Kevin Long…

Hi Jennifer

The historical records you included about Matthew Finders indicate the Murray mouth was closed in 1802. This all fits with the weather cycle as I understand it to be at the time.

That was the middle of the last mega-drought, brought on by the Dalton minimum cycle 1790 to 1820 (three very low and long sun spot cycles only averaging about 35 sun spot number).

The solar minimum cycle repeats every two hundred years or thereabouts.

Just a little more evidence that indicates this leaf is still attached to the big tree of knowledge.

The Murray Darling Basin is subject to long periods of well below average rainfall, this occurs when the northeast lunar air tide cycle is not peaking during the monsoon season.
It takes 9 years for the northeast lunar air tide cycle to progress backwards through the summer months, after which the dryer transition phase takes the next 9 to 10 years to progress back through the summer months, it is during this time that a long drought is most likely to develop. (This year the peak of the northeast air tide is occurring in late November so we are at the start of that long dry period.)

The southern air tide phase that follows during the next 9 year (2025 to 2034) has only a small influence on the top half of the MDB’s rainfall, so if you don’t have above average solar activity the northern half of Australia is likely to remain in a low rainfall sequence for most of the next 28 years of the 37.2-year air tide cycle. It is only when a strong La Nina cycle happens to form, that a few cyclones are likely to be forced inland providing some temporary relief during this long dry period.

Global sea ice is now above the average of the last 35 years and the Antarctic ice is presently about 20% above average for this time of the year. This indicates a dry winter/spring.

The SOI has plunged from +14 to –13 in just over a month. Even the Bureau of Meteorology is now warning of El Nino in the second half of the year. This little leaf blowing in the wind saw it coming months ago.

Cold seas are already dominating the east coast of Australia, and a big slug of cold sea is moving across under Australia, this is very likely to kill the autumn/winter rainfall that the weakening southern air tide is trying to produce. (The air tides get a little weaker every year until 2020 which is the driest part of this 18.6 year lunar declination cycle, otherwise known as the flood and drought cycle.)

Once June has passed there is very little chance of any river filling rains until the next La Nina gets organized, which is not due until 2017. That one is normally the weakest one in the 18.6-year cycle.

If the climate cycle runs true to form you will be able to walk across the Murray mouth, later this decade without getting your feet wet once again. And you will be able to see large 200 year-old dead tree stumps in many of Australia’s deepest dry holes.

Regards Kevin Long
http://www.thelongview.com.au

****
map moon sun

The map shows the position of the sun and the moon relative to the earth at about the time I made this blog post. The day and night world map can be accessed by clicking here… http://www.timeanddate.com/worldclock/sunearth.html

Filed Under: Information Tagged With: lunar cycles, Rainfall forecasting

March Against Democracy

March 16, 2014 By jennifer

JULIA Gillard promised, if she was elected, that there would be no carbon tax. Tony Abbot promised, if he was elected, that he would scrap the carbon tax. But the learned ignorant promote mass action to get their way, all the while claiming tolerance, and respect for democracy. march rally

Many of the posters on display at the ‘March in March’ rallies today, in which tens of thousand gathered in Australia cities to boo capitalists and lament the lack of action on climate change, clearly showed the prejudices of the increasingly vocal, Australian inner city pseudo-intellectual.

As Carl Jung wrote in about 1957, “People go on blithely organizing and believing in the sovereign remedy of mass action, without the least consciousness of the fact that the most powerful organizations can be maintained only by the greatest ruthlessness of their leaders and the cheapest slogans.”

******

Link to original photograph of poster with ‘step aside or be deposed’ from the Sydney Morning Herald http://www.smh.com.au/federal-politics/political-news/tens-of-thousands-gather-for-march-in-march-protest-20140316-34v1x.html

Nick Cater’s book, entitled ‘The Lucky Culture: The Rise of an Australian Ruling Class’, gives great insight into the totems and prejudices of these self-labelled ‘progressives’.

Filed Under: Information, News, Opinion Tagged With: Intolerance, Philosophy

Best Book: Belly of the Beast

March 15, 2014 By jennifer

“AS a generalization, most hunters love animals, most foresters love trees, most fishermen love fish, most miners love rocks and most farmers love the soil.

“Strong proponents of the intrinsic values of wildlife today tend to be intolerant of any uses of wildlife by people, particularly consumptive uses, because the uses clash with the moral and ethical positions they have adopted.

“It does not make intrinsic or use-values right or wrong, but does tend to confirm that intolerance of values held by other peoples and cultures is the root cause of a great deal of conflict in the world today.”

I’m quoting from page 6 of an interesting new book, part philosophy, part history of animal conservation, lots of quirky cartoons, and many case studies from turtles in Cuba to crocodiles in Australia.

Written by someone I much admire, Grahame Webb, entitled Wildlife Conservation: In the Belly of the Beast, it is a must read for anyone who wants to have an informed opinion on wildlife conservation.

More information and order form here… http://www.crocodyluspark.com.au/pages/Wildlife-Conservation-%252d-In-the-Belly-of-the-Beast.html

Belly of the Beast

Filed Under: Books, Information, Opinion Tagged With: Hunting, Wilderness

What Drives Change in Antarctic Sea Ice Cover?

March 11, 2014 By jennifer

THE modern meteorologist relies on computer models for forecasting. Coupled atmospheric-ocean models, known as general circulation models, are favoured for medium to long-range forecasting with these models forecasting an overall and quite rapid general warming at the north and south poles. In accordance with this forecast, there has been a general decline in the extent of sea ice at the Arctic. At the Antarctic, however, sea ice has increased in extent, at least over the period of the satellite record, Figure 1.[1] Sea Ice Cover

I’m interested to know what might have driven the overall decline in the sea ice at the Arctic, and increase at the Antarctic, over the last thirty or so years. According to mainstream climate science, increasing levels of atmospheric carbon dioxide would drive the melt. But what would drive the increase?

A long-range weather forecaster who relies on a knowledge of solar and lunar cycles, rather than computer models, is Kevin Long. He claims that when there is more sea ice at the Antarctic there is generally below-average rainfall and heavier late season frosts in central Victoria.[2]

In an explanation of the origins of our understanding of the Southern Oscillation, which the mainstream climate science community believes has a major affect on rainfall over eastern Australia, Donald R. Mock from the US National Oceanic and Atmospheric Administration (NOAA) suggests early researchers dismissed any direct influence of solar activity on the phases of the Southern Oscillation, but took an interest in the possibility of a connection with the polar circulation particularly the extent of sea ice at the Antarctic [4]. Nowhere in this explanation, however, is an extraterrestrial link, whether lunar, solar or planetary, offered.

A fellow I know who takes an interest in solar-terrestrial physics because his business of installing radio and television antennae depends on it, claims a relationship between the global sea ice anomaly and lunar cycles. In particular, Siliggy claims that the global sea ice anomaly goes up when the moon is new at apogee and down when the moon is full at apogee.[3] On January 1 and January 30, 2014 there was synchrony between perigee and the new moon.[3]. I can’t see a period when there is synchronoy between new or full moons at apogee until March 5, 2015, when the moon will be full at apogee.[3]

****
[1] Ole Humlum Climate4You update for January 2014 http://www.climate4you.com/Text/Climate4you_January_2014.pdf
[2] Kevin Long summer forecast http://thelongview.com.au/documents/FORECAST-2014-No1-SUMMER-Kevin-Long.pdf
[3] The moon orbits the earth in an ellipse, not a circle, and so there are period when it is closer (perigee) and further away (apogee) in each one-month cycle. Also during this cycle there are periods when the moon is the same side of the earth as the sun (new moon) and on the opposite side of the earth to the sun (full moon). For new and full moon phases and perigees and apogees for 2014 see Lunar perigee and apogee calculator at https://www.fourmilab.ch/earthview/pacalc.html
[4] The Southern Oscillation: Historical Origins by Donald R. Mock, written 1981. http://www.esrl.noaa.gov/psd/enso/misc/hxsoi.html

Filed Under: Information Tagged With: Climate & Climate Change, Rainfall forecasting

  • « Go to Previous Page
  • Go to page 1
  • Interim pages omitted …
  • Go to page 41
  • Go to page 42
  • Go to page 43
  • Go to page 44
  • Go to page 45
  • Interim pages omitted …
  • Go to page 445
  • Go to Next Page »

Primary Sidebar

Recent Comments

  • Ian Thomson on Vax-ed as Sick as Unvax-ed, Amongst My Friends
  • Dave Ross on Vax-ed as Sick as Unvax-ed, Amongst My Friends
  • Dave Ross on Vax-ed as Sick as Unvax-ed, Amongst My Friends
  • Alex on Incarceration Nation: Frightened of Ivermectin, and Dihydrogen monoxide
  • Wilhelm Grimm III on Incarceration Nation: Frightened of Ivermectin, and Dihydrogen monoxide

Subscribe For News Updates

  • This field is for validation purposes and should be left unchanged.

November 2025
M T W T F S S
 12
3456789
10111213141516
17181920212223
24252627282930
« Jan    

Archives

Footer

About Me

Jennifer Marohasy Jennifer Marohasy BSc PhD has worked in industry and government. She is currently researching a novel technique for long-range weather forecasting funded by the B. Macfie Family Foundation. Read more

Subscribe For News Updates

Subscribe Me

Contact Me

To get in touch with Jennifer call 0418873222 or international call +61418873222.

Email: jennifermarohasy at gmail.com

Connect With Me

  • Facebook
  • LinkedIn
  • RSS
  • Twitter
  • YouTube

Copyright © 2014 - 2018 Jennifer Marohasy. All rights reserved. | Legal

Website by 46digital