
Anyone who doesn’t take truth seriously in small matters cannot be trusted in large ones either. Albert Einstein.
THE Australian Bureau of Meteorology extrapolates from the particular to the general in the development of their annual climate statements, but with a complete lack of fidelity to the original recorded temperature values at many locations. Indeed scrutiny of their methodology shows that the annual average temperature for Australia is a totally contrived value achieved through the rewriting of history at iconic locations including Bourke in north western New South Wales.
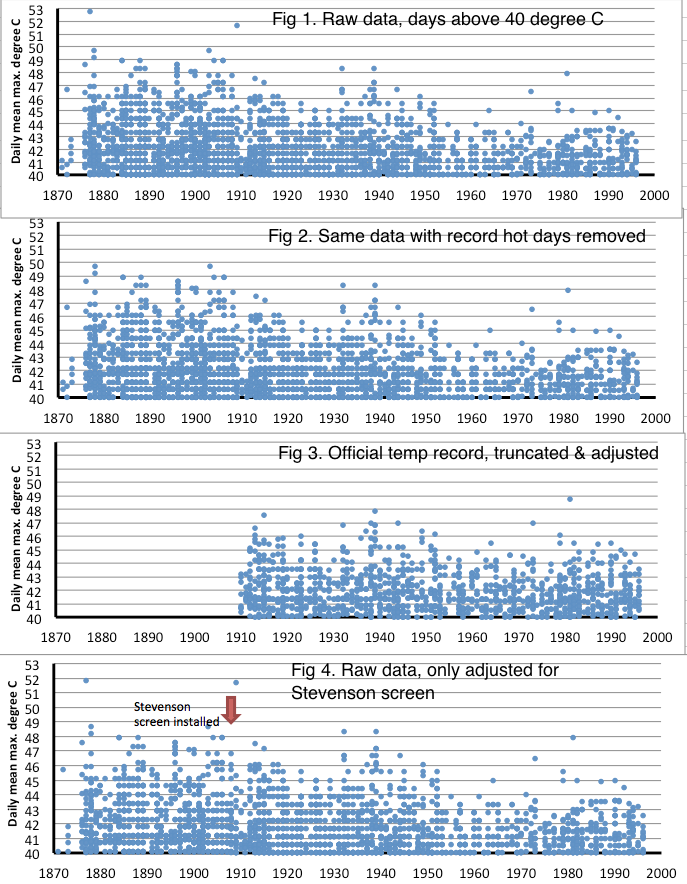
The Bureau’s claim that last year, 2013, was the hottest on record is based on the compilation of data from over 100 individual weather stations, including the station of Bourke, but only back to 1910 and with this data significantly truncated and adjusted.
Bourke has an exceptionally long temperature record, with recordings made at the post office from 1871 until 1996. Then the weather station was moved to the airport.
In part 1 of this series, I explain how individual hot days recorded by the Bourke postmaster have been expunged from the official temperature record and how the data series is significantly truncated. Now let’s consider how adjustments are made to the remaining mean maximum temperature series so that a cooling trend, Chart 1, becomes a warming trend, Chart 2.
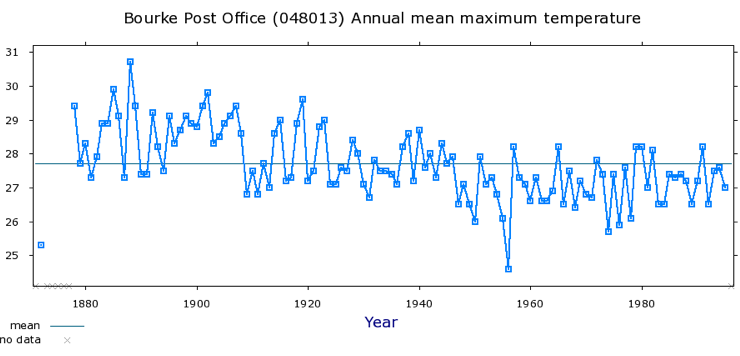
Chart 1. Mean annual maximum temperature for Bourke post office (1871 to 1996) based on unadjusted digitised data, minus the record hot days. Click on the chart for a larger better view. Find more information and a link to this chart at the Bureau’s website by clicking here.
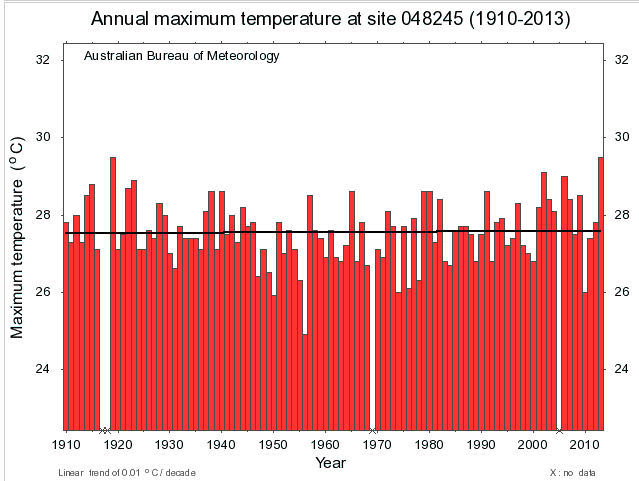
Chart 2. The official mean annual maximum ACORN-SAT temperature data for Bourke including more recent temperature data recorded at the airport, but excluding data collected at the post office before 1910. There is more information, and a link to this chart at the Bureau’s website here.
The change from a cooling trend to a warming trend of 0.01 degree Celsius per decade is achieve in part through the following three modification to the original data:
1. Two dramatic adjustments to the original temperatures record: an adjustment down between 1911 and 1915 and an adjustment up between 1951 and 1953.

Chart 3. Difference between annual mean maximum temperature for ACORN-SAT series minus the original digitised data for Bourke post office 1910-1996. Data compiled and chart drawn by Ken Stewart.
It is reasonable to adjust temperature data to correct for discontinuities caused by changes in site location and exposure. But from August 1908 through until 1996 the Bourke post office did not move and the temperature thermometers continued to be housed in a first class Stevenson screen. It is also reasonable to consider changes in observation time, and changes to metric measurements, even the introduction of automatic weather stations. But none of these potential reasons for adjusting a temperature data series can be used to explain the dramatic adjustments between 1911 and 1915 and 1951 to 1953 to the Bourke post office temperature data, Chart 3.
Rather a perfectly good data series appears to have been butchered to achieve a particular political end.
2. Substituting values recorded at the Bourke Post Office with values from other weather stations.
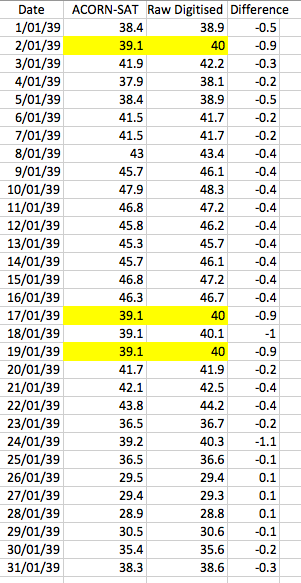
Table 1. Recorded maximum daily temperatures at Bourke versus ACORN-SAT maximum daily temperatures at Bourke for January 1939
In a report entitled ‘Techniques involved in developing the Australian Climate Observation Reference Network – Surface Air Temperature (ACORN-SAT) dataset’ (CAWCR Technical Report No. 049), Blair Trewin explains that up to 40 neighbouring weather stations can be used for detecting inhomogeneities and up to 10 can be used for adjustments. What this means is that temperatures, ever so diligently recorded in the olden days at Bourke by the postmaster, can be change on the basis that it wasn’t so hot at a nearby station that may in fact be many hundreds of kilometres away, even in a different climate zone.
Consider the recorded versus adjusted values for January 1939, Table 1. The recorded values have been changed. And every time the postmaster recorded 40 degrees, Dr Trewin has seen fit to change this value to 39.1 degree Celsius. Why?
In the original data the number of consecutive hot days over 40 degree Celsius is 17, Table 1. In January 1896 there were 22 consecutive days over 40 degrees Celsius. But neither of these two series of hot days exist in the current official Bureau record for Bourke because of the all truncating and adjusting.
Ian George, a regular contributor at this blog, has done a comparison of temperatures at Bourke with temperatures at the ‘nearby’ stations of Cobar, Tibooburra and Walgett to see how ‘nearby’ stations could influence Bourke’s temperature for January 1939. These are all ACORN-SAT stations. Ian George noted that after looking at the long-term average maxima for January, Bourke has the highest at 36.3 degree C. After checking the original temperature maxima Bourke had the highest for January 1939 at 40.4 degree C. After then checking the ACORN-SAT temperature for the same period, however, Bourke dropped to fourth place. Why?
3. Truncating the data by discarding the full 39 years of data from 1871 to 1910.
The postmaster at Bourke started recording temperatures on 25th April 1871, but the first 39 years of data is discarded on the basis the thermometers were not housed in a standard Stevenson screen. The early thermometers may have been housed in a non-standard Stevenson screen or at worst at Glaisher stand that can record temperatures up to 1 degree Celsius warmer in summer and 0.2 degree Celsius warmer in winter.
There are many peer-reviewed publications that show how to adjust temperature data based on the shelter used to house the thermometers.
A standard Stevenson screen was installed at Bourke in August 1908. Rather than adjusting the data before this month in the development of the ACORN-SAT official data series the Bureau has chosen to discard the earlier full 39 years of data. And then proceeds to adjust the data after the installation of the Stevenson screen.
To read more on this topic…
Part 1, Hot days
Part 3, Shortening an already shortened record
******
This blog post draws on comments in earlier threads from Ian George and Bob Fernley-Jones and email correspondence with Lance Pidgeon and Ken Stewart.
In future posts in this series I intend to show how adjustments have been made to the minima and how the official adjusted data is incorporated into global temperature databases.
 Jennifer Marohasy BSc PhD has worked in industry and government. She is currently researching a novel technique for long-range weather forecasting funded by the B. Macfie Family Foundation.