• Skip to primary navigation
  • Skip to main content
  • Skip to primary sidebar
  • Skip to footer
Jennifer Marohasy

Jennifer Marohasy

a forum for the discussion of issues concerning the natural environment

  • Home
  • About
  • Publications
  • Speaker
  • Blog
  • Temperatures
  • Coral Reefs
  • Contact
  • Subscribe

jennifer

Newspapers as the guardians of hot history

September 10, 2014 By jennifer

OLD newspapers hold a lot of information, some of it very valuable. I’m not only referring to last week’s The Land, but clippings that date back to editions published one hundred or more years ago.

Last week's The Land
Last week’s The Land

For example, in the Sydney Morning Herald on Tuesday 5th January 1909 it was reported that Bourke was experiencing a heat wave with temperatures ranging between 103 and 125 degree Fahrenheit (39 to 51.7 degree Celsius). It’s perhaps the hottest temperature ever recorded anywhere in Australia.

The recording of 125 degree Fahrenheit on 3rd January 1909 was taken from a new Stevenson screen installed in the yard at the Bourke post office in August 1908.

According to the Bureau of Meteorology there are no reliable records before 1910 because there were few Stevenson screens.

Well maybe just one in Bourke?

No.

Again, if you check the old newspapers, well, according to the Rockhampton Morning Bulletin on Saturday 28th September 1889 government meteorologist Clement Wragge was fitting a Stevenson screen at the telegraphic office before travelling on to Boulia and Cloncurry in western Queensland to do the same.

How pesky are these written reports when the Bureau would have us believe there is no such thing as a reliable temperature record before 1910.

It is interesting that the record hot day in Bourke on 3rd January 1909 was also written into the Meteorological Observation book that was kept in the Bourke post office back then, and can now be found in the national archive at Chester Hill in western Sydney.

I went and checked not only the old newspapers but also the book in the national archive, because, guess what? The Bureau of Meteorology is claiming it was all a clerical error. They have scratched this record made on 3rd January 1909 from the official record for Bourke, which means it’s also scratched from the NSW and national temperature record.

Yep. It never happened. No heatwave back in 1909.

They have also wiped the heatwave of January 1896. This was probably the hottest January on record, not just for Bourke, but Australia-wide. Yet according to the rules dictated by the Bureau, if it was recorded before 1910, it doesn’t count.

In ignoring the old records the Bureau is denying the Australian public valuable information. Its dangerous and its irresponsible.

We need to know both how hot and also how dry it was in the past if we are to adequately prepare for the future, whether or not the theory of anthropogenic global warming is ever proven.

So rather than working to make the data fit the theory, the Bureau should focus on keeping an accurate record.

This could start with them reinstating that record hot day in Bourke on 3rd January 1909. After all if it was published in the press, and in the official book at the Bourke post office it must be true. Not to mention that it was also very hot in Brewarrina that day, a warm 123 degree Fahrenheit according to the old newspapers.

*****
This article was first published in last week’s The Land newspaper.

Filed Under: Information Tagged With: Temperatures

Open Thread

September 5, 2014 By jennifer

Some things worth remembering …
We are persuaded not by truth, but by fidelity to evidence and context.
It is important to understand the difference between propaganda and information.
Objectivity is a research method, not a philosophy.

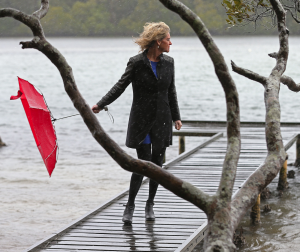
Photograph by Lyndon Mechielson

Filed Under: Information, News, Opinion

Go Boldly and Smash all Preconceptions: Steve Goddard

September 4, 2014 By jennifer

WE all have heroes. British biologist Thomas Henry Huxley (1825-1895) is one of mine. The contemporary of Charles Darwin wrote: “Sit down before facts as a little child, be prepared to give up every conceived notion, follow humbly wherever and whatever abysses nature leads, or you will learn nothing.”

I have done this for many temperature series: especially maximum temperature series and for many different localities around Australia, even the Bathurst jail because it has an exceptionally long record beginning in 1857. I have also trawled through some archives boxes, and wished I had time to examine more.

I have slowly developed a picture in my mind of what an amalgamation of all the records might look like. I like to develop my ideas slowly and from the bottom-up. I like detail and am often convinced, until I double check again, that I might have got something wrong.

Then along comes well-known American cyclist, blogger, geologist and electrical engineer, oh and also sceptic, Steve Goddard aka Tony Heller. He announced on Twitter a couple of days ago: I am bored with US temperatures, and have turned my attention to climate fraud in Oz.

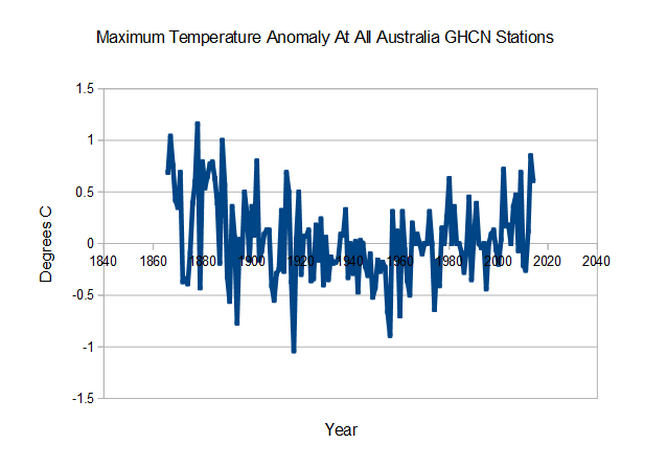
He starts with a few odd charts at his Twitter feed. I provided some feed back and then he posts ‘Australian Afternoons Used to Be Much Hotter’. The title and the chart excited me like only an entomologist can get excited when someone has suddenly completed the collection for them.

The chart is as I imaged the maximum temperature trends for, at least eastern Australia, would look like after all my station data was amalgamated. Steve’s methodology is very straightforward: There are 1,655 Australian stations in the GHCN (Global Historical Climatology Network) database that include temperature data. The database is located here: ftp://ftp.ncdc.noaa.gov/pub/data/ghcn/daily/all/. The station list is at bottom. The database includes maximum temperatures. He averages the daily data for each month at each station over the lifespan of the station to generate a monthly mean, and then calculates anomalies from the monthly mean. The numbers in his charts are the average anomaly across all stations for all records during a year.

Screen Shot 2014-09-04 at 9.40.01 PM

What Steve’s chart shows is that it was much hotter in the late 1800s, than at any time since and by a significant margin. He has suggested that 1878 is the hottest year on record. Coincidentally my scrutiny of data from the Bathurst jail weather station had already turned-up the hottest day in that record as being January 12, 1878.

There is a cooling trend to about 1960, and then temperatures start to warm again. But they never reach the highs of the late 1800s and early 20th Century.

Ten years ago, when I started this blog, my daughter wanted to be the first to leave a comment and she wrote: “Do not go where the path may lead, go instead where there is no path, and leave a trail.” Ralph Waldo Emerson.

Steve Goddard has just done this with the Australian temperature record. He has gone where no-one has dared go before. Thank you, Steve.

Filed Under: Information, Opinion Tagged With: Temperatures

Rutherglen: Still Looking for Answers

September 3, 2014 By jennifer

A CENTRAL thesis of global warming is that temperatures will keep going up, and up. They did from about 1960 to 2002 at many places around Australia, but not at all of them. At Ruthergen, a wine-growing region of north-eastern Victoria, temperatures have been fairly steady since a Stevenson screen was erected and temperatures first recorded back in November 1912.

Dr Bill Johnston asks other climate scientists to consider the evidence for Rutherglen

The Bureau of Meteorology includes Rutherglen in a network of stations that it uses to report on regional and national temperatures. But it doesn’t report on the temperature values as recorded at Rutherglen. It first remodels them. Through this process the mean annual minium temperature trend is changed from cooling of 0.35 degree celsius per century to warming of 1.73 degree celsius per century. That’s a pretty large change in both magnitude and direction.

Since this was first reported in The Australian by Graham Lloyd there have been accusations that people like myself are into conspiracy theories, and more. But we really would just like some answers.

No one is more curious than Bill Johnston. He is disappointed that Andy Pitman and other Australian climate experts seem to be avoiding discussion of the temperature data for Rutherglen. Out of curiosity, and also in an attempt to generate some scientific interest amongst his collegues, Dr Johnston has undertaken the following analysis. It’s a bit technical. But hopefully not too technical for the experts.

Rutherglen – A brief overview by Bill Johnston

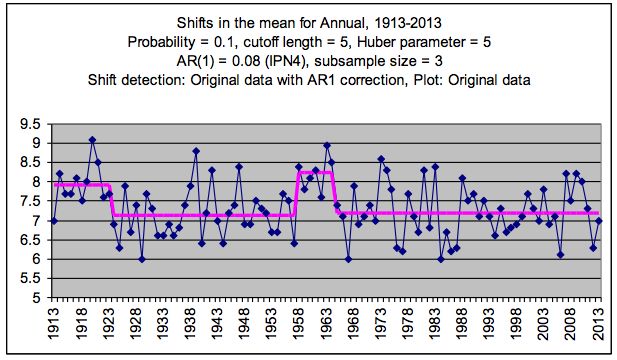
I examined the data graphically using a CuSum curve (cumulated deviations from the grand mean). There were 4 turning points, in 1923, 1957, 1964 and 1975. Two of those could have been independently-documented climate shifts (~1923 and ~1975).

I analysed the annual minimum temperature data, down-loaded from BoM using shift-detection software (CPA from variation.com) and sequential t-tests (STARS) (see: http://www.beringclimate.noaa.gov/regimes/rodionov_var.pdf) allowing for autocorrelation; and assuming all data were in-range (Huber’s H = 5).

Rutherglen Bill

CPA, which is based on bootstrapping, is not so good, when there are numerous changepoints. However, it detected shifts in 1924 and 1937 (P = 99% and 82% respectively). I did not follow-through fine-tuning the methodology, as I’d normally do to ensure no additional steps.

STARS detected regime changes in 1924 (P = 0.0007), 1958 (P = 6.07E-06) and 1965 P = 3.85E-06). This was inconsistent with the published metadata. The ACORN catalogue mentions no station moves. The steps were not documented climate-change years.

STARS settings are indicated on the graphic, so anyone can obtain the STARS Excel add-in, and data and re-do the analysis and check my interpretation. (Years indicated are start-years for the new regime.)

Of the step-changes, the 1965 shift was the most influential. Ignoring the intervening ‘hump’ the difference in mean level between 1957 and 1965 was 0.06 degree C.

Because it occurs in the middle of the dataset, such a step change could be trend-determining. If the hump alone was deducted, by shifting the data down by the difference, the 1965 shift may not be detectable. Trend however, would be little altered, and would still be no different to zero-trend.
The hump could have been a data-fill; a temporary move or a change in screen-aspect or instruments; but that is all a guess.

The shift down in 1924 of 0.77 degree C is consistent with a possible station move. However, based on Metadata, no such move happened, which was the point made by Jennifer Marohasy, which in-turn was based on the best information available from the BoM ACORN catalogue.

If we go back to BoM’s climate data on line, there was a post office record (082038; 1903-1925) as well as a viticulture research record (082085; 1903-1927). I’ve not compared these, but at an annual scale, they should behave in parallel (same trend, different intercepts).

(A graphical way of checking is to difference the datasets, and cumulatively sum the result, to see if the CuSum of the difference goes ‘off-line”. (Add a to b, then the answer, to c and so on – it takes 2 calculation columns, one for the difference, the other for the CuSum, and data needs to be closed-up on missing pairs). I think visual comparisons; using line-graphs are difficult to interpret. (Also some people have trouble with discerning colours.) Comparing regression lines may also introduce the possibility of spurious trends in either or both of the datasets being compared.

It so happens that in my research collaboration days, our team met time-about in the historic and interesting viticulture laboratory, which became a meeting room within the Rutherglen Research complex.
It seems likely that, in order to produce the long ACORN record; between 1924 and 1927, the viticulture record was merged with the Rutherglen Research record, and that BoM ignored or did not detect that particular stitch.

It could also have been an inadvertent error; the sort of thing that happens when someplace morphs into something else. (It could have been done locally for example.) (I don’t know when Rutherglen became an agricultural research centre.)

Irrespective of all the argy-bargy, the important points are:

1. The truth is in the data, not necessarily the metadata.

2. Without leaving Excel, small (less than 1 degree C) enduring shifts in the mean level of a data-stream, typical of undocumented changes, can be detected. However, for any time-series iterative testing using contrasting tests, and interpretive skill is required (at the 95% level there is a 5% chance of NOT detecting a shift that is real).

3. Most importantly, in the case of Rutherglen (and Deniliquin; RAAF Amberley; Longreach; Nobbys Head, Moruya PS and elsewhere) when abrupt-shifts are allowed for (deducted sign-intact), it is often the case residual trends are not different to zero-trend. (It can also be the case that the data are useless; Eucla may be in that category!)

In other words, for many places, naïve mean-squares trends may be spurious. They are due to shifts either in the measurements or in the climate.

In Rutherglen’s case, trend between 1924 and 1957 (34 years), and between 1958 and 2013 (49 years) were no different to (bootstrapped) zero trend (P <0.05). (Least squares trends were 0.007 and –0.003 oC/yr.) This further supports the view that we have a non-trending data stream, containing a small step. According to CPA and STARS there were no significant (P <0.05) changes in variability. With all step-changes removed, there was no trend. There are four important lessons. 1. Graphical and statistical evaluation on a site-by-site basis is essential before any inter-station comparisons, or inter-station homogenizations are undertaken. This is formally called exploratory data analysis (EDA). My endless analysis of data leads me to conclude that many series are not fit-for-purpose; or that it is simply not possible to detect valid trends against background noise. (Valid trends are trends ex-steps. For least-squares regression to be valid, data MUST be homogeneous.) 2. There can be changes within data that are undocumented (like Rutherglen and Amberley); likewise there can be documented changes that don’t result in data inhomogeneties (Eucla possibly being a case in point). 3. It is inappropriate for the Bureau having made a mistake in respect of supporting comments made by Professor David Karoly, who has a long history of being biased; to pull in heavy artillery from another, potentially equally-biased UNSW group, in an attempt to reclaim the high-ground. 4. There is an answer. I’ve put forward a transparent approach. Having said that I’m quite willing to be proved wrong at the statistical confidence level of P =0.05. The situation has become a bit absurd.

The Bureau needs to show unambiguously ‘true’ or ‘real’ uncontestable positive trends in minimum temperature data that don’t rely on their homogenisation procedures.

It is really that simple.

If BoM cannot do that, they have lost the statistical debate and need to fess-up or develop yet another trend-setting dataset.

Cheers,
Dr Bill Johnston
Former NSW Natural Resources Research Scientist

Note that I am a data analyst, not an expert mathematical statistician. I would not be regarded as an expert in the sense of arguing a statistical case with BoM, for example. That does not invalidate my analysis; it is simply a disclaimer. And if you want disclaimers, look no further than most BoM reports.

Filed Under: Information Tagged With: Temperatures

Open Thread

September 3, 2014 By jennifer

IF there is someone you know who may be interested in doing a masters or PhD in weather and/or climate forecasting, applications are still open. They need to be interested in numbers and ideas, be a science and/or engineering graduate, resident and/or citizen of Australia and/or New Zealand and want to live and study on the Sunshine Coast, Queensland. More details at the CQ University website here.

John and Caroline in Noosa National Park.

Filed Under: Good Causes

So much Conversation, so little evidence

September 2, 2014 By jennifer

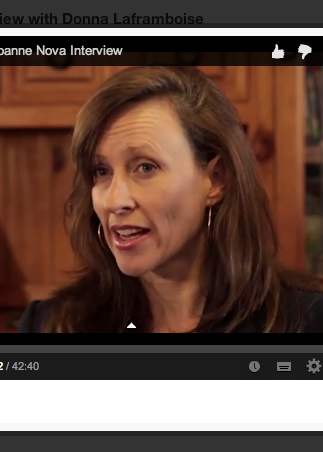
I’VE never meet Jo Nova in person. But she can write a good headline, and she cares about the truth. Her blog has never received any government funding, but it includes a lot of interesting facts and evidence on science-related topics.

Jo Nova in conversation.  But not at the public's expense.
Jo Nova in conversation. But not at the public’s expense.

Meanwhile ‘The Conversation’ is a government-funded blog for university researchers that got $6 million dollars just a couple of years ago to employee staff to spout opinion.

Yesterday The Conversation was, as always, short on evidence, but its government-funded scribes could vouch for the Bureau of Meteorology. In particular, Andy Pitman and Lisa Alexander, both part of the global warming industry, authored a long piece about how you should trust them and the Bureau. But the discerning reader might be left wondering why?

Because, as Jo Nova explains at her blog today, they didn’t actually explain how and why it was necessary to change a cooling trend at Rutherglen into a warming trend.

Meanwhile, I’ve been reading a peer-reviewed paper by Blair Trewin, which details how the homogenisation technique employed by the Bureau is meant to work. The only problem is, the methodology as detailed in this paper published in the International Journal of Climatology (Volume 33, Pages 1510-1529) doesn’t actually seem to accord with the methodology as implemented by Dr Trewin at the Bureau of Meteorology. What I mean is, the peer-reviewed paper says one thing, but the output from the homogenisation technique shown in the ACORN-SAT reconstructions suggests something entirely different.

Something that is worth noting in the paper, is comment from Dr Trewin that, “but negative adjustments are somewhat more numerous for minimum temperatures, which is likely to result in ACORN-SAT minimum temperatures showing a stronger warming trend than the raw data do.” What he is saying, in plain English, is that ACORN-SAT may exaggerate the warming trend somewhat as a consequence of artificially dropping down the minimum temperatures. In fact, as I explained with reference to the Rutherglen temperature trends, the Bureau progressively drops down the minimum values from 1973 back through to 1913. For the year 1913 the difference between the raw temperature and the ACORN-SAT temperature is a massive 1.8 degree C.

The apologists, Pitman and Alexander, in their conversation suggest that, “the warming trend across Australia looks bigger when you don’t homogenise the data than when you do”. But this is not what the peer-reviewed literature says. And yet the take home message from their article is believe only this same peer-reviewed literature.

****
More on Rutherglen, Pitman and Alexander in today’s The Australian.

Filed Under: Information, Opinion Tagged With: Temperatures

  • « Go to Previous Page
  • Go to page 1
  • Interim pages omitted …
  • Go to page 31
  • Go to page 32
  • Go to page 33
  • Go to page 34
  • Go to page 35
  • Interim pages omitted …
  • Go to page 445
  • Go to Next Page »

Primary Sidebar

Recent Comments

  • Ian Thomson on Vax-ed as Sick as Unvax-ed, Amongst My Friends
  • Dave Ross on Vax-ed as Sick as Unvax-ed, Amongst My Friends
  • Dave Ross on Vax-ed as Sick as Unvax-ed, Amongst My Friends
  • Alex on Incarceration Nation: Frightened of Ivermectin, and Dihydrogen monoxide
  • Wilhelm Grimm III on Incarceration Nation: Frightened of Ivermectin, and Dihydrogen monoxide

Subscribe For News Updates

  • This field is for validation purposes and should be left unchanged.

November 2025
M T W T F S S
 12
3456789
10111213141516
17181920212223
24252627282930
« Jan    

Archives

Footer

About Me

Jennifer Marohasy Jennifer Marohasy BSc PhD has worked in industry and government. She is currently researching a novel technique for long-range weather forecasting funded by the B. Macfie Family Foundation. Read more

Subscribe For News Updates

Subscribe Me

Contact Me

To get in touch with Jennifer call 0418873222 or international call +61418873222.

Email: jennifermarohasy at gmail.com

Connect With Me

  • Facebook
  • LinkedIn
  • RSS
  • Twitter
  • YouTube

Copyright © 2014 - 2018 Jennifer Marohasy. All rights reserved. | Legal

Website by 46digital