• Skip to primary navigation
  • Skip to main content
  • Skip to primary sidebar
  • Skip to footer
Jennifer Marohasy

Jennifer Marohasy

a forum for the discussion of issues concerning the natural environment

  • Home
  • About
  • Publications
  • Speaker
  • Blog
  • Temperatures
  • Coral Reefs
  • Contact
  • Subscribe

jennifer

Bob Carter Warms with Eiffel Tower Descent

November 29, 2015 By jennifer

THE Eiffel Tower was opened in 1889, and with an observation deck at about 300 m above ground level was then the highest human-construction on planet Earth.

Professor Bob Carter, former Head of the Department of Earth Sciences at James Cook University, now in Paris in advance of the COP-21 global warming talks, recently emailed me after descending the Tower:

“How many of the estimated other 39,999 persons attending the COP-21 talks in Paris will be aware that that when they descend from the Eiffel observation deck to the ground they will experience a warming of about 1.8 degree Celsius?”

“This is about twice the claimed global surface warming since the industrial revolution, based on thermometer measurements, yet very few tourists are observed to be shedding clothing against the increased heat as they dismount the tower at ground level.”

“It is this type of perspective and context that is so missing from the down-the-rabbit-hole nature of the climate political discussions, and related chicanery, that have preceded the COP-21 meeting,” wrote Bob.  EiffelTower2

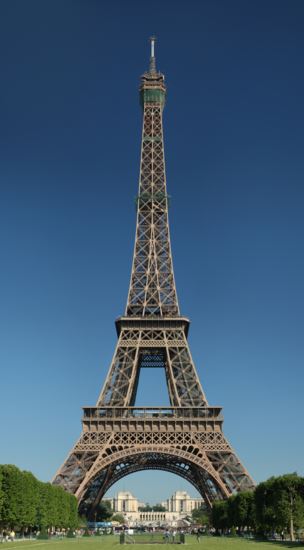
Bob also sent me the program for the alternative conference in Paris:

The International Climate Science Coalition (ICSC) and its partners in the United Kingdom invite reporters, policy makers, and other interested parties to attend the Paris Climate Challenge (PCC) conference. It will be held at Espace La Rochefoucauld conference centre, 11 Rue La Rocheforcauld, Paris, from December 1 – 3, 2015.

The schedule of events may be seen at: http://pcc15.org/about/.

Tom Harris, ICSC executive director said, “In 2009 we presented the Copenhagen Climate Challenge which asked the United Nations to publicly substantiate each of ten fundamental assertions that underlie current climate concerns.”

“Endorsed by 161 science and technology experts well qualified in climate science, the challenge was presented as an open letter submitted to UN Secretary General Ban Ki-moon and reported on by prominent media across the world,” explained Harris.

Most significant among the challenges was for proponents of dangerous anthropogenic climate change theory to substantiate claims that:

1. Recent climate change is unusual in comparison with historical records;
2. Human emissions of carbon dioxide and other ‘greenhouse gases’ are dangerously impacting climate;
3. Computer-based models are reliable indicators of future climate.

Harris reports, “Mr. Ban never responded or even acknowledged the scientists’ open letter.”
PCC lead coordinator, the Reverend Philip Foster said, “We are back this year to ask the same and more questions, and challenge the climate ‘consensus’ in Paris at COP 21 with alternative, more realistic climate hypotheses.”

For further information, contact:
Tom Harris, B. Eng., M. Eng. (Mech. – thermofluids)
Executive Director, International Climate Science Coalition
Email: tom.harris@climatescienceinternational.net
** Phone (North America): 613-728-9200. From Europe: 001-613-728-9200, or from a mobile phone +-1-613-728-9200.

RELATED LINKS
www.climatescienceinternational.org

***
More information on how to calculate temperature gradients in the atmosphere here:
https://en.wikipedia.org/wiki/International_Standard_Atmosphere

Filed Under: Information Tagged With: Bob Carter, Temperatures

Will the Senate Select Committee Care About the Fish, or the Estuary?

November 18, 2015 By jennifer

I will be in Goolwa, just to the north west of the Murray River’s sea mouth, on Tuesday 8th December to give evidence to the Senate Select Committee on the Murray Darling Basin Plan.

Map-MDB-circleGOOLWA

This committee is chaired by David Leyonhjelm, the libertarian senator from NSW, and has a mandate to report on both the positive and negative aspects of the new Basin Plan by 26th February 2016.

The Basin Plan, a requirement under the Water Act 2007, has resulted in the redistribution of vast quantities of fresh water previously used to grow food upstream in places like the Riverina, ostensibly to the Coorong, Lower Lakes and Murray Mouth.

Much of the campaigning for water reform, led by the Australian Conservation Foundation, has specifically and falsely claimed that this water is needed to flush the Murray’s mouth. Never mind that river flow must first make it across a vast shallow lake and through a series of barrages before it can get to the mouth.

If the barrages were removed, the tides of the Southern Ocean could score the Murray’s sea mouth each autumn at no cost to Australian tax payers.

The barrages are massive sea dykes built in the 1930s to prevent inflows from the South Ocean, and are often closed to ensure the Lower Lakes are kept above sea level. The entire Lower Lakes environment is artificial, something resembling a duck pond the size of Port Phillip Bay, where Adelaide’s elite like to go sailing on the weekend.

We really are a rich nation that we can divert water once used to grow food, to this contrived oasis in the driest state on the driest continent. It is of course a lie that this water is for the environment. It has been taken from agriculture, but it is not sustaining a natural system.

My submission to the Senate Committee includes some discussion of the need to restore the estuary, but it is more generally focused on fish. I explain that despite tens of millions of dollars spent on a native fish strategy, many species show no signs of recovery to preEuropean levels. This is because issues of cold water pollution, predation from introduced salmonids, and also restoration of the estuary, have not been addressed.

This submission, on behalf of The Myth and the Murray Group, can be accessed here:
https://jennifermarohasy.com.dev.internet-thinking.com.au/wp-content/uploads/2011/08/JenniferMarohasy-Think-About-The-Fish.pdf

Filed Under: Information, News Tagged With: Murray River

Sceptics and Alarmists, Together, Present to Coalition Environment Committee

October 23, 2015 By jennifer

ON Tuesday there was a Parliamentary Information Session in Canberra sponsored by the Global Change Institute and the University of Queensland at which many government-funded climate scientists told members and senators that the end is nigh. That is unless Australia signs on to the United Nations Sustainable Development Goals at the upcoming COP21 in Paris.

The night before the debate, on Monday, three of the alarmists (Ove Hoegh-Guldberg, John Church and Mark Howden), Bob Carter and I were invited to present information to the Coalition Environment Committee, where Craig Kelly MP facilitated some lively discussion.

It is significant that such a meeting was actually held in Parliament House at which both government-funded alarmists and credentialed independent sceptics were present; this is almost a world first and certainly an Australian first.

I emphasized the importance of distinguishing between real historical data as opposed to naively believing output from computer models that homogenize original measurements. I forcefully criticized both Hoegh-Guldberg and Church for not telling the members and senators that they had presented remodeled data, as opposed to actual measurements in their presentations, which preceded mine.

My presentation* focused on surface temperature data from Rutherglen, and how the Bureau of Meteorology has remodeled the observational temperature series, showing sustained cooling over the 20th Century, to show an apparent dramatic warming trend. This is achieved by the Bureau dropping down past temperatures and promulgating this effect backwards. In particular, the Bureau subtracts 0.57°C from all temperature minima recorded before 1974, subtracts 0.63°C from all minima before 1966, and subtracts 0.49°C from all minima before 1928. The net change back to the beginning of the record in 1912 is thus 1.69°C. This is an extraordinarily significant distortion of the record.

At the meeting, I explained how Rutherglen is one of 104 weather stations used to construct the contrived official temperature trend for Australia, and that every single temperature time series was adjusted. In general, like at Rutherglen, the adjustments have the effect of cooling the past and thus making the present appear relatively hotter.

I mentioned that it was a travesty that Minister Greg Hunt had prevented a proper inquiry into the Bureau last year, and suggested that the senators and members in the room needed to ‘wake-up’ and do something. Public policy, I suggested, needed to be based on real data/real evidence, not contrived temperature series.

After my presentation, Professor Howden began with slides indicating that because of climate change there had been a decline in crop yields. He was interrupted by one of the MPs who asked whether the charts on display represented actual real historical data, or output from a computer model. The Professor acknowledged that he was showing computer output.

At that point, I really wanted to applaud when several of the MPs promptly got up and walked out.

After the presentations there was some discussion of the satellite data at the request of the committee chair, Craig Kelly MP. Luckily, I had a supplementary slide showing the last 17 years of data for Australia to September 2015, that I had downloaded the day before from Ken Stewart’s blog, https://kenskingdom.wordpress.com/2015/10/16/the-pause-september-update/

Latest UAH satellite data for Australia, via Ken Stewart

This data, which measures radiance in the lower troposphere clearly shows that there has been no global warming for 17 years. However, Professor Howden from the Climate Change Institute at the Australian National University, claimed that if measurements from different altitudes were combined this data showed global warming. Perhaps he meant that that even this data could be remodeled to show global warming.

Of course, it is possible to change the trend in any time series by making specific adjustments to individual values, then combining measurement in particular ways, with arbitrarily assigned weightings. These are indeed the techniques mainstream climate science apply to data, and then justify the same on the basis it is ‘World’s Best Practice’ because it shows global warming, and any data that does not is just wrong.

Ansley Kellow in his book ‘Science and Public Policy: The Virtuous Corruption of Virtual Environmental Science’ labels this preference for virtual data that tells the “correct” story, over real measurements, as a form of “noble cause corruption”.

At the meeting on Monday night Professor Carter stressed the need to pay attention to the scientific method, and in particular the importance of testing the null hypothesis. Meanwhile Ove Hoegh-Guldberg continually pointed to a thick tome which apparently represented the consensus of all IPCC scientists. Of course, this consensus is all about politics, not evidence or science.

You might consider sending a note of thanks to one or more the following members and senators for attending. Craig Kelly MP, in particular, should be congratulated for organizing the meeting, and facilitating the discussion.

1. Senator Eric Abetz, Liberal, TAS
2. Dr Peter Hendy MP, Liberal, NSW
3. Senator Zed Seselja, Liberal, ACT
4. Craig Kelly MP, Liberal, NSW
5. Warren Entsch, LNP, QLD
6. Dr Denis Jensen MP, Liberal, WA
7. Bert van Manen MP, LNP, QLD
8. Nola Marino MP, Liberal, WA
9. Andrew Broad, National, VIC
10. Tony Pasin, Liberal, SA
11. Brett Whitely, Liberal, SA
12. Rick Wilson, Liberal, WA
13. George Christensen, LNP, QLD
14. Eric Hutchison, Liberal, TAS
15. Sharman Stone, Liberal, VIC
16. Mark Coulton MP, National, NSW

There is more information, and a link to an interview that I did with Alan Jones, 2GB, at Jo Nova’s blog, http://joannenova.com.au/2015/10/alan-jones-talks-climate-paris-mainstream-scientists-caught-out-by-marohasy-in-parliament/

Also, Brett Hogan from the Institute of Public Affairs was the sixth speaker. He gave an interesting talk about coal, and how it is helping the poor in places like India and China out of poverty.

———————————-

* My presentation included several charts of data from Rutherglen, and the nearby location of Beechworth, these charts with explanatory notes can be downloaded here: Notes-EnvironCommittee-October2015-V4

Filed Under: Information Tagged With: Temperatures

You Don’t Know the Half of It: Temperature Adjustments and the Australian Bureau of Meteorology

September 28, 2015 By jennifer

For the true believer, it is too awful to even consider that the Australian Bureau of Meteorology could be exaggerating global warming by adjusting figures. This doesn’t mean though, that it’s not true.

Look carefully and you will see Pinocchio.

In fact, under Prime Minister Tony Abbott, a panel of eminent statisticians was formed to investigate these claims detailed in The Australian newspaper in August and September 2014. The panel did acknowledge in its first report that the Bureau homogenized the temperature data: that it adjusted figures. The same report also concluded that it was unclear whether these adjustments resulted in an overall increase or decrease in the warming trend. No conclusions could be drawn because the panel did not work through a single example of homogenization, not even for Rutherglen. Rutherglen is of course in north eastern Victoria, an agricultural research station with a continuous minimum temperature record unaffected by equipment changes or documented site-moves, but where the Bureau nevertheless adjusted the temperatures. This had the effect of turning a temperature time series without a statistically significant trend, into global warming of almost 2 degrees per Century.

According to media reports last week, a thorough investigation of the Bureau’s methodology was prevented because of intervention by Environment Minister Greg Hunt. He apparently argued in Cabinet that the credibility of the institution was paramount. That it is important the public have trust in the Bureau’s data and forecasts, so the public know to heed warning of bushfires and cyclones.

This is the type of plea repeatedly made by the Catholic Church hierarchy to prevent the truth about paedophilia, lest the congregation lose faith in the church.

Contrast this approach with that by poet and playwright Henrik Ibsen who went so far as to suggest ‘the minority is always right’ in an attempt to have his audience examine the realities of 18th Century morality. Specifically, Ibsen wanted us to consider that sometimes the individual who stands alone is making a valid point which is difficult to accept because every culture has its received wisdoms: those beliefs that cannot be questioned, until they are proven in time to have been wrong. British biologist, and contemporary of Charles Darwin, Thomas Huxley was trying to make a similar point when he wrote, “I am too much of a skeptic to deny the possibility of anything.”

Mr Hunt defends the Bureau because they have a critical role to play in providing the Australian community with reliable weather forecasts. This is indeed one of their core responsibilities. They would, however, be better able to perform this function, if they used proper techniques for quality control of temperature data, and the best available techniques for forecasting rainfall [1]. Of concern, there has been no improvement in their seasonal rainfall forecasts for two decades because they use general circulation models [2]. These are primarily tools for demonstrating global warming, with dubious, if any skill, at actually forecasting weather or climate.

Consider for example, the Millennium drought and the flooding rains that followed in 2010. Back in 2007, and 2008, David Jones, then and still the Manager of Climate Monitoring and Prediction at the Bureau of Meteorology, wrote that climate change was so rampant in Australia, “We don’t need meteorological data to see it” [3], and that the drought, caused by climate change, was a sign of the “hot and dry future” that we all collectively faced [4]. Then the drought broke, as usual in Australia, with flooding rains. But the Bureau was incapable of forecasting an exceptionally wet summer, because such an event was contrary to how senior management at the Bureau perceived our climate future. So, despite warning signs evident in sea surface temperature patterns across the Pacific through 2010, Brisbane’s Wivenhoe dam, a dam originally built for flood mitigation, was allowed to fill through the spring of 2010, and kept full in advance of the torrential rains in January 2011. The resulting catastrophic flooding of Brisbane is now recognized as a “dam release flood”, and the subject of a class action lawsuit by Brisbane residents against the Queensland government.

Indeed despite an increasing investment in super computers, there is ample evidence that ideology is trumping rational decision making at the Bureau on key issues that really matter, like the prediction of drought and flood cycles. Because a majority of journalists and politicians desperately want to believe that the Bureau knows best, they turn away from the truth, and ignore the facts.

News Ltd journalist Anthony Sharwood got it completely wrong in his weekend article defending the Bureau’s homogenization of the temperature record [5]. I tried to explain to him on the phone last Thursday, how the Bureau don’t actually do what they say when they homogenize temperature time series for places like Rutherglen. Mr Sharwood kept coming back to the issue of ‘motivations’. He kept asking me why on earth the Bureau would want to mislead the Australian public. I should have kept with the methodology, but I suggested he read what David Jones had to say in the Climategate emails. Instead of considering the content of the emails that I mentioned, however, Sharwood wrote in his article that, “Climategate was blown out of proportion”, and “independent investigations cleared the researchers of any form of wrongdoing”.

Nevertheless, the content of the Climategate emails includes quite a lot about homogenization, and the scientists’ motivations. For example, there is an email thread in which Phil Jones (University of East Anglia) and Tom Wigley (University of Adelaide) discuss the need to get rid of a blip in global temperatures around 1940-1944. Specifically Wigley suggested they reduce ocean temperatures by an arbitrary 0.15 degree Celsius. These are exactly the types of arbitrary adjustments made throughout the historical temperature record for Australia: adjustments made independently of any of the purported acceptable reasons for making adjustments, including site moves, and equipment changes.

Sharwood incorrectly wrote in his article that: “Most weather stations have moved to cooler areas (i.e. areas away from the urban hear island effect). So if scientists are trying to make the data reflect warmer temperatures, they’re even dumber than the sceptics think.” In fact, many (not most) weather stations have moved from post offices to airports, which have hotter, not cooler, day time temperatures. Furthermore, the urban heat island creeps into the official temperature record for Australia, not because of site moves, but because the temperature record at places like Cape Otway lighthouse is adjusted to make it similar to the record in built-up areas like Melbourne, which are clearly affected by the urban heat island [6].

I know this sounds absurd. It is absurd, and it is also true. Indeed, a core problem with the methodology that the Bureau uses is its reliance on “comparative sites” to make adjustments to data at other places. I detail the Cape Otway lighthouse example in a recent paper published in the journal Atmospheric Research, volume 166, page 145 [6].

It is so obvious that there is an urgent need for a proper, thorough and independent review of operations at the Bureau. But it would appear our politicians and many mainstream media are set against the idea. Evidently they are too conventional in their thinking to consider that such an important Australian institution could now be ruled by ideology.

This article was first published at On Line Opinion.  A shorter versions was subsequently published at The Australian, with the wonderful cartoon of Greg Hunt by Eric Lobbecke.

References/Links

1. Marohasy, J. 2014. Letter to Simon Birmingham, Re: Corruption of the official temperature record, and increasing unreliability of official seasonal rainfall forecasts.
https://jennifermarohasy.com.dev.internet-thinking.com.au/wp-content/uploads/2014/03/Birmingham_2014_08_12.pdf

2. Abbot, J. and Marohasy J. 2014. Input selection and optimisation for monthly rainfall forecasting in Queensland, Australia, using artificial neural networks. Atmospheric Research, 138, 166-178. http://www.sciencedirect.com/science/article/pii/S0169809513003141

3. Jones, D. 2007. Email to Phil Jones, Re: African stations used in HadCRU global data set. http://www.ecowho.com/foia.php

4. Jones, D. 2008. Our hot, dry future, The Sydney Morning Herald. http://www.smh.com.au/federal-politics/our-hot-dry-future-20081005-4udg.html

5. Sharwood, A. 2015. Why are they messing with the data? http://www.news.com.au/technology/environment/the-cyclone-tracy-of-ideological-battles-does-the-weather-bureau-tweak-data-or-is-our-government-paranoid/story-fnjwvztl-1227545670243?sv=a58a1574c4a196289acf208f11fc2d2b

6. Marohasy, J. and Abbot, J. 2015. Assessing the quality of eight different maximum temperature time series as inputs when using artificial neural networks to forecast monthly rainfall at Cape Otway, Australia. Atmospheric Research, 166, 141-149. http://www.sciencedirect.com/science/article/pii/S0169809515002124

Filed Under: Information Tagged With: Temperatures

Snowy Hydro responsible for cooling at Rutherglen?

September 14, 2015 By jennifer

I’VE just had a paper published in the international climate science journal Atmospheric Research (volume 166, pages 141-149), in which I show there was significant cooling in the maximum temperatures at the Cape Otway and Wilsons Promontory lighthouses, south eastern Australia, from 1921 to 1950.  This cooling is even more pronounced in temperature records from the Riverina, including at Rutherglen and Deniliquin.  Indeed, while temperatures at the lighthouses (and most Australian east coast locations) show cooling from about 1880 to about 1950, they then show quite dramatic warming from at least 1960 until about 2002.  In the Riverina, however, minimum temperatures continued to fall through the 1970s and 1980s.  Pondering this issue, it occurred to me that Snowy Hydro may be responsible.

This hydroelectricity and irrigation scheme was a major feat of engineering facilitating the ongoing diversion of about 1,000 gigalitres of water per year, which once flowed east to the Pacific, west to the Riverina.  Much of the land brought under irrigation is used to grow rice, with water pooled.  The cooling could thus be the direct result of evaporation which removes latent heat from the surface from which evaporation occurs.  This is the physical basis of industrial and domestic cooling systems, and also of sweating.

The main distribution channels are just to the west of Rutherglen, and resulted in 800,000 hectares of new land under irrigation, not just for rice but also pastures for dairy, and more.

The largest dip in the minimum temperature record for Deniliquin occurs just after the Snowy Hydro scheme came online.   Of course the Australian Bureau of Meteorology denies this cooling: everywhere must show global warming!  So their ACORN-SAT team jump down the minimum temperature record at Deniliquin by a massive 1.5 degree Celsius before 1971 in an attempt to mask the cooling.

If you want to better understand the level of incompetence at work in remodelling the Deniliquin temperature series, and also understand more about this temperature record, and the proximity of Rutherglen to the major water infrastructure developments, read my latest correspondence with the Bureau of Meteorology, which follows.


*******   14th September 2015

Dr Louise Minty
Acting Deputy Director, Environment and Research Division
Head Office Melbourne, Bureau of Meteorology
GPO Box 1289, Melbourne VIC 3001

Dear Dr Minty

Re:  The temperature time series for Deniliquin, and your letter contains basic errors of fact

Thank you for your letter of 3rd September, 2015, in response to my letter to Ms Middleton in which I  explained that the temperature record for Deniliquin shows statistically significant cooling, and drew attention to the chart in your key ‘fact sheet’ which confounds homogenized and raw temperature data.   While I appreciate you taking the time to write to me, there are basic factual errors in your letter

I note that you advise that that if I have ongoing concerns I should submit these to a reputable journal.  The detail of my analysis of both the maximum and minimum temperature time series for Deniliquin and Rutherglen will soon be publically available in the peer-reviewed scientific literature.  This contrasts with the publication history of the ‘adjustments’ for Deniliquin and Rutherglen by the Bureau which have not been published in any peer-review literature, and which do not accord with actual discontinuities in the individual raw temperature series.

You state in your letter that there is no continuous temperature record for Wilkinson Street Deniliquin which shows a cooling trend since 1910.  You suggest that I have confounded the Wilkinson Street record for Deniliquin with the record from the airport and Falkiner Memorial (the CSIRO facility).  If you read my letter you would see it clearly showed the three series, in green, mustard, and purple.  I will reproduce them again for you here as Figure 1:

Figure 1.

You suggest I made a concatenation of these records into a single temperature series. You are in error. I did not.

Clearly there is a long continuous record for Wilkinson Street and it shows cooling.

In your letter you state that adjustments had to be made to the Deniliquin record in order to combine the series from Wilkinson Street and the airport.  I did not combine these series in my correspondence to you, but the Bureau has combined them as part of the development of the Australian Climate Observation Network – Surface Temperatures (ACORN-SAT) dataset.

You suggest that adjustments were made for September 1984 to ‘merge’ the airport and Wilkinson Street series. You are incorrect. Your ACORN-SAT team made adjustments in July 1997 to account for the move to the airport, and also assigned the record a new site number.

Your adjustments involve dropping down all temperatures between January 1910 and June 1997 by -0.51 degree Celsius.   But this huge manipulation is not even the largest correction your team makes.  The largest ‘correction’ is made in 1971 dropping temperatures by 0.99 degrees. The cumulative effect is a cooling of all temperatures as recorded at Deniliquin before August 1971 by 1.5 degrees.  As I am sure you are aware, dropping all previous historical temperatures makes the present appear relatively hotter.  These changes alone manage to almost double the amount of global warming over the 20th Century, typically reported as 0.9 degree Celsius!

The only justification presented for the correction in your online note is: ‘site move’. The Bureau’s policy for dealing with significant site moves when they actually occur is to award a new site number. The Bureau did not do this.

You claim in your letter the site move caused a discontinuity in the data. But a check of the site code used when this same temperature series was homogenized by Simon Torok and Neville Nicolls* indicates that there was no discontinuity detected in 1971.

Furthermore, if the site move caused a discontinuity in the data then this would be evident in the numbers, specifically in the monthly values. But when the Wilkinson Street monthly minimum temperature series (1910 to 2002) is run through a simple control chart there is no exceedance of upper and lower control limits set at three standard deviations from the overall mean as shown in Figure 2.

Figure 2.  I-MR-R/S control chart showing minimum temperatures as recorded at Wilkinson Street, Deniliquin, between January 1910 and December 2002.  The subgroup mean (top chart) represents the mean for each year eliminating the within subgroup component of variation (i.e. the seasons), thus tracking process location (i.e. annual temperature change).  The moving range (MR) of the subgroup mean (middle chart) tracks between year variation.  The standard deviation (bottom chart) plots process variation within subgroups (i.e. within each year).
Figure 2


You claim homogenization is required to correct for discontinuities created by equipment and site changes. Control charts are a measure of the within-and-between year variation, and as such they clearly show when a discontinuity has occurred. A major discontinuity appears as a step-change resulting in exceedance of upper and/or lower control limits, while a minor discontinuity appears as a step-change in the position of the subgroup mean above or below the center line.

You suggest discontinuation in the minimum temperature record at 1971. There is none. There is consistent cooling over the period of the record, and particularly after 1975, which corresponds with the Snowy Mountains hydroelectricity and irrigation scheme coming online.

You attribute cooling in the data to a non-existent discontinuity. As I establish above this discontinuity is fictional. Cooling in the data is likely associated with local land use change in particular over 800,000 hectares (nearly 2 million acres) of land newly under irrigation in the immediate vicinity of Deniliquin as shown schematically in Figure 3.

Figure 3
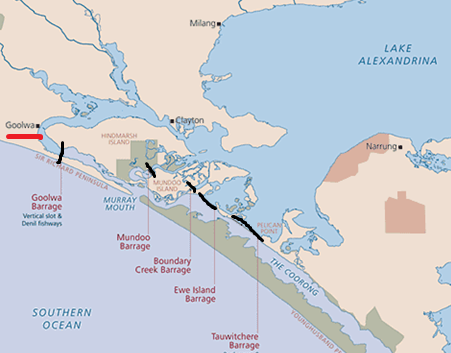
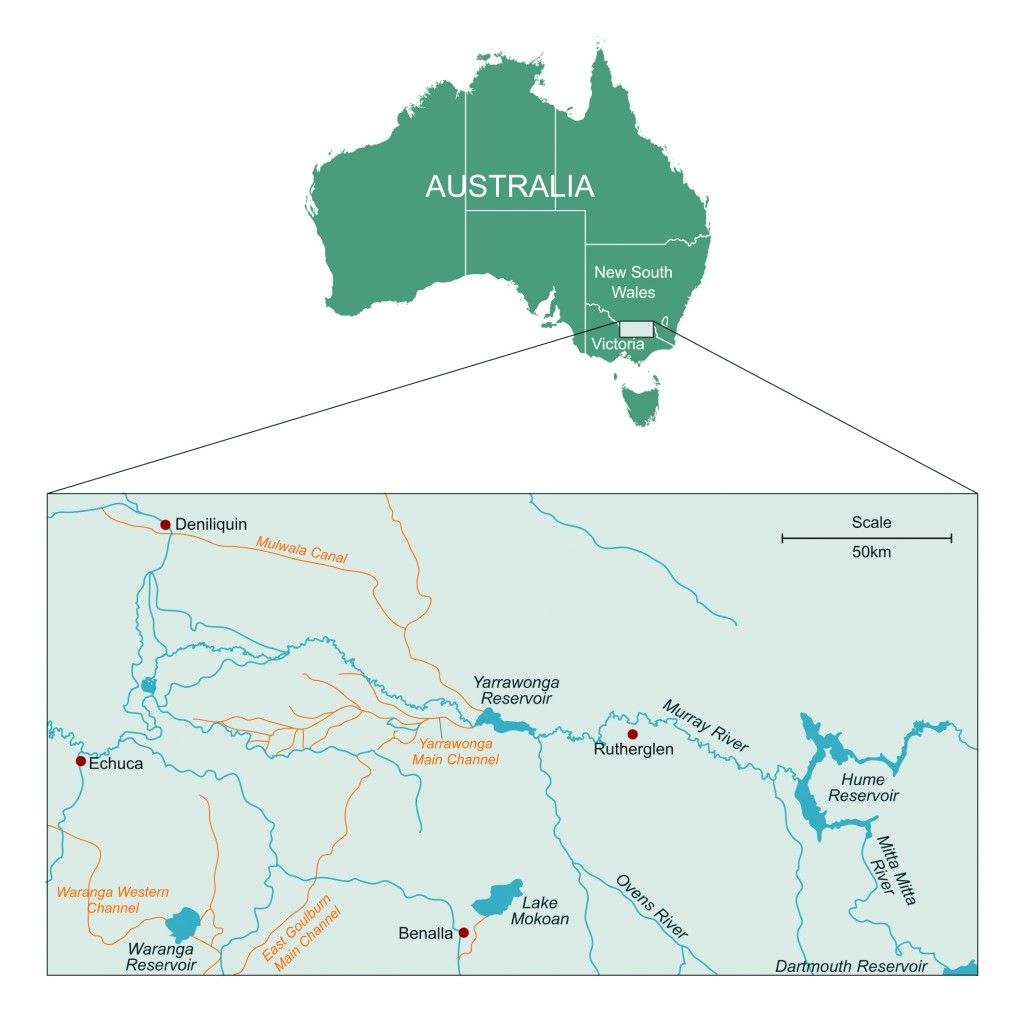
Figure 3.  Locations of Deniliquin and Rutherglen relative to main irrigation channels associated with development of irrigated agriculture in the Riverina, Australia

The Deniliquin temperature series is not an isolated instance of the Bureau making unsubstantiated claims regarding temperature series. The entire historical temperature record for Australia is being re-written by your ACORN-SAT team with fictitious justifications.

I am happy to provide further examples. You have indicated that you would prefer this information as a reprint, which I will forward as soon as it is available.  If you are interested in discussing anything aforementioned, I would be happy to arrange a time.

Yours sincerely

Dr Jennifer Marohasy
Independent Scientist

*Torok, SJ and Nicholls, N 1996. A historical annual temperature dataset for Australia. Aust. Met. Mag., 45, 251-260.

___________________

This blog posts continues the Rutherglen saga.  You can read some background information here… https://jennifermarohasy.com.dev.internet-thinking.com.au/temperatures/rutherglen/ . The next most recent Rutherglen blog post is here… https://jennifermarohasy.com.dev.internet-thinking.com.au/2015/08/bureau-just-makes-stuff-up-deniliquin-remodelled-then-rutherglen-homogenized/ .   I still believe that someone should be sacked for making up global warming at Rutherglen…  https://jennifermarohasy.com.dev.internet-thinking.com.au/2014/08/whos-going-to-be-sacked-for-making-up-global-warming-at-rutherglen/ .   But alas the progressives who set the national agenda want to believe in global warming, even if it requires rewriting the climate history of Rutherglen.  So much for evidence based public policy. What did George Orwell write… he who controls the present, controls the past.

Filed Under: Information

Bureau Just Makes Stuff Up: Deniliquin Remodelled so Rutherglen can be Homogenized

August 11, 2015 By jennifer

The Australian Bureau of Meteorology just makes stuff up.    You may remember Rutherglen, that town in north eastern Victoria, Australia, where the Bureau changed a slight cooling trend in the minimum temperatures to catastrophic global warming?  After they were caught-out, they claimed the “adjustments” were necessary because there had been a site move.  That’s right, moving a weather station between paddocks changed a cooling trend of 0.35 degree Celsius per century into a warming trend of 1.7 degree Celsius!

That didn’t seem so convincing on reflection.  And there has always been the issue of evidence.  That’s right.  Where is it documented that the weather station was ever moved?

More recently, the Bureau has been claiming that it had to change the temperatures at Rutherglen because they were different from temperatures at near-by locations.  Of course, a real scientist wouldn’t tamper with data because it showed an unusual trend.   Rather the unusual result might be investigated.

But not the Bureau.  It changes the trend at Rutherglen so it matches neighboring stations, but only after first changing the trend at neighboring stations so it matches the global warming trend.

In protest I’ve sent an email to the CEO, Vicki Middleton.

Dear Ms Middleton,

Re: Deniliquin shows statistically significant cooling, Rutherglen just shows cooling

I am writing to request that you correct a Bureau of Meteorology fact sheet*, which shows remodelled (homogenized) data for Wagga, Deniliquin and Kerang with actual physical temperature measurements (raw data) for Rutherglen.

Several members of the public, seeking clarification regarding adjustments to the temperature record for Rutherglen, have been advised by you in recent correspondence that the adjustments at Rutherglen are necessary to make temperature trends at Rutherglen more consistent with neighboring sites.   In particular, you have directed them to this fact sheet* that shows minimum temperatures at Rutherglen cooling, while temperatures at Wagga, Deniliquin and Kerang are warming.  What you have failed to point out, however, is that the Wagga, Deniliquin and Kerang series represent homogenized time series.   That is, the data have been substantially remodelled.

CHART3-WITH EXPLAINATION-Ver2

There is no single, long, continuous, raw minimum temperature record from the same site for either Kerang or Wagga.   Recordings were made at Wilkinson Street, Deniliquin, from February 1867 to June 2003, providing a record comparable in length to the raw series from Rutherglen.

I have plotted the raw temperature series for three Deniliquin locations below, including the data from Wilkinson Street from 1913, which is when the Rutherglen series begins.

Chart3-Revised-Deni-Rutherglen

The top green squiggly line represents data from Wilkinson Street, Deniliquin, the short purple squiggle is data from the airport at Deniliquin, and the mustard-colored squiggle is from a site referred to as Falkiner Memorial, Deniliquin.

Also shown in this chart are both homogenized and raw data for Rutherglen, as the red and blue squiggly lines, respectively.

The three dotted-lines represent the linear trends from Wilkinson Street (green), the raw (blue) series for Rutherglen, and the homogenized (red) series for Rutherglen.

The cooling trend in the Wilkinson Street, Deniliquin series of 0.6 degree Celsius per century is statistically significant (p<0.05).

I appreciate that you may have been misled by your employees into believing that the cooling trend at Rutherglen (represented by the blue line in the above chart) is erroneous.   This is not the case.

I recognize that this cooling trend evident in the minimum temperature record for much of the twentieth century at many rural locations in south eastern Australia is inconsistent with official Australian and also global trends.   Nevertheless, it does appear to be real, and is statistically significant for some locations.   Of course, real scientists are concerned with the interpretation of real data, rather than remodeling to generate constructs that fit popular political agendas.

Yours sincerely,
Jennifer Marohasy BSc PhD
Independent Scientist

9th August, 2015

Copy Maurice Newman, chairman of the Prime Minister’s Business Advisory Council.

*The following document is cited in Bureau correspondence as a Fact Sheet:

Bureau of Meteorology, 2014. ACORN-SAT station adjustment summary – Rutherglen (as at 24 September 2014), Accessed 8 August 2015.  http://www.bom.gov.au/climate/change/acorn-sat/documents/station-adjustment-summary-Rutherglen.pdf

Filed Under: News Tagged With: homogenization, Temperatures

  • « Go to Previous Page
  • Go to page 1
  • Interim pages omitted …
  • Go to page 26
  • Go to page 27
  • Go to page 28
  • Go to page 29
  • Go to page 30
  • Interim pages omitted …
  • Go to page 445
  • Go to Next Page »

Primary Sidebar

Recent Comments

  • Ian Thomson on Vax-ed as Sick as Unvax-ed, Amongst My Friends
  • Dave Ross on Vax-ed as Sick as Unvax-ed, Amongst My Friends
  • Dave Ross on Vax-ed as Sick as Unvax-ed, Amongst My Friends
  • Alex on Incarceration Nation: Frightened of Ivermectin, and Dihydrogen monoxide
  • Wilhelm Grimm III on Incarceration Nation: Frightened of Ivermectin, and Dihydrogen monoxide

Subscribe For News Updates

  • This field is for validation purposes and should be left unchanged.

November 2025
M T W T F S S
 12
3456789
10111213141516
17181920212223
24252627282930
« Jan    

Archives

Footer

About Me

Jennifer Marohasy Jennifer Marohasy BSc PhD has worked in industry and government. She is currently researching a novel technique for long-range weather forecasting funded by the B. Macfie Family Foundation. Read more

Subscribe For News Updates

Subscribe Me

Contact Me

To get in touch with Jennifer call 0418873222 or international call +61418873222.

Email: jennifermarohasy at gmail.com

Connect With Me

  • Facebook
  • LinkedIn
  • RSS
  • Twitter
  • YouTube

Copyright © 2014 - 2018 Jennifer Marohasy. All rights reserved. | Legal

Website by 46digital