• Skip to primary navigation
  • Skip to main content
  • Skip to primary sidebar
  • Skip to footer
Jennifer Marohasy

Jennifer Marohasy

a forum for the discussion of issues concerning the natural environment

  • Home
  • About
  • Publications
  • Speaker
  • Blog
  • Temperatures
  • Coral Reefs
  • Contact
  • Subscribe

jennifer

Avoid Fake News: Listen to Alternative Perspectives

January 25, 2018 By jennifer

IT was all over the news this morning: Pope Francis condemning ‘fake news’, which he defined as:

The spreading of disinformation… It has to do with false information based on non-existent or distorted data meant to deceive and manipulate the reader.

In fact, the Pope is guilty of exactly what he preaches against, particularly with his encyclical on climate change issued back in 2015.

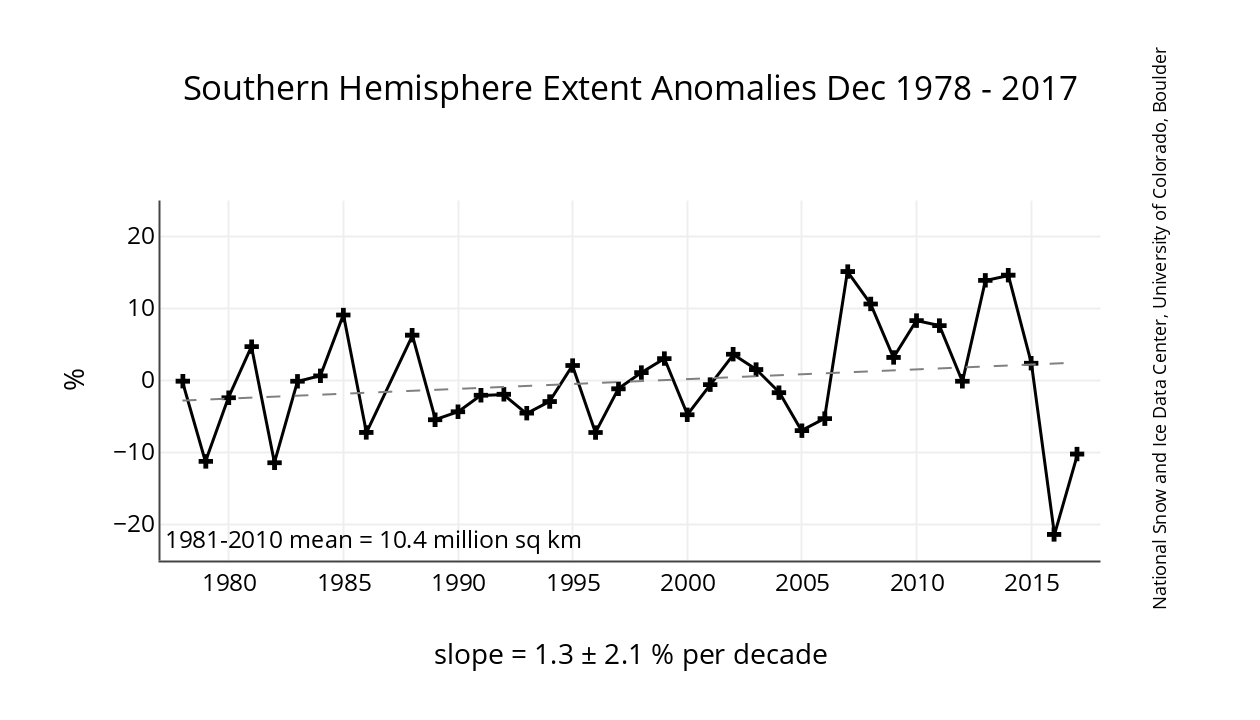
In that document, the Pope made various unsubstantiated claims suggesting that carbon dioxide was directly responsible for the melting of the polar ice caps, as just one example. In reality, at that time, while there had been significant melting at the North Pole, the South Pole had been gaining ice for some decades.

This plot of changes in the extent of sea ice suggests that the South Pole was gaining in ice from at least 1980 to 2015, contrary to the Pope’s encyclical issued in 2015. The significant ‘melt’ in 2016 corresponded with the super El Nino and minimum declination of the moon.

In his new message entitled ‘Fake news and journalism for peace’, the Pope suggests that one possible solution to fake news is to engage in healthy dialogue:

The difficulty of unmasking and eliminating fake news is due also to the fact that many people interact in homogeneous digital environments impervious to differing perspectives and opinions. Disinformation thus thrives on the absence of healthy confrontation with other sources of information that could effectively challenge prejudices and generate constructive dialogue…

This is perhaps just another way of suggesting we become more informed. Of course, this can be best achieved by being curious and asking questions. Indeed, Socrates said:

True wisdom comes to each of us when we realize how little we understand about life, ourselves and the world around us.

The Pope ended his message with a prayer that included:

Where there is superficiality, let us raise real questions.

Fake news is not an issue that will be easily solved. But the individual who has the wisdom to doubt, the courage to ask hard questions, and the fortitude to listen to alternative perspectives will get much closer to the truth and much more quickly.

********

Paul Driessen details some of the misinformation in Pope Francis’ 2015 encyclical on climate change in chapter 16 of the book I edited last year: ‘Climate Change: The Facts 2017’. Consider buying two copies, and sending one copy of the book with a polite letter to Pope Francis. Suggest he engage in dialogue with the sceptics on this issue.

Filed Under: Information Tagged With: fake news

Already Hottest January on Record for St Helens, Tasmania

January 22, 2018 By jennifer

LAST week, Andrew Johnson, CEO of the Australian Bureau of Meteorology, wrote that the Bureau’s “stewardship of Australia’s temperature record” had been found to be scientifically sound [1]. He also claimed it was in accordance with World Meteorological Organisation guidelines.

In fact, it’s not.

If it was scientifically sound, or in accordance with WMO guidelines, then it might at least be accredited – but it’s not.

“The Bureau has quality system certification in place (ISO 9001) for its aviation forecasting activities, to conform with the regulations of the International Civil Aviation Organization. This certification covers the management tools and processes ensuring that all the 80 or so meteorological products the Bureau produces meet client needs. The certification does not extend to measurement quality, including AWS data and messages, nor to the associated derived quantities and data streams.

“To address measurement quality, the WMO recommends that national meteorological agencies have ISO 17025 accreditation of key measurement processes. Accreditation covers the technical procedures and processes that ensure the traceability and integrity of measurements, as well as the technical competence of the staff making the measurements. While the Bureau does not currently hold ISO 17025 accreditation, it has internal processes, technical procedures, and measurement traceability and integrity that are largely in accordance with ISO 17025 requirements.”

The above two paragraphs are a direct quote from page 11 of a document entitled ‘Review of the Bureau of Meteorology’s Automatic Weather Stations’ published by the Bureau in September 2017.

To be clear, we have an organisation, costing the Australian tax payer about 1 million dollars per day, that operates largely in accordance with its own standards – that are ever changing.

This January, for the very first time ever, we even have weather stations that have already computed the monthly average maximum temperature for January.

Screen shot of the ‘Monthly mean maximum temperature’ page for St Helens Aerodrome at the Bureau’s website

I am writing and posting this note at my blog on Monday 22nd January – a full 9 days before the end of the month, before all the daily values are in for January 2018.

Of course, the already published value for January 2018 indicates that this January 2018 was the hottest ever at St Helens – measuring 25.9 degrees Celsius, when the monthly mean maximum temperature is 22.9. That makes this January a full 3 degrees warmer at St Helens – consistent with man-made global warming theory.

Considering the daily maximum temperature values so far for St Helens… the running average is 24 degrees Celsius.

The daily maximum temperatures so far actually recorded at St Helens this January 2018

This premonition that January’s mean monthly maximum temperature at St Helen is 25.9 degrees Celsius may all be an administrative error or a technical glitch. It may be easily explained and corrected. Then again, climate scientists across the world have form on this sort of thing. Remember the Climategate email sent from Geoff Jenkins to Phil Jones on 22 November 1996 suggesting they just make-up a value for Australia for December 1996 [2].

*****

[1]

Letter from Andrew Johnson, CEO, Bureau of Meteorology to The Australian newspaper published 18th January 2018

[2]

From: gjjenkins@meto.gov.uk
To: p.jones@uea.ac.uk, deparker@meadow.meto.govt.uk
Subject: 1996 global temperatures
Date: Fri, 22 Nov 1996 11:23 +0000 (GMT)
Cc: llivingston@meadow.meto.govt.uk, djcarson@meadow.meto.govt.uk, ckfolland@meadow.meto.govt.uk

Phil

Remember all the fun we had last year over 1995 global temperatures,
with early release of information (via Oz), “inventing” the December
monthly value, letters to Nature etc etc?

I think we should have a cunning plan about what to do this year,
simply to avoid a lot of wasted time.

I have been discussing with David P and suggest the following:

1. By 20 Dec we will have land and sea data up to Nov

2. David (?) computes the December land anomaly based on 500hPa
heights up to 20 Dec.

3. We assume that Dec SST anomaly is the same as Nov

4. We can therefore give a good estimate of 1996 global temps by 20
Dec

5. We feed this selectively to Nick Nuttall (who has had this in the
past and seems now to expect special treatment) so that he can write
an article for the silly season. We could also give this to Neville
Nicholls??

6. We explain that data is provisional and how the data has been
created so early (ie the estimate for Dec) and also

7. We explain why the globe is 0.23k (or whatever the final figure is)
cooler than 95 (NAO reversal, slight La Nina). Also that global annual
avg is only accuirate to a few hundredths of a degree (we said this
last year – can we be more exact, eg PS/MS 0.05K or is this to big??)

8. FROM NOW ON WE ANSWER NO MORE ENQUIRIES ABOUT 1996 GLOBAL TEMPS BUT
EXPLAIN THAT IT WILL BE RELEASED IN JANUARY.

9. We relesae the final estimate on 20 Jan, with a joint UEA/MetO
press release. It may not evoke any interest by then.

10. For questions after the release to Nuttall, (I late Dec, early
Jan) we give the same answer as we gave him.

Are you happy with this, or can you suggest something better (ie
simpler)? I know it sound a bit cloak-and-dagger but its just meant to
save time in the long run.

Im copying this to DEP and CKF also for comments.

Cheers

Geoff

*********
UPDATE: Within hours of this blog post the value for January 2018 was removed by the Bureau for St Helens, and other sites.

Filed Under: Information Tagged With: temperates

A Law Unto Themselves: The Australian Bureau of Meteorology

November 13, 2017 By jennifer

Sunday, 12th November 2017 – 4PM

Honourable Josh Frydenberg MP
Minister for Environment and Energy

Dear Minister

Re: Suspend announcement of new record hot days – Inform WMO that Bureau’s measurements are currently not comparable with mercury thermometers – Give directive for release of more A8 forms – Establish an audit mechanism

1. BACKGROUND

I write to confirm my receipt of some preliminary information from Mildura – you may remember that I wrote to you on 26th September suggesting that the new record hot day for Mildura announced by the Bureau of Meteorology of 37.7 degrees Celsius recorded on Saturday 23rd September, was unlikely to be a valid record because it was not measured consistent with calibration.

The Bureau have since acknowledged that their method of recording temperatures from electronic sensors is not accredited, though they claim it nevertheless gives readings equivalent to mercury thermometers. Interestingly, your office emailed a journalist, backing them up – claiming that a single electronic sensor can “mirror the behaviour of liquid in glass thermometers”. This is nonsense, because mercury and alcohol thermometers have different time constants. This is one reason the World Meteorological Organisation (WMO) insist on numerical averaging: alcohol thermometers (that measure temperature minima) have longer time constants than mercury thermometers (that measure temperature maxima).

Historically, alcohol thermometers were used to measure minimum temperatures, and mercury thermometers were used to measure maximum temperatures – across Australia. Then on 1 November 1996, the Bureau changed their ‘primary instrument’ to electronic sensors.

Anyway, I am grateful for the information recently received from the Bureau (following your directive), which does enable some comparison of measurements from a mercury thermometer with measurements from an electronic sensor, but only for Mildura for the period November 1996 to December 2000. I received this information in the form of over 4,000 scanned A8 forms, and have personally transcribed much of the relevant information, specifically the handwritten manual recording from the mercury thermometers.

2. MY PRELIMINARY FINDINGS

I can confirm, that the values recorded manually on the A8 forms from the mercury thermometers for the period November 1996 to December 2000 are significantly different from the official values recorded from the electronic sensors. If we consider just the values for September, the mean difference is statistically significant at the 0.05 level of probability, and is +0.34 °C, +0.27 °C and +0.28 °C for the years 1997, 1998 and 1999, respectively.

Somewhat surprisingly, the automatic weather stations at Mildura for these three Septembers recorded statistically significantly cooler temperatures than the mercury thermometers. (This is generally consistent with other values on the A8 forms, though winter and summer differences may be more extreme.)

This could suggest that the recent record hot day was in fact an underestimation of temperature. However, I’ve since been shown photographs that prove the electronic sensor in place at Mildura for those three years (1997, 1998, 1999) was shorter and thicker (with a correspondingly significantly longer time constant), than the Rosemount sensor that was in place on 23rd September 2017. Furthermore, the Bureau’s own documentation indicates that the Stevenson screen size has also changed – introducing yet another variable. Additionally, it has been brought to my attention that at that time – back in 1997, 1998 and 1999 – the official recorded temperatures were likely to be a numerical average taken over at least one-minute. The recent record was a one second-spot reading. I have confirmed this from the one-minute data for Mildura for 23rd September, also made available to me recently – following your directive.

While the current head, Andrew Johnson, claims the Bureau has always taken one-second readings from electronic sensors, this is at odds with a letter from Sue Barrell, Bureau of Meteorology, to Dr Peter Cornish dated 6th February 2013, available online here. The letter details a methodology much more consistent with World Meteorological Guidelines – specifically reference is made to numerical averaging.

The bottom line is that since the introduction of automatic weather stations over 20 years ago, there has been no documented standard against which Australian temperatures at Mildura, or anywhere else, have been recorded. Of most concern to me is the muddling, (including by your staffers), of the numerical averaging-period with the time constant. The Bureau somewhat confusingly often refers to the time constant as the sensor “averages”.

3. HISTORICAL TEMPERATURE RECORD

I have been reliably informed that when the various variables for Mildura are eventually determined – as they must – the actual hottest day on record for September for Mildura may be 22nd September 2003 or the 28th of September 1928 if temperatures before 1910 are ignored.

Interestingly, the hottest day ever for Mildura according to the official ACORN-SAT record is 10th January 1939; that summer of 1938-39 was exceptionally hot across south-eastern Australia. When I was researching the longer historical temperature record for Mildura a couple of years ago (at the same time I was correcting for Stevenson screen installations and moves from the post office to the airport in back-of-the-envelope type calculations), I determined that the hottest summer on record at Mildura was likely 1905/1906.

Backing this up, a relatively recent study published by Lucinda Coates and colleagues (Environmental Science and Policy, Volume 42, 2014) identified Januaries in 1879, 1896, 1906 and 1908 as being months with ‘significant heat events’ in Australia.

Our Bureau ignores this early pre-1910 historical temperature record, and after 1910 corrects for its political incorrectness through homogenisation as I have detailed elsewhere.

4. ECONOMIC IMPLICATIONS

Whilst the historical temperature record issued by the Bureau may have only been of limited, or academic interest, in the past this is no longer the case in view of the current scientific and public policy debate about global warming. These temperature recordings are now the primary input data which determine a range of scientific predictions, projections and model outputs with enormous, fiscal, economic and political implications both for Australia and internationally. If these temperature recordings are wrong then all the consequent scientific, fiscal, economic and political decisions based on this data may be wrong also.

On this basis, given the importance of the temperature record, I would suggest that there needs to be an ongoing and independent oversight audit mechanism/group established to ensure that you and the government can be confident that you are receiving reliable and accurate temperature records on which to base government policy decisions both nationally and internationally.

The fiscal records of government agencies are independently and regularly audited for amounts far less than the fiscal and economic impacts of global warming policies so it would seem only prudent and reasonable that the temperature records of the Bureau of Meteorology, which have such huge fiscal and economic impacts, should be subject to a similar audit regime to ensure their accuracy, integrity and reliability.

Historical temperature records back to 1880 are the primary input data which determine the range of scientific predictions, projections and model output with enormous fiscal, economic and political implications both for Australia and internationally.

Current and historical temperature records for Mildura, as measured and collated by the Bureau, are included in the calculation of global temperatures by the UK Meteorological office and NASA – subsequently relied upon by the United Nations Intergovernmental Panel on Climate Change informing the Paris Accord.

Perhaps unbeknownst to these organisations, our Bureau has a ‘novel’ method of recording temperatures from electronic sensors in automatic weather stations that cannot logically give readings consistent with the liquid-in-glass thermometers, which were the primary instruments for Australian temperature measurements until 1 November 1996.

5. RECOMMENDATIONS

Given the importance of the temperature record being correct: there is a need for an ongoing and independent oversight audit.

Inform the WMO that the temperatures recorded by our Bureau are not consistent with calibration, nor any international standard.

Direct the Bureau to desist from announcing new record hot days – not only for Mildura but for all 563 automatic weather stations recording surface temperatures across Australia.

Also, I would be grateful to receive more scanned A8 forms, specifically for the period 1 January 2001 until 30 September 2017 for Mildura. (It could be that I have only received A8 forms for Mildura until December 2000, as the Bureau is awaiting your directive to release the forms after this date.) I also await advice regarding the availability of scanned A8 forms from the other 38 locations with parallel data, as I detailed in my letter to you of 22nd October 2017.

Yours sincerely

Jennifer Marohasy BSc PhD
Senior Fellow, Institute of Public Affairs
Founder, Climate Modelling Laboratory, Noosa
Member, International AltMet Network

The assistance of AltMet Network members LP, KS, JV, MN, PC, PM and RM is gratefully acknowledged in the drafting of this letter.

Filed Under: Information Tagged With: Temperatures

Averaging by Convention – or Not

October 17, 2017 By jennifer

FOR some time, weather enthusiasts across Australia have been noticing rapid temperature fluctuations at the ‘latest observations’ page at the Australian Bureau of Meteorology’s website. For example, Peter Cornish, a retired hydrologist, wrote to the Bureau on 17 December 2012 asking whether the 1.5 degrees Celsius drop in temperature in the space of one minute at Sydney’s Observatory Hill could be a quirk of the new electronic temperature sensors. Ken Stewart, a retired school principal, requested temperature data for Hervey Bay after noticing a 2.1 degrees Celsius temperature change in the space of one minute on 22 February 2017.

So, begins my article to be published later today at The Spectator online, perhaps to be entitled ‘More Hot Days Caused by Purpose-Designed Temperature Sensors’. [That article was eventually published at both The Spectator and WUWT.]

But if you read a bit beyond the headline you will see that my issue is not so much with the temperature sensors as the way in which the Bureau is not averaging according to calibration. In particular, and to paraphrase some more from the article…

Beginning some twenty years ago, electronic sensors have progressively replaced mercury thermometers in weather stations across Australia. The sensors can respond much more quickly to changes in temperature, and on a hot day, the air is warmed by turbulent streams of ground-heated air that can fluctuate by more than 2 degrees on a scale of seconds. So, if the Bureau simply changed from mercury thermometers to electronic sensors, it could increase the daily range of temperatures, and potentially even generate record hot days simply because of the faster response time of the sensors.

Except to ensure consistency with measurements from mercury thermometers there is an international literature, and international standards, that specify how spot-readings from sensors need to be averaged – a literature and methodology being ignored by the Bureau.

To be clear, the UK Met office takes 60 x 1 second samples each minute from its sensors, and then averages these. In the US, they have decided this is too short a period, and the standard there is to average over a fixed 5-minute period. In Australia, however, the Bureau takes not five-minute averages, nor even one-minute averages, but just one second spot-readings.

Check temperatures at the ‘latest observations’ page at the Bureau’s website and you would assume the value had been averaged over perhaps 10 minutes. But it is dangerous to assume anything when it comes to our Bureau. The values listed at the ‘observations’ page actually represent the last second of the last minute. The daily maximum (which you can find at a different page) is the highest one-second reading for the previous 24-hour period: a spot one-second reading in contravention of every international standard. There is absolutely no averaging.

Then again, how many of you knew that the mean daily temperature as reported by meteorological offices around the world is not an average of temperatures recorded through the day but rather the highest and the lowest divided by two – as is the convention.

This convention developed because (surface) temperature measurements were originally instantaneous measurements from mercury thermometers recorded manually each morning (providing the minima) and afternoon (providing the maxima).

So, in the UK the daily maximum from a weather station with an electronic sensor will be the highest value derived from the averaging of 60 samples over that one minute interval, while in Australia, the daily maximum will be the highest one-second spot reading.

And, the method for averaging from the sensors does matter, as shown in the attached spreadsheet using synthetic values to illustrate this point, and summarized in Figure 1.

Scroll to the end of this post to download the entire spreadsheet with all 60 numbers for each worked example.

The values shown in the three-worked example fall well within the general range of variation possible within a one-minute interval considering highest, lowest and last second values as shown in some of the datasets purchased by Ken Stewart from the Bureau earlier this year.

In the first example, which could be symptomatic of ‘sensor noise’, there is a single outlier of 22.1 in the 60 one-second readings from the sensor. If these are averaged, as is done by the UK Met office, then the recorded temperature measurement for that minute is 20.1 degrees Celsius. If, however, the highest one-second value is recorded, which is the method applied in Australia, the recorded temperature would be 22.1 degrees Celsius. There is a whole 2 degrees of difference. If we apply the meteorological convention for generating mean daily values, then the difference is 1 degrees Celsius (0.9666 rounded).

In the second example, which could reflect a wind direction change, or jet plane exhaust, the difference between the UK Met office method of averaging over 1 minute versus the Australian method of taking a one second spot reading is the rather large 2.9 degrees Celsius.

In the third example, where there is a step change, the difference between the UK and Australian methods for treatment of sub-minute readings is 1.8 degrees Celsius.

More recently the Bureau have attempted to suggest yet another method of averaging, as detailed in their Fast Facts. But this is really just obfuscation, in more recent correspondence with me CEO Andrew Johnson has used the correct term when calculating how long it takes a sensor to adjust to a step change in temperature, which is ‘time constant’.

*****

The spreadsheet detailing the different averaging methods can be downloaded here: Averaging-NF-JM

I am blessed to be part of an Alt-Met network that includes Kneel (who sent me a first version of this spread sheet), Ken Stewart, Lance Pidgeon, Phill and others… thanks for the conversations.

Filed Under: Information Tagged With: Temperatures

Faux Record Hot Days, Including at Mildura

September 28, 2017 By jennifer

Alan Jones AO
Radio 2GB, Sydney

Dear Alan,

This spring has begun with the Bureau of Meteorology announcing a new ‘hottest September day on record’ almost every other day.

Last Saturday, for example, we heard that it was the hottest September day in Mildura since 1889. Really? Hotter than 1905 or even 1938 – those were hot years in Mildura.

Extreme heat in inland Australia is usually associated with prolonged drought. But this year there is water in the Murray River; further, modern Mildura is generally considered up to half a degree cooler on average than before the widespread development of irrigation – back in the 1930 and 1940s, for example, drought really was the norm, along with rabbit plagues and dust storms.

Before the advent of irrigation the Murray river would run dry during periods of extended drought. These were exceptionally hot years in the Murray Darling Basin, and include 1915 and 1941. Photograph taken by Jennifer Marohasy, upstream of Mildura some years ago – in about 2007, which was a drought year post the building of the Hume Dam.

I wrote to Minister Josh Frydenberg earlier in the week explaining that these new record hot days are unlikely to withstand scrutiny – for Mildura or anywhere else. My letter included a fair amount of technical detail, and a request for data to enable a direct comparison of temperature measurements from the old-style mercury thermometers with the new style electronic probes in automatic weather stations (AWS) – letter attached.

In the case of Mildura, the current AWS electronic probe was installed on 27th June 2012 – the last official measurement from a mercury thermometer at Mildura was actually on 31st October 1996. Assuming a time constant of 18 seconds for the current probe and given the Bureau’s current method of only taking one-second readings (i.e. taking spot readings – rather than averaging over at least one minute in accordance with World Meteorological guidelines), then the recent record hot day for Mildura is probably only comparable to measurements taken back to September 2012 (last 5 years), perhaps back to 1996 (last 21 years) – certainly not back to 1889 as claimed by the Bureau and reported in The Age.

Minister Frydenberg has been kind enough to acknowledge receipt of my letter, but he doesn’t seem to get how important sorting out the mess that is the Bureau of Meteorology actually is. He has suggested that we meet in a few weeks, when he is not so busy as he is at the moment. Of course, Ministers are always busy – what gets done depends on what they choose to make a priority.

I am writing to you now because you have been so effective in the past at getting some things done. For example, after you interviewed me on Wednesday 26 July about the Thredbo weather station and the artificial limits the Bureau had imposed on the measurement of cold temperatures: the very next day – after 10 long years of the imposition of these limits – they were lifted at Thredbo.

Perhaps, you could invite me back onto your program to discuss this issue of faux hot day records?

This is the first time I have actually requested to come on your program. As those close to me know, I usually don’t sleep the night before such a radio or television interview – because I find it all so frightening. I much prefer to analyse data alone, write technical papers with colleagues, and go canoeing with just nature.

Perhaps just writing this letter to you, and posting it at my blog with be enough?

You could perhaps interview Craig Kelly MP instead – because he is across this issue. I see that Steve Price has been standing-in for you recently: perhaps Steve Price could interview Craig Kelly MP? You/Steve Price would really only need me if someone from the Bureau was prepared to actually come-on your show – then I would be keen to come-on and we could have a proper discussion about the myriad of technical issues that need sorting. In the meantime, there really is a need for a few more people to start discussing these issues in general terms – then the Minister might realise, finally, that there is no need for the average Australian to be paying ever more for their electricity because we may not actually have run-away global warming.

For me the overriding issue is the integrity of the historical temperature dataset, specifically the Australian Data Archive for Meteorology (ADAM). Indeed, I am currently driving my work colleagues mad-with incessant complaints about no-longer being able to trust any of the data from the Bureau of Meteorology.

Previously, I’ve complained about the remodelling by the Bureau of the ACORN-SAT dataset, while working with data from ADAM for my rainfall forecasting. But since discovering the limits on the recording of cold temperatures, and then coincident to this that the Bureau are taking spot-readings rather than averaging – it all seems more desperate than ever.

Yours sincerely
Dr Jennifer Marohasy
Noosa, Qld

Copy:
Craig Kelly MP
Steve Price (via Carla Horton)
John Roskam, IPA

Attachment/letter to Minister Frydenberg: https://jennifermarohasy.com.dev.internet-thinking.com.au/wp-content/uploads/2017/09/Marohasy-ABC-4-Mildura.pdf

Filed Under: Information Tagged With: temperates

Bureau Management Rewrites the Rules – Again

September 11, 2017 By jennifer

Following is the latest advice from the Australian Bureau of Meteorology regarding measurement of temperatures from automatic weather stations (AWS). This advice contains numerous errors of fact and is inconsistent with the information in an internal review issued just last Thursday.

The following misinformation has just been posted at the official Bureau website:
http://www.bom.gov.au/inside/AWS_Review_Fast_Facts.pdf

My responses to the inaccuracies in this document are prefaced with JM, and inserted herein.

FAST FACTS: How does the Bureau measure temperature?

1. The Bureau measures air temperature using an electronic sensor (a platinum resistance thermistor) placed within a Stevenson Screen, and temperature is recorded every second.

JM: No. The temperature is measured every second, it is not recorded every second by the Bureau. Rather, the Bureau has explicitly stated, most recently in an internal report released just last Thursday, that for each one minute temperature it only records the highest one-second temperature, the lowest one-second temperature, and the last one-second temperature – in that one minute interval. The Bureau does not record every one-second value. In the UK, consistent with World Meteorological Organisation Guidelines, the average temperature for each minute is recorded.

2. The air temperature fluctuates frequently on the scale of seconds. By using a sensor which has a longer response time than the fluctuations of the air temperature, the sensor “averages” these fluctuations.

JM: No. Electronic sensors have shorter response times than mercury thermometers. So, to ensure there is no discontinuity in measurements when the transition occurred from mercury thermometers to electronic probes the maximum and minimum values need to be calculated from one-second readings that have been averaged over at least one minute.

3. Both the mercury-in-glass thermometers, and the electronic sensors, are housed within a Stevenson Screen. The time taken for air to be exchanged from the outside environment to within the screen provides a further time integration for the measurement of the ambient air temperature.

JM: Noted.

4. The response time of the sensor used in the Bureau AWSs is as long or longer than the changes in the temperature of the air it is measuring.

JM: This may be the case. But the key issue has always been achieving consistency with measurements from the mercury thermometers – so there are no discontinuities in the temperature record with the transition from mercury thermometers to temperature probes. There was a report issued by the World Meteorological Organisation (WMO) in 1997 entitled ‘Instruments and Observing Methods’ (Report No. 65) that explained because the modern electronic probes being installed across Australia reacted more quickly to second by second temperature changes, measurements from these devices need to be averaged over a one to ten-minute period to provide some measure of comparability with the original thermometers.

5. This means that each one second temperature value is not an instantaneous measurement of the air temperature but an average of the previous 40 to 80 seconds. This process is comparable to the observation process of an observer using a “mercury-in-glass” thermometer. Are these methods consistent with international best practice?

JM: The two claims made in this dot point are not consistent with published studies. As regards ‘these methods’, if this is an attempt at justifying an instantaneous one-second reading, then the answer is: No. .

[Please also note the information as a postscript from Lance Pidgeon – scroll down to after the photograph of us both at Goulburn.]

6. The Bureau’s procedures comply with the World Meteorological Organization’s Guide to Meteorological Instruments and Methods of Observation (the CIMO Guide) WMO-No. 8 (2014 edition). The guide is available here.

JM: The guide at the said link clearly states on page 540 (Part 2, Section 1.3.2.4) that atmospheric air temperature be reported as 1 to 10 minute averages. Therefore, the Bureau’s procedures are not compliant with WMO guidelines.

7. The guide recommends that temperatures be integrated over time to smooth out rapid fluctuations. There is more than one method of achieving this. The WMO guidelines do not prescribe which method to take. In its automatic weather stations the Bureau achieves this by using platinum resistance thermometers. These are comparable to mercury in glass thermometers.

JM: No. The guide clearly states that readings from platinum resistance thermometers are not comparable with instant one-second readings from mercury in glass thermometers.

In summary, given the Bureau is taking one-second extrema, rather than following its own published guidelines (Instruments and Observing Methods Report No. 65, WMO/TD No. 862) recordings taken by the Bureau over the last twenty years from automatic weather stations across Australia may not be fit for purpose. In particular, temperature measurements from Australia since at least 1990 have not been recorded consistent with calibration, and therefore are likely to be invalid?

Jennifer Marohasy
11 September 2017 – 9pm

This advice is also provided as a PDF here: FAST FACTS -Refuted-V2

Jennifer Marohasy and Lance Pidgeon at the Goulburn AWS in early August 2017. Photograph courtesy of The Australian newspaper.

Comment from Lance follows as an important postscript

Following the link provided in the ‘Fast Facts’, I found this:

“It is recommended that the time constant, defined as the time required by the thermometer to register 63.2% of a step change in air temperature, should be 20 s. The time constant depends on the airflow over the sensor.”

This is a completely different thing to the sampling rate and averaging. It is describing the conditions BEFORE the one second sample rate not after.

This time, specifies the curve which is not an average. To compare an exponential decay curve to an average is wrong. If the curve time was over 60 seconds then the most recent would have most of the influence while the oldest would only have the influence of three timeconstants (63 percent of 63 percent of 63 percent).

A rule of thumb is that about 5 time constants need to pass before a reasonable measurement can be taken and 7 or more for an accurate measurment.

So is the BoM also trying to hide that this (before the averaging) time constant is also too short by confusing 5, 7 and 1 time constants as “40 to 80”?

Also, I just noticed that the standard calibration method looks to remove and ignore the noise during the procedure. In particular:

“Since the measurement instrument is an integral part of the electrical thermometer, its calibration may be checked by substituting the resistance thermometer by an accurate decade resistance box and by applying resistances equivalent to fixed 5 K temperature increments over the operational temperature range. The error at any point should not exceed 0.1 K. This work would normally be performed by a servicing technician.”

And with reference again to the ‘Fast Facts’, it is sad that the Bureau do not appear to understand the difference between a thermistor and a platinum resistance thermometer. I write this because the document that Jennifer has posted begins with reference to a ‘thermistor’ and ends with comment about a ‘platinum resistance thermometer’.

Lance Pidgeon
via Crookwell, near Goulburn
12 September 2017 – 8am

*****

As far as I can tell the 2014 document Lance quotes from (which the Bureau claim they are working in accordance with – though clearly they are not) is a someone garbled version of a technically solid report published in 1997, which includes the following advice:

An extract from ‘Instruments and Observing Methods Report No. 65, WMO/TD No. 862’

*****

According to the ‘Fast Facts’, the Bureau’s procedures comply with the World Meteorological Organization’s Guide to Meteorological Instruments and Methods of Observation (the CIMO Guide) WMO-No. 8 (2014 edition). Following are two important extracts from this document:

Uploaded by Jennifer on 14 September 2017 – for future reference.

Filed Under: Information Tagged With: Temperatures

  • « Go to Previous Page
  • Go to page 1
  • Interim pages omitted …
  • Go to page 19
  • Go to page 20
  • Go to page 21
  • Go to page 22
  • Go to page 23
  • Interim pages omitted …
  • Go to page 445
  • Go to Next Page »

Primary Sidebar

Recent Comments

  • Ian Thomson on Vax-ed as Sick as Unvax-ed, Amongst My Friends
  • Dave Ross on Vax-ed as Sick as Unvax-ed, Amongst My Friends
  • Dave Ross on Vax-ed as Sick as Unvax-ed, Amongst My Friends
  • Alex on Incarceration Nation: Frightened of Ivermectin, and Dihydrogen monoxide
  • Wilhelm Grimm III on Incarceration Nation: Frightened of Ivermectin, and Dihydrogen monoxide

Subscribe For News Updates

  • This field is for validation purposes and should be left unchanged.

November 2025
M T W T F S S
 12
3456789
10111213141516
17181920212223
24252627282930
« Jan    

Archives

Footer

About Me

Jennifer Marohasy Jennifer Marohasy BSc PhD has worked in industry and government. She is currently researching a novel technique for long-range weather forecasting funded by the B. Macfie Family Foundation. Read more

Subscribe For News Updates

Subscribe Me

Contact Me

To get in touch with Jennifer call 0418873222 or international call +61418873222.

Email: jennifermarohasy at gmail.com

Connect With Me

  • Facebook
  • LinkedIn
  • RSS
  • Twitter
  • YouTube

Copyright © 2014 - 2018 Jennifer Marohasy. All rights reserved. | Legal

Website by 46digital