• Skip to primary navigation
  • Skip to main content
  • Skip to primary sidebar
  • Skip to footer
Jennifer Marohasy

Jennifer Marohasy

a forum for the discussion of issues concerning the natural environment

  • Home
  • About
  • Publications
  • Speaker
  • Blog
  • Temperatures
  • Coral Reefs
  • Contact
  • Subscribe

jennifer

2021, New Year Wishes and Unreliable Weather

December 12, 2021 By jennifer

If I were the head of the Australian Bureau of Meteorology, I would make more skilful weather and climate forecasting my priority. I would put a system in place for measuring improvement, and I would make sure the team of meteorologists believed it was possible to improve, not only in their skill at providing daily weather forecasts, but also in seasonal rainfall forecasts.

Back in June 1944, British Meteorologist James Stagg was so skilful with his forecasting that that he could reliably advise General Eisenhower that there would be a lull in the storm. This information allowed the successful D-Day landing of 156,000 soldiers in Normandy to go ahead.

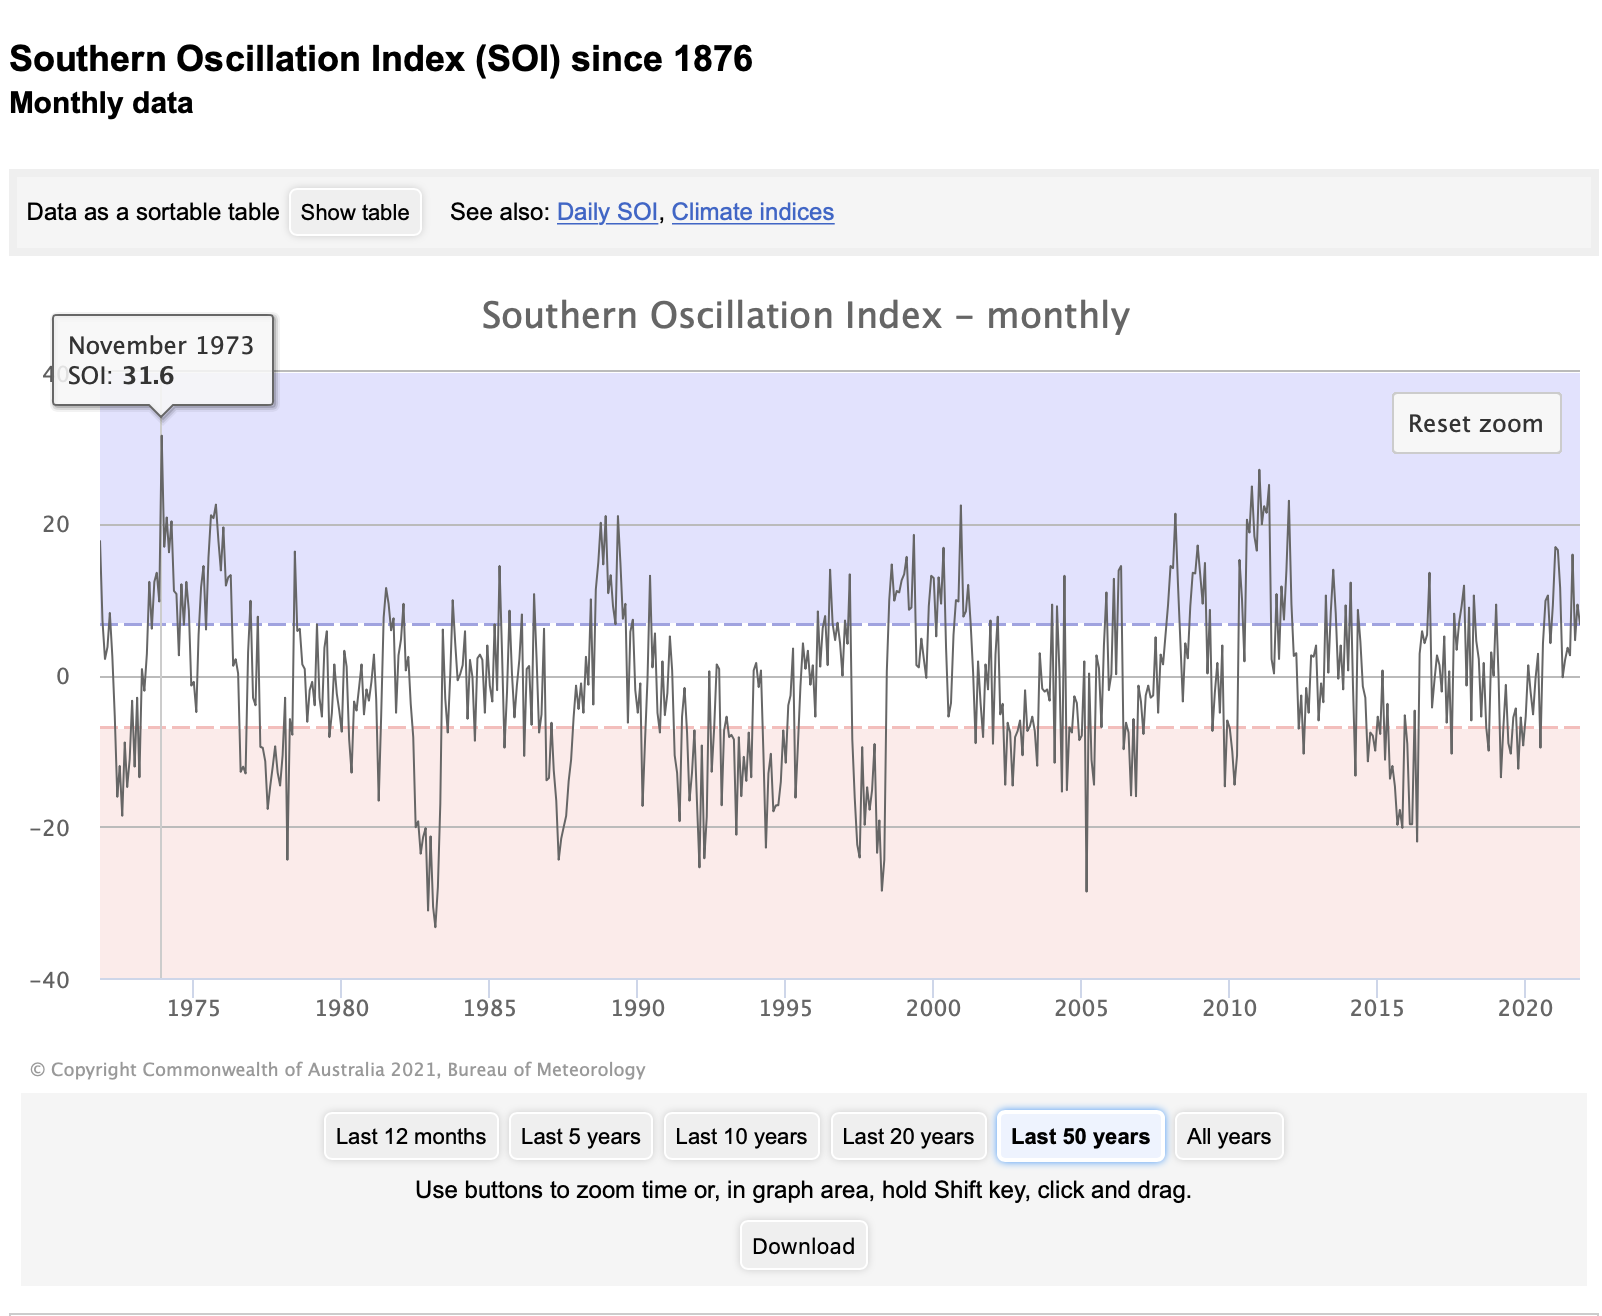
It is possible to forecast lulls in storms, and El Niño and La Niña events, because the passage of the Moon overhead is regular and cyclical. In the same way that artificial neural networks (ANNs) can be used to mine historical data on our social media preferences, interpret medical scans, and underpin driverless car technology, so too this technology could be used to generate more reliable weather and climate forecasts. John Abbot and I showed its application to monthly rainfall forecasting in a series of research papers and book chapters published from 2012 to 2017. They are listed at the end of this note. How the years go by.

If I was the head of the Australian Bureau of Meteorology, I wouldn’t be asking for an audit of the current system because I know that the tools my Bureau uses (simulation modelling) are not fit for the task at hand. In the same way I wouldn’t be asking for an audit of coral reef research. I would use the money instead to get some proper statistically rigorous programs in place for monitoring coral cover and water quality, and monitoring the skill of weather and climate forecasting – and of coral bleaching.

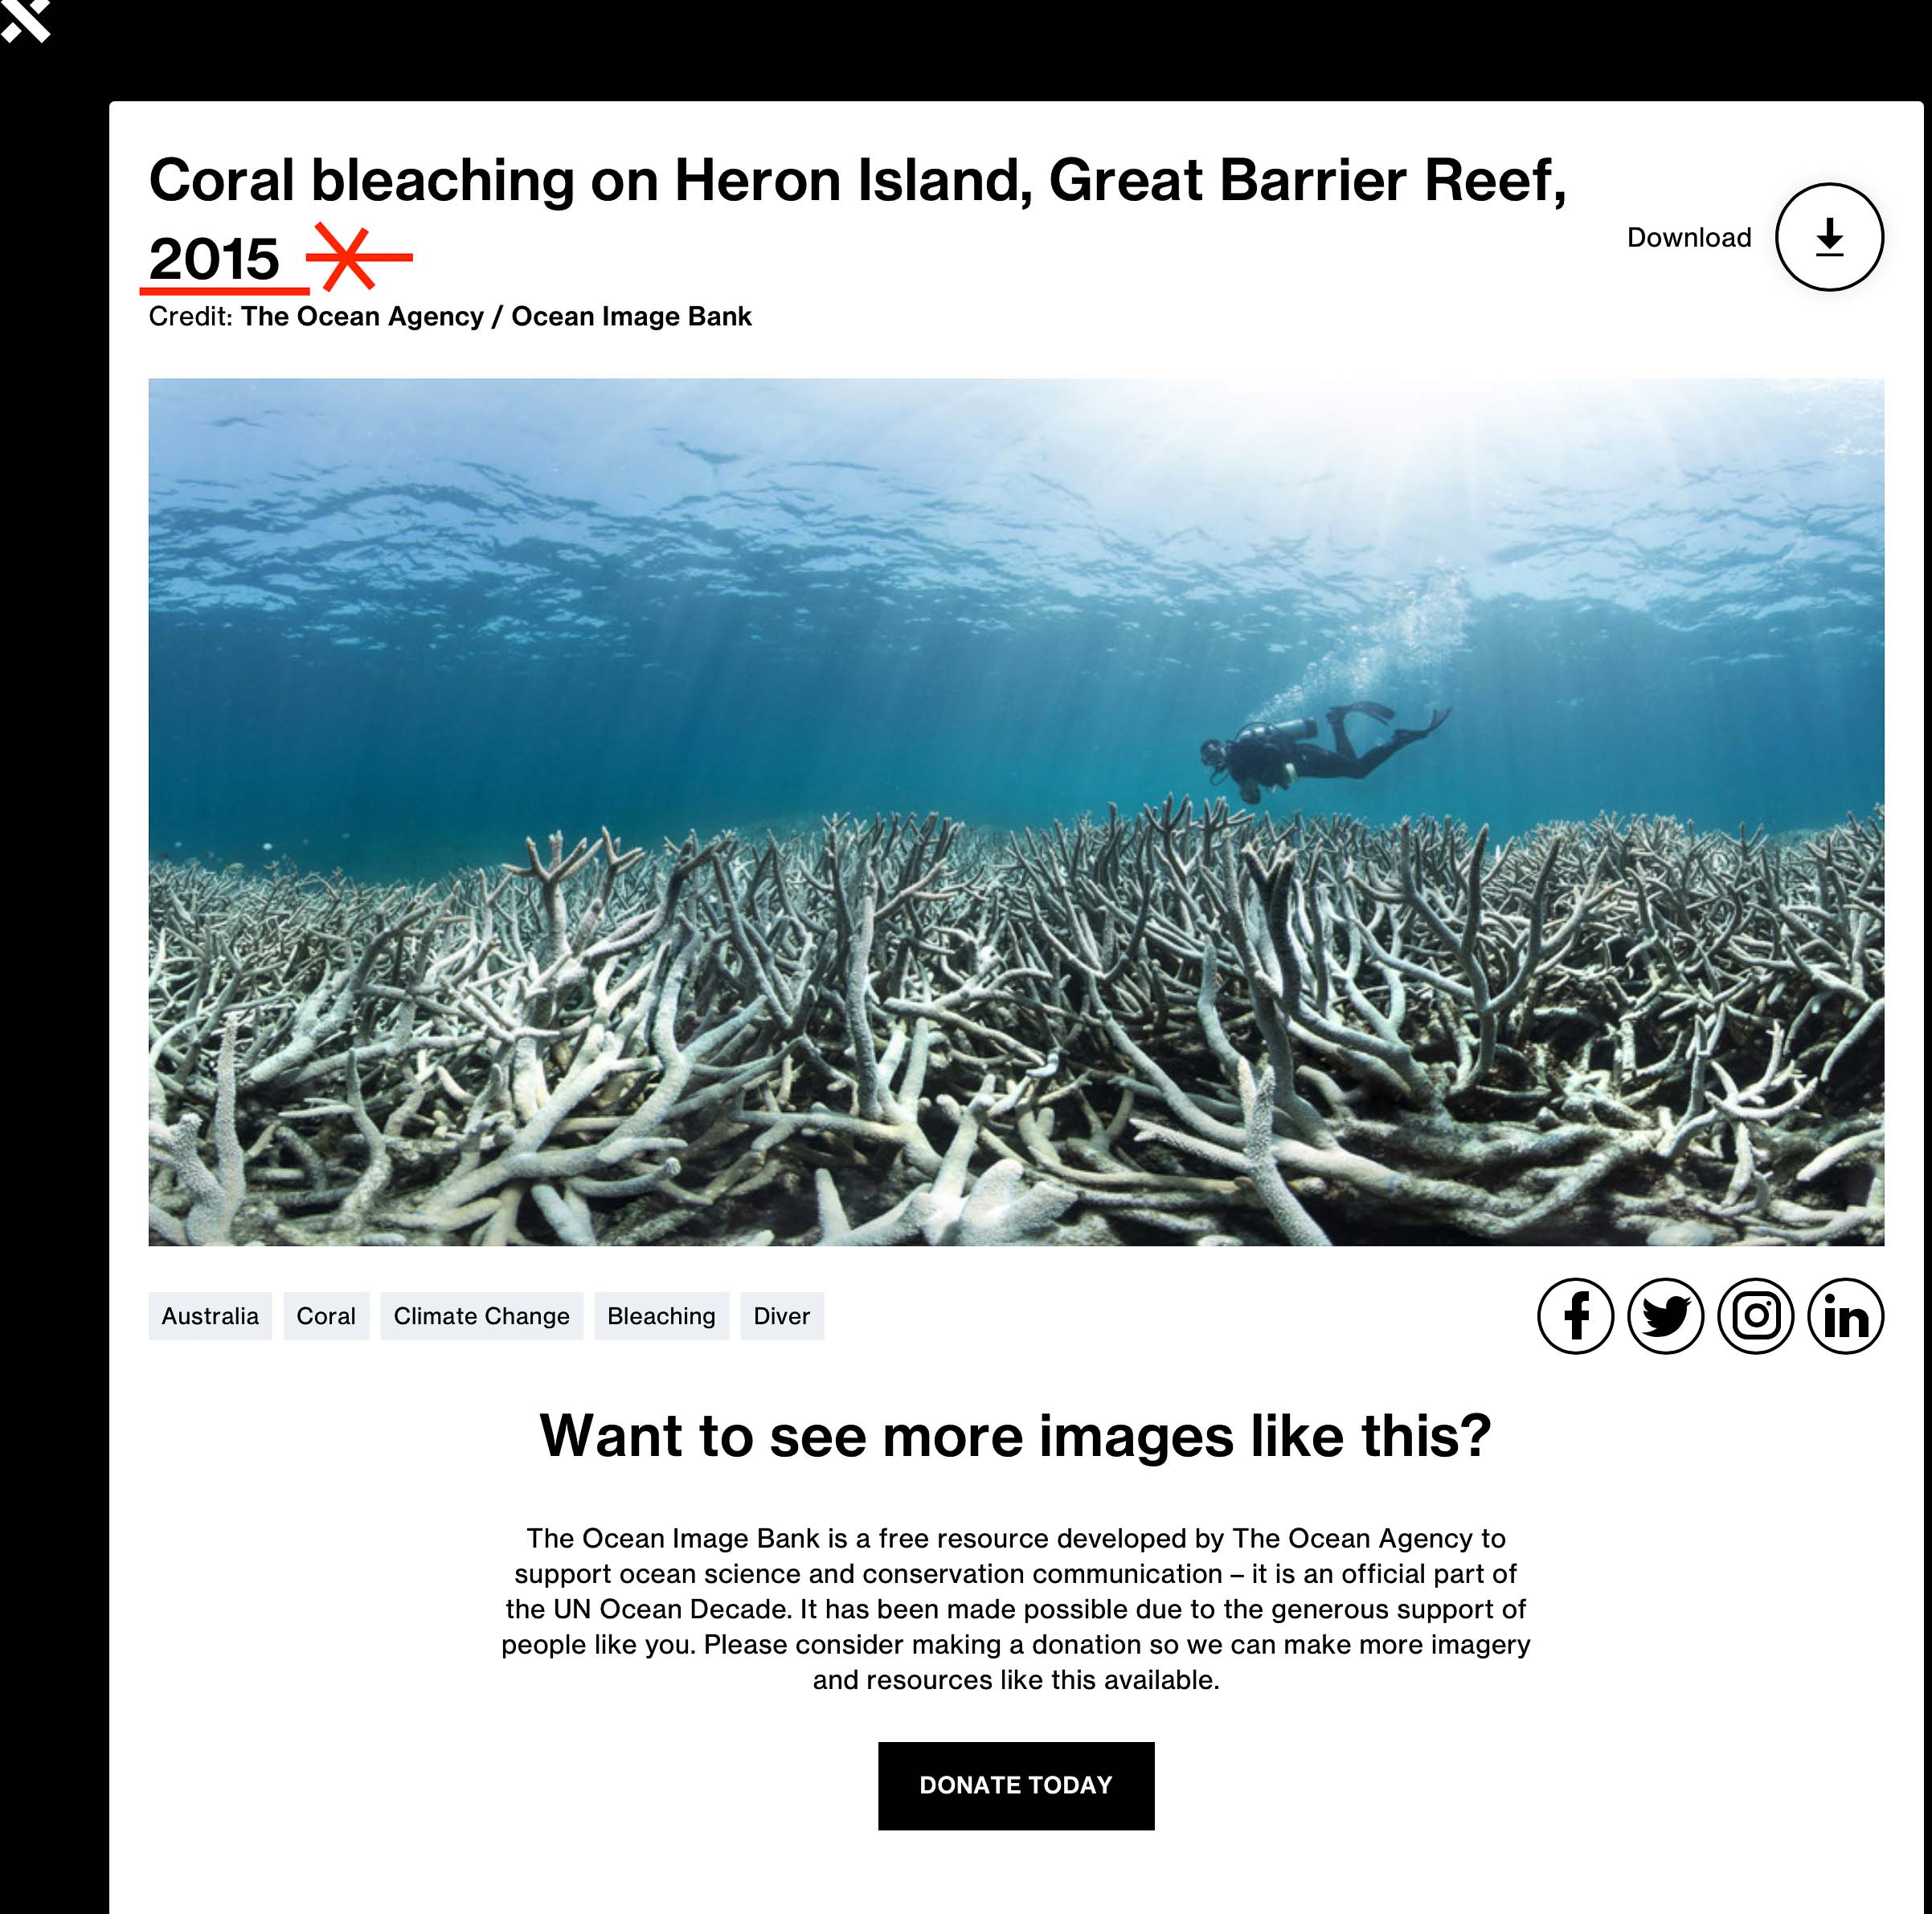
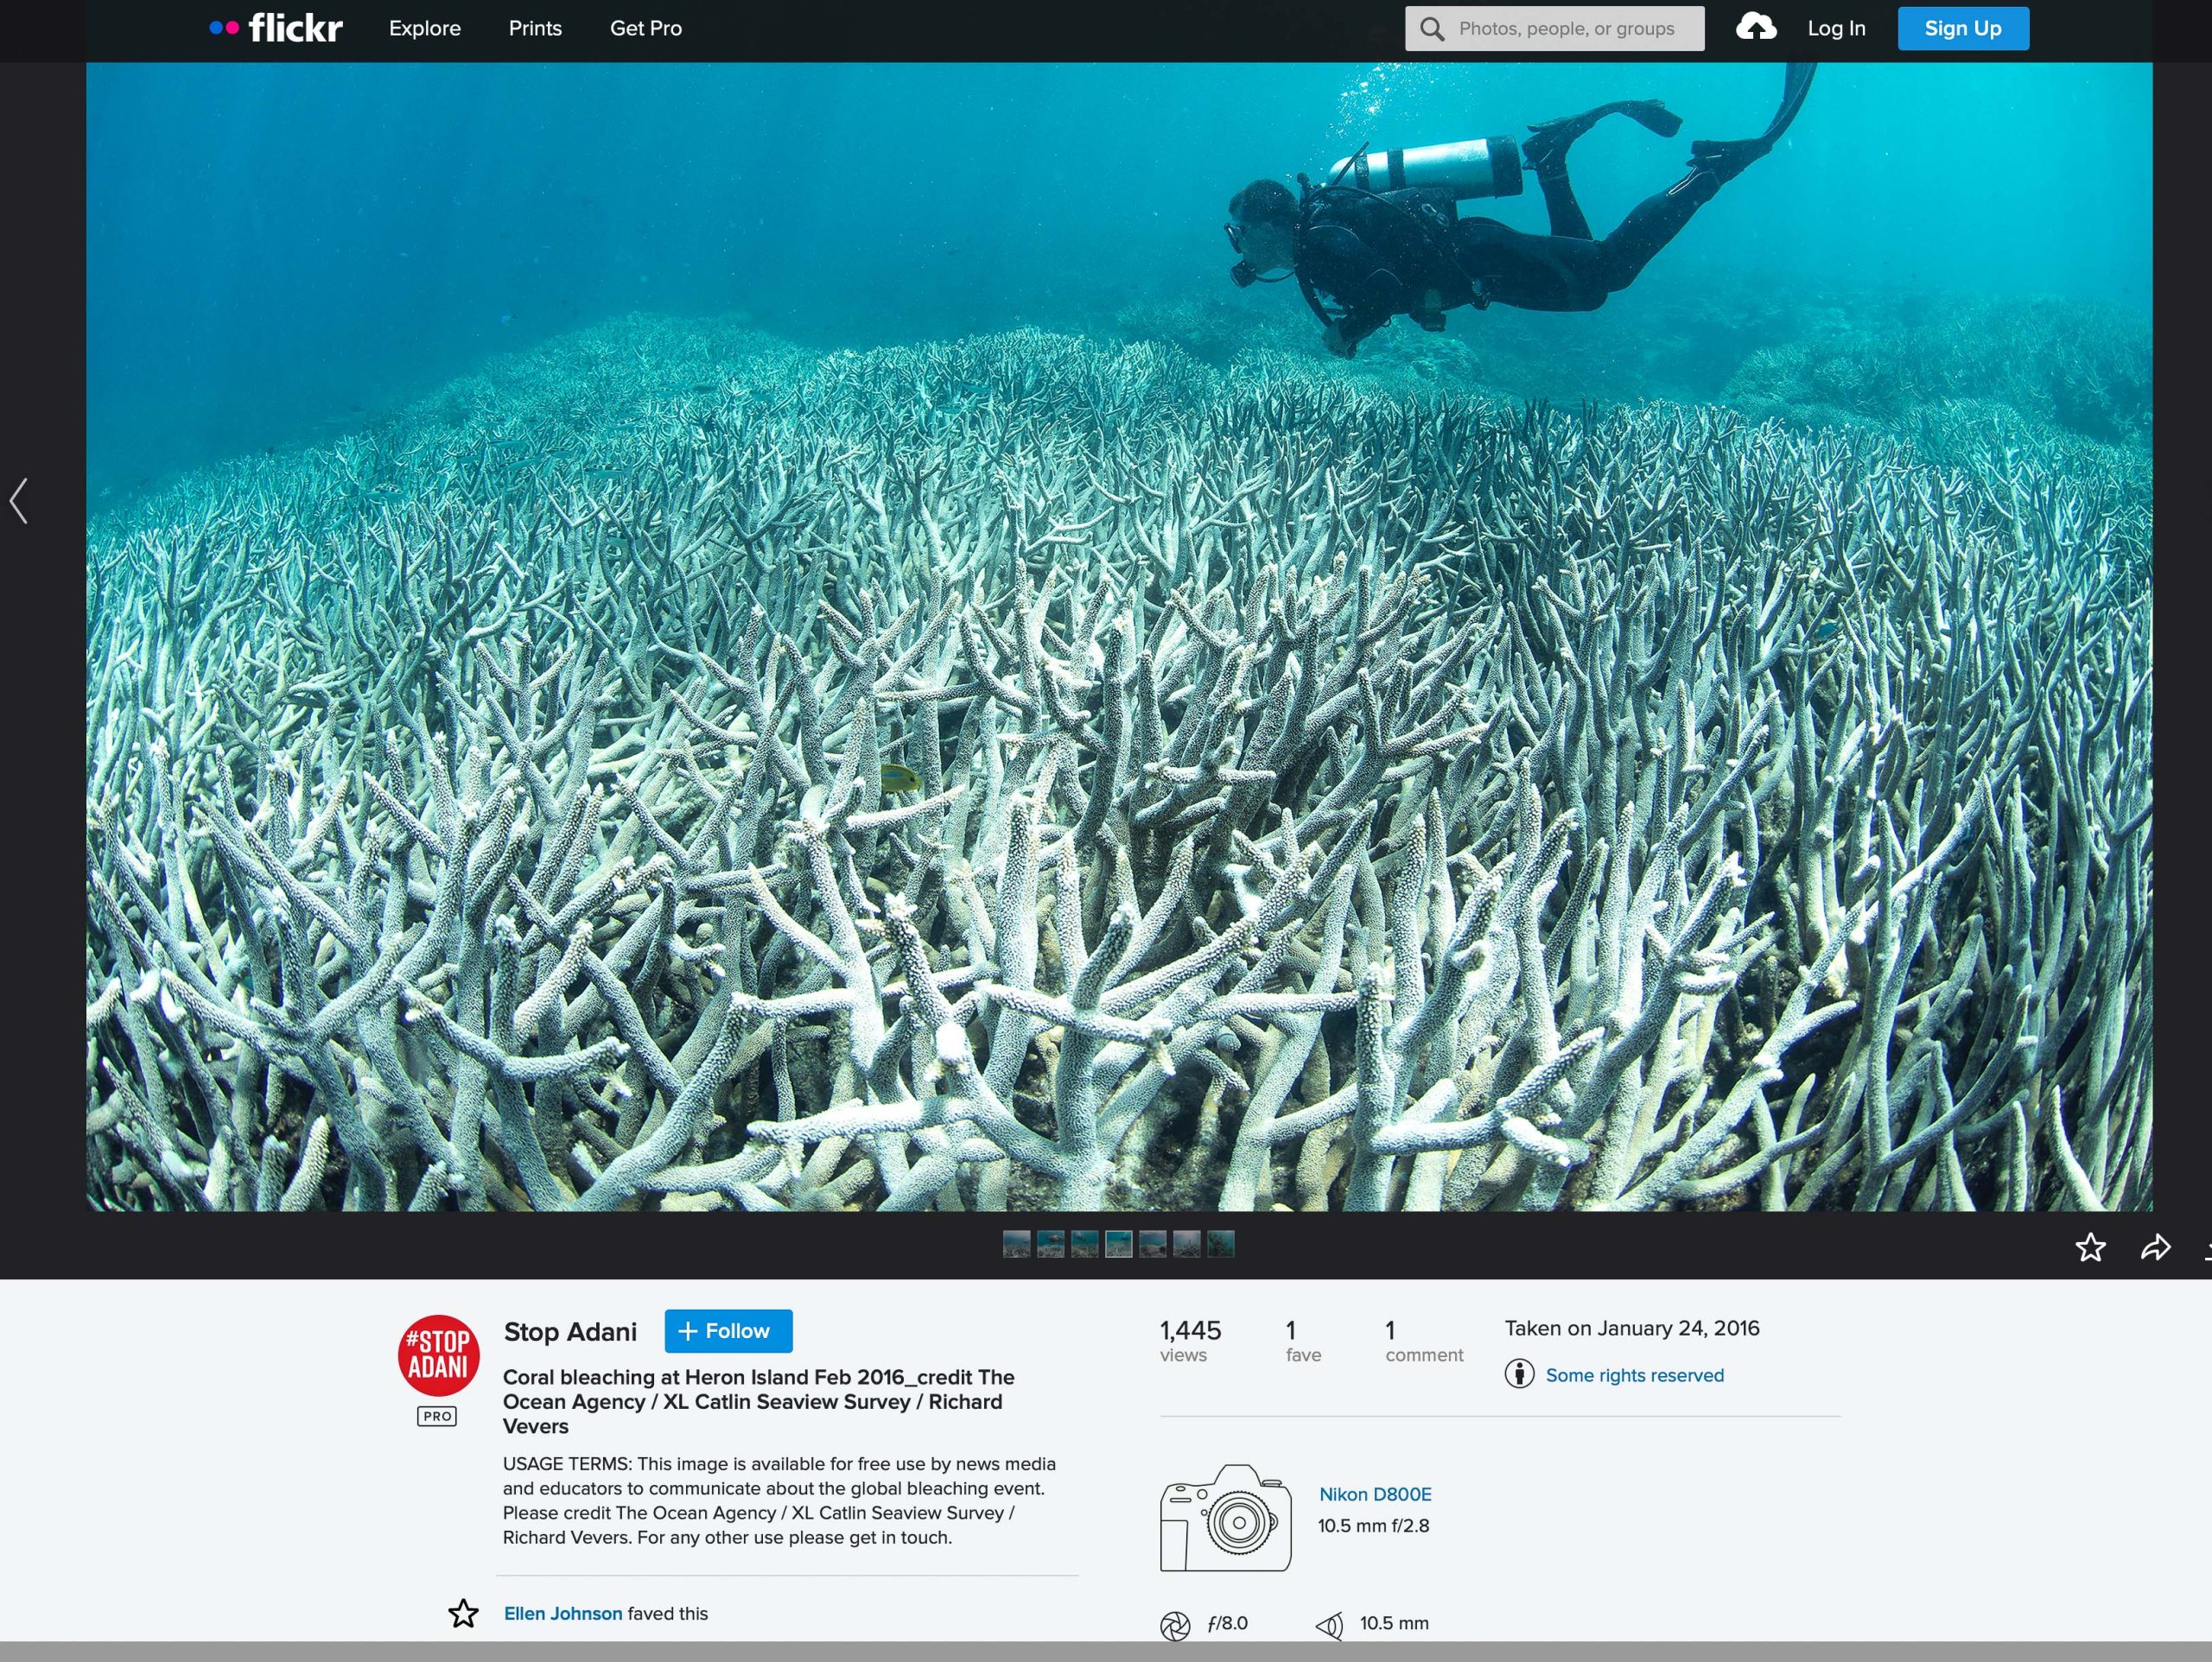
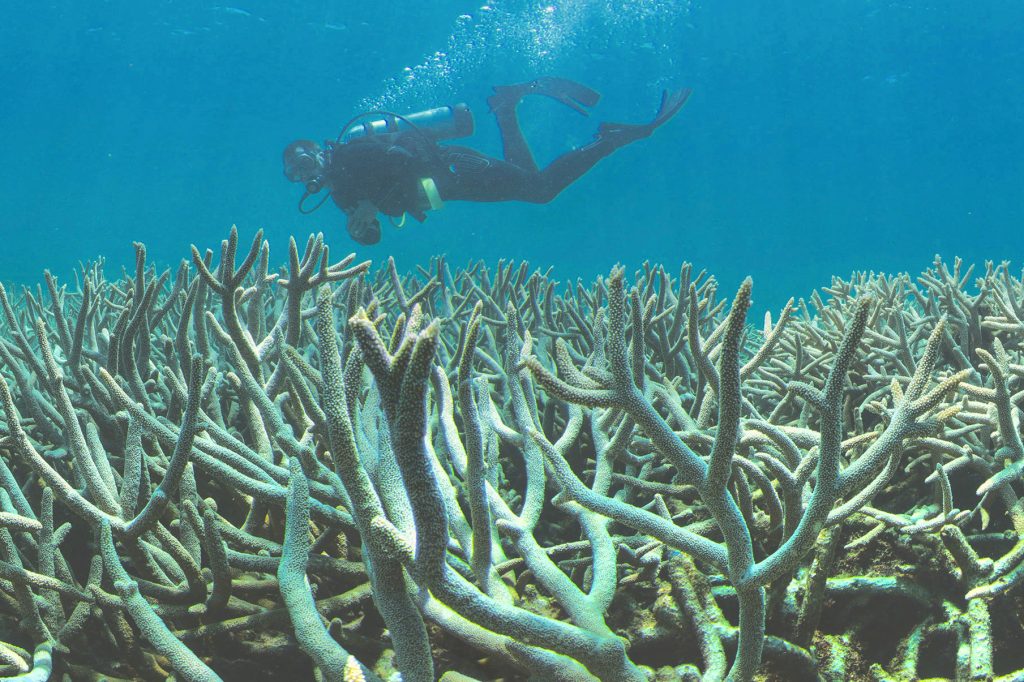
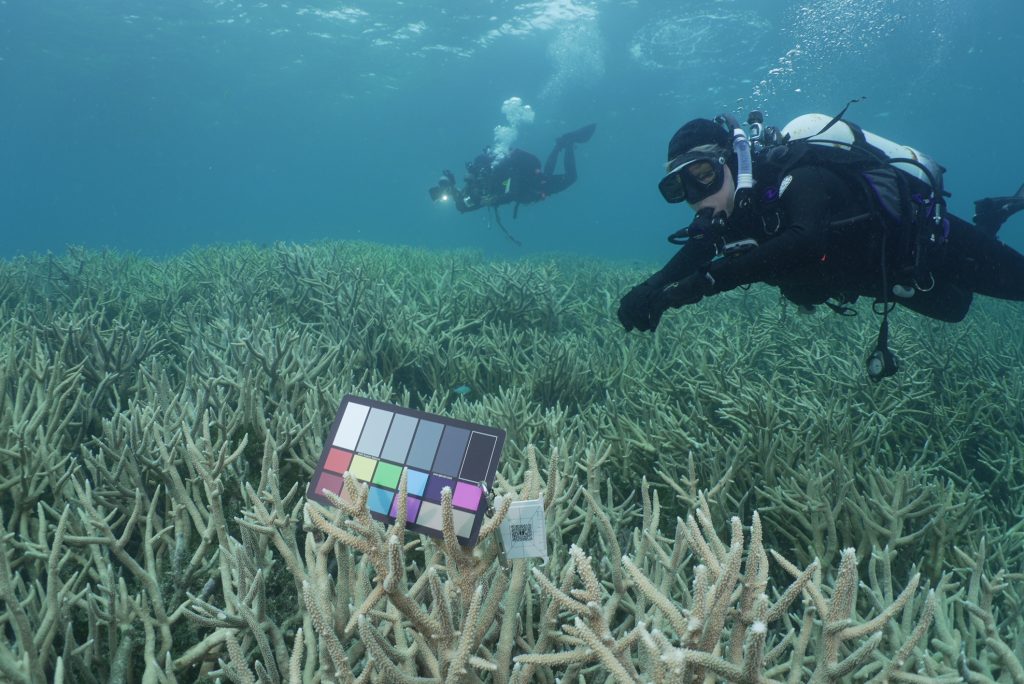
One of my proudest achievements of 2021 was showing how just three of us (Stuart Ireland, Leonard Lim and me) over a short two days working from a little speed boat could lay 36 transects at the inshore Pixie Reef just to the northeast of Cairns, and upload the photographs (with the help of Jaco Vlok) leaving a permanent record of the corals in different habitat types at that reef for that moment in time.  Pixie reef was recorded as more than 65 per cent bleached in 2016. That was an El Niño year, and also a year of relatively low sea levels along the western Pacific. You can see the state of Pixie Reef as it was in February 2021, five years later, for yourself, by clicking on each of the 360 thumbnail photographs published on my website.  Most of the corals are looking so beautiful.

Stuart Ireland with tape measure and camera just on 9am, 24th February 2021 at Pixie Reef.

As the Moon is the driver of La Niña–El Niño cycle, so changes in its orbital path correspond with periods of bleaching including the 2016 bleaching, as well as the recent wet weather along the east coast of Australia. James Stagg understood the importance of lunar cycles, and so do the Chinese. A technical paper by Jialin Lin and Taotao Qian entitled ‘Switch Between El Niño and La Niña is Caused by Subsurface Ocean Waves Likely Driven by Lunar Tidal Forcing’ is worth reading and is open access at ResearchGate.  I didn’t get a chance to mention it when I was recently on Sky TV with Andrew Bolt.  Andrew reminded us that not so long ago we were told by Tim Flannery that Australia’s reservoirs would never fill again because we were doomed to drought – forever.    He has been proven so wrong by the cycles of flooding since.

Arthur Day contributed chapter 4 to Climate Change: The Facts 2020. Recently, he sent me some more information on Antarctica. I published this at my blog along with a video Stuart Ireland made after he visited Antarctica a few years ago – when he got to swim with the seals. It’s magical.

Antarctica is a long way from the Great Barrier Reef, but it is the temperature and pressure gradients between the two – or at least between the Poles and the Equator – that can have a major impact on the intensity of the Earth’s weather systems.

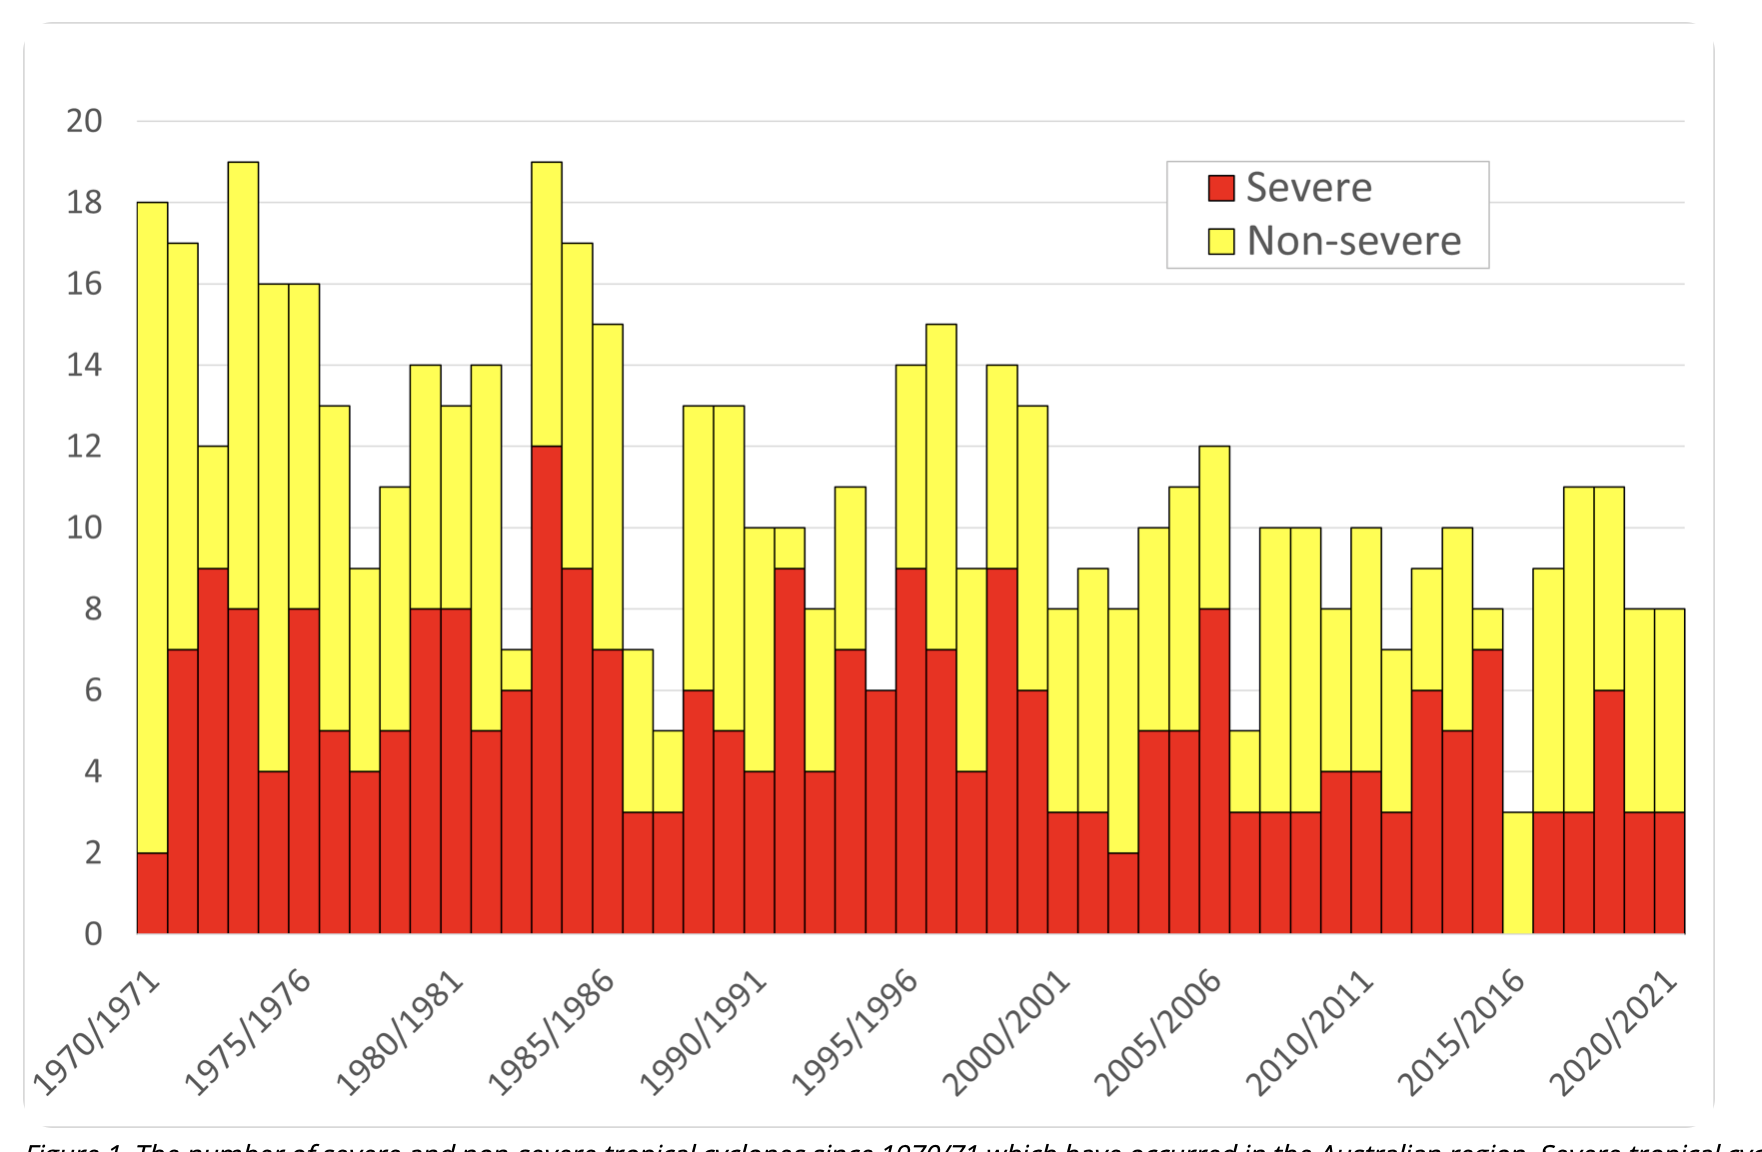
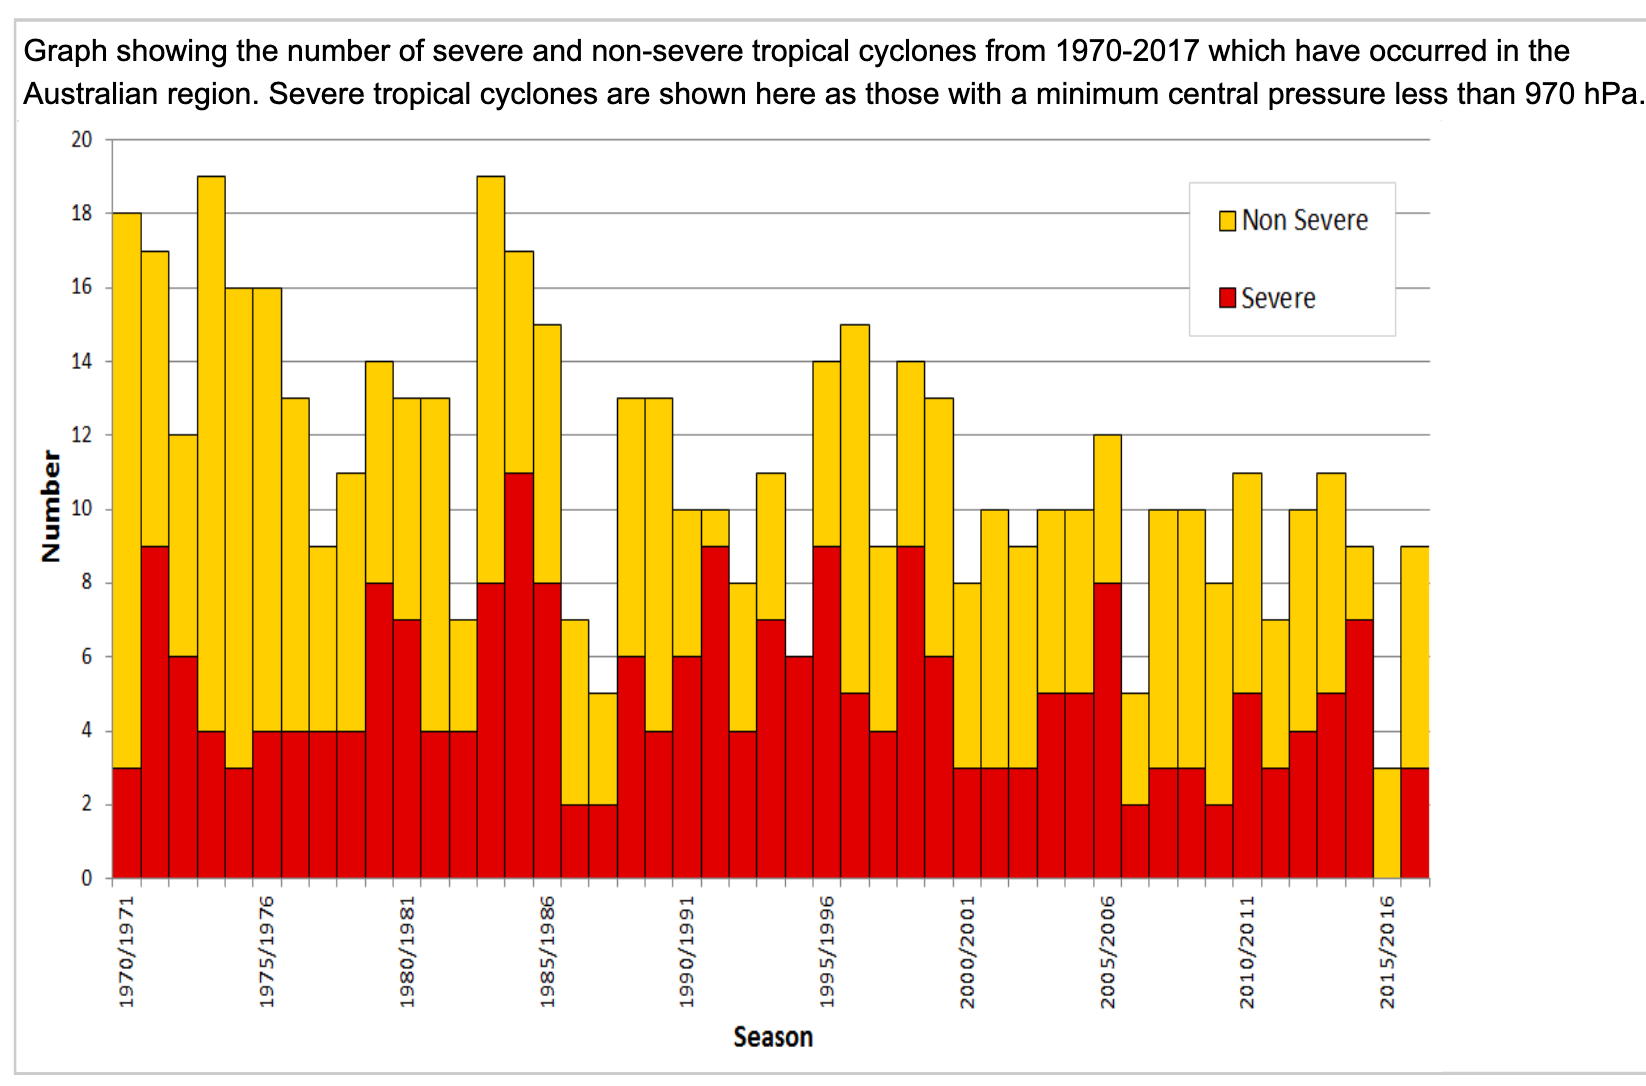
The good news for the corals is that the 2020–2021 Australian cyclone season was another ‘below average’ season, producing a total of eight tropical cyclones with just three of these categorised as severe.  This means last summer there was not only fewer cyclones, but they were less severe cyclones.  However, this trend will likely reverse – because the climate is always changing.

Much thanks to the Bureau for updating the chart to this year, to the 2020-2021 season. The data and report is here: http://www.bom.gov.au/cyclone/tropical-cyclone-knowledge-centre/history/climatology/

We end 2021 in eastern Australia, which borders to the western South Pacific, with reservoirs full of fresh water, beautiful corals just offshore, not to mention very high vaccination rates. Australians should be confident about the year ahead even if our Bureau of Meteorology keeps fudging an increasingly unreliable temperature record to falsely claim imminent catastrophe. I will be writing much more about this next year – in 2022.

Before finishing this last blog post to you all for the year, I would like to mention the late Christian Kerr and Rob McCulloch. The first a political journalist, the other a marlin fisherman – two very different men who were both such good friends to me.   We lost both this last year.

Christian Kerr would sometimes text or phone after I sent out one of my irregular e-newsletters; he would ask if he could republish something in The Spectator Australian Online. Consequently, he launched one of my most important papers, co-written with John Abbot, about using artificial intelligence to distinguish between natural and man-made global warming. It is the first of the papers listed below.

Living in Noosa I managed to escape much of the lockdown insanity that so affected Christian and many of my other friends and colleagues in Melbourne. Indeed, while much of Melbourne was house-bound, I went on a wonderful Great Barrier Reef adventure with Rob McCulloch all the way to Myrmidon Reef at the end of last year, and to Pixie Reef earlier this year. More recently I was diving Heron Reef.

Rob McCulloch and I planned the trip to Myrmidon in September 2020 in order to search for the monster corals. That was after one of his clients from Sydney cancelled because of a last-minute COVID-19 border closure. Rob was known as one of the best marlin fishermen in Australia. He is remembered in the short documentary Finding Porites, which is dedicated to his memory. You can watch it on YouTube, here.

Neither Christian Kerr nor Rob McCulloch waited for other people to do things for them, or to audit things for them. I will miss their courage and their kindness, but especially their enthusiasm for my work and my writings.

Thank you especially to the B. Macfie Family Foundation for continuing to fund my work through the Institute of Public Affairs.

John Roskam will step down as executive director of the IPA early in the New Year.   John backed me to set-off with Rob McCulloch on the little boat Kiama to find the monster corals and trusted me to edit the last two climate change books.   I will always be so grateful for these opportunities.

Best wishes to you for a happy Christmas and prosperous New Year. And remember, lost time is never found.

Corals fringing Heron Island, November 2021. Photo credit Stuart Ireland.

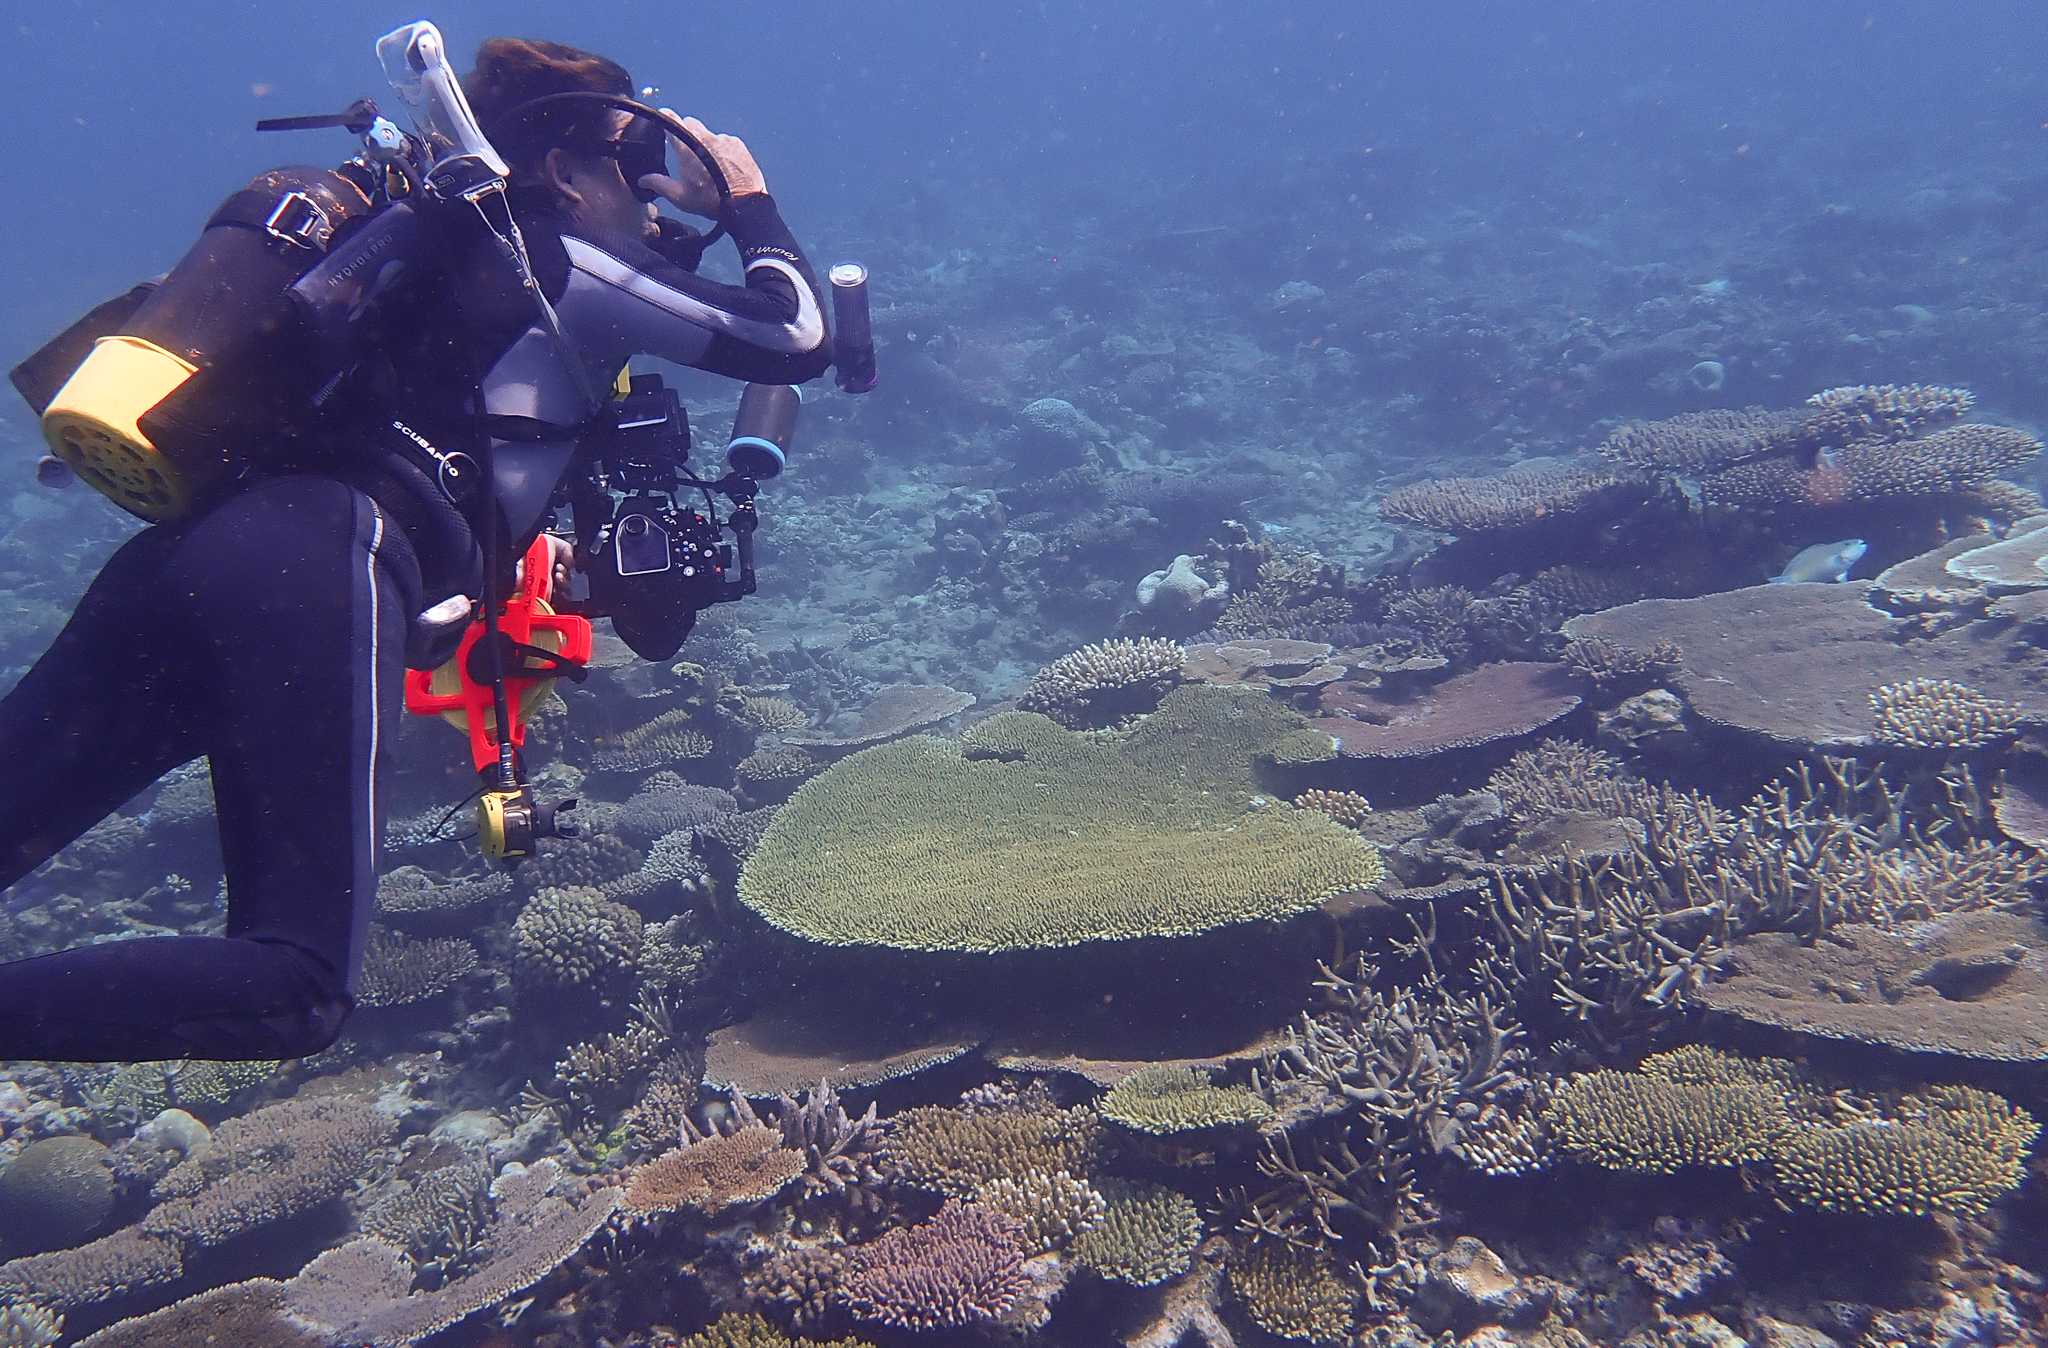
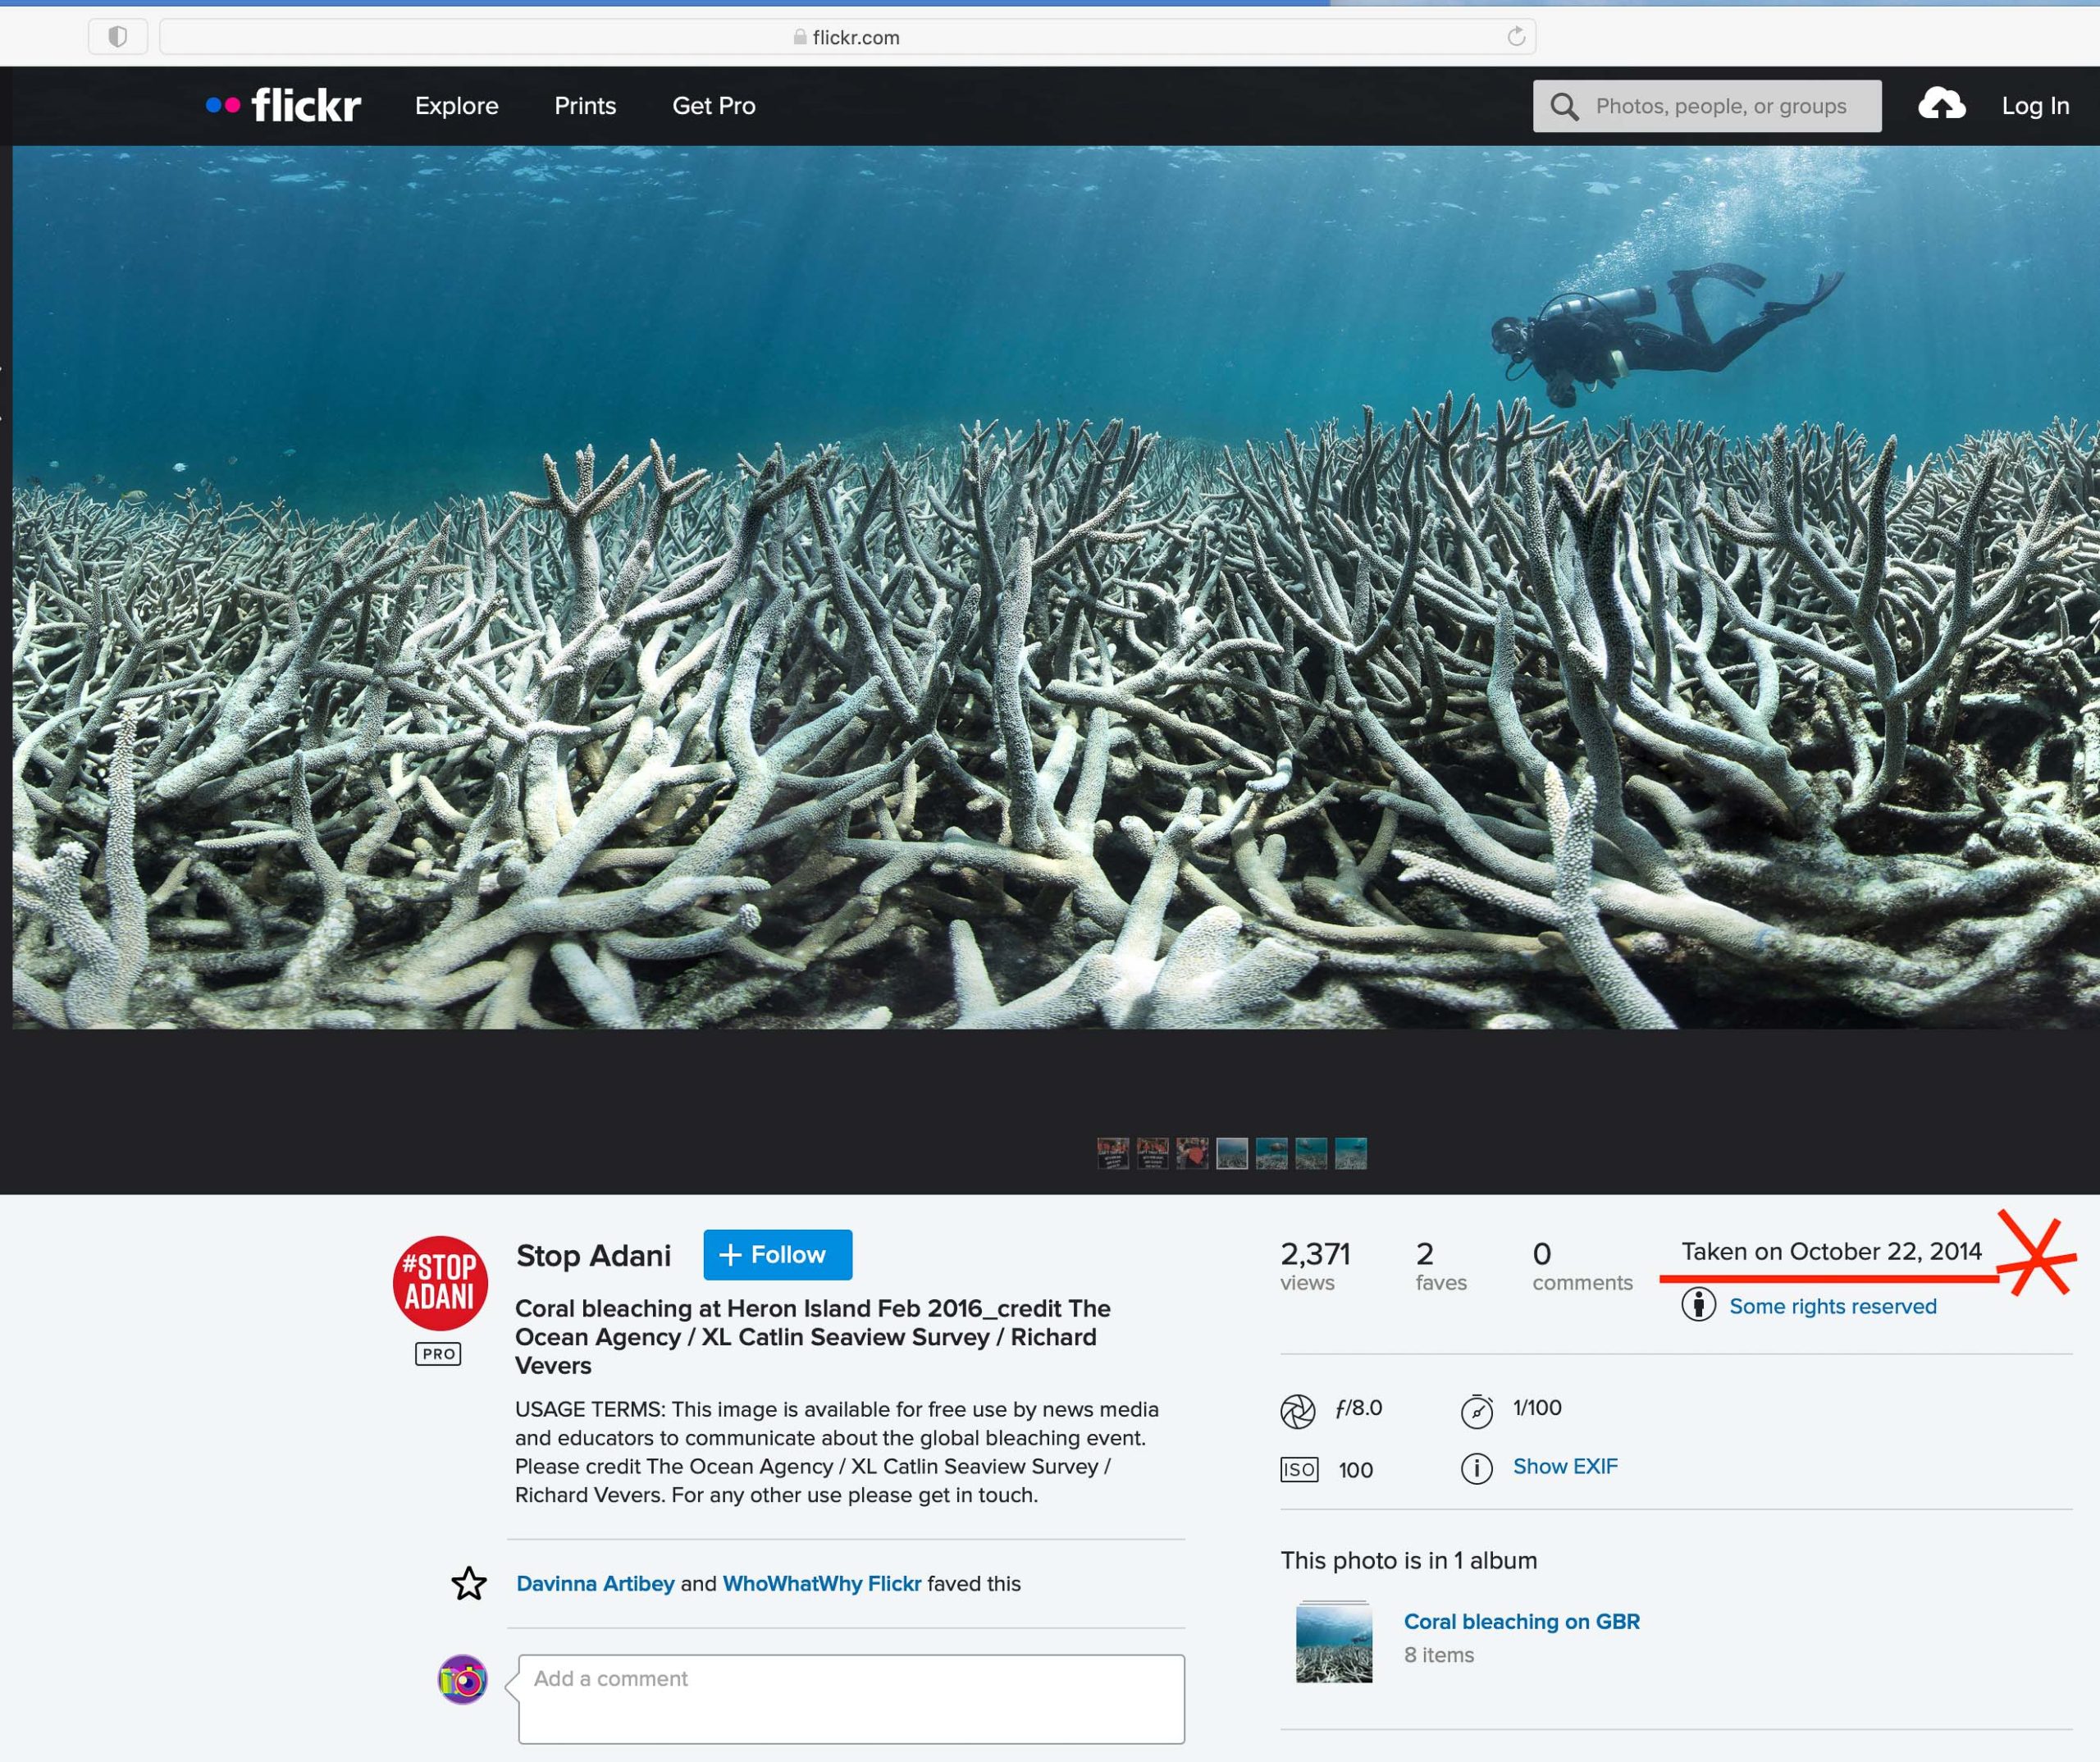
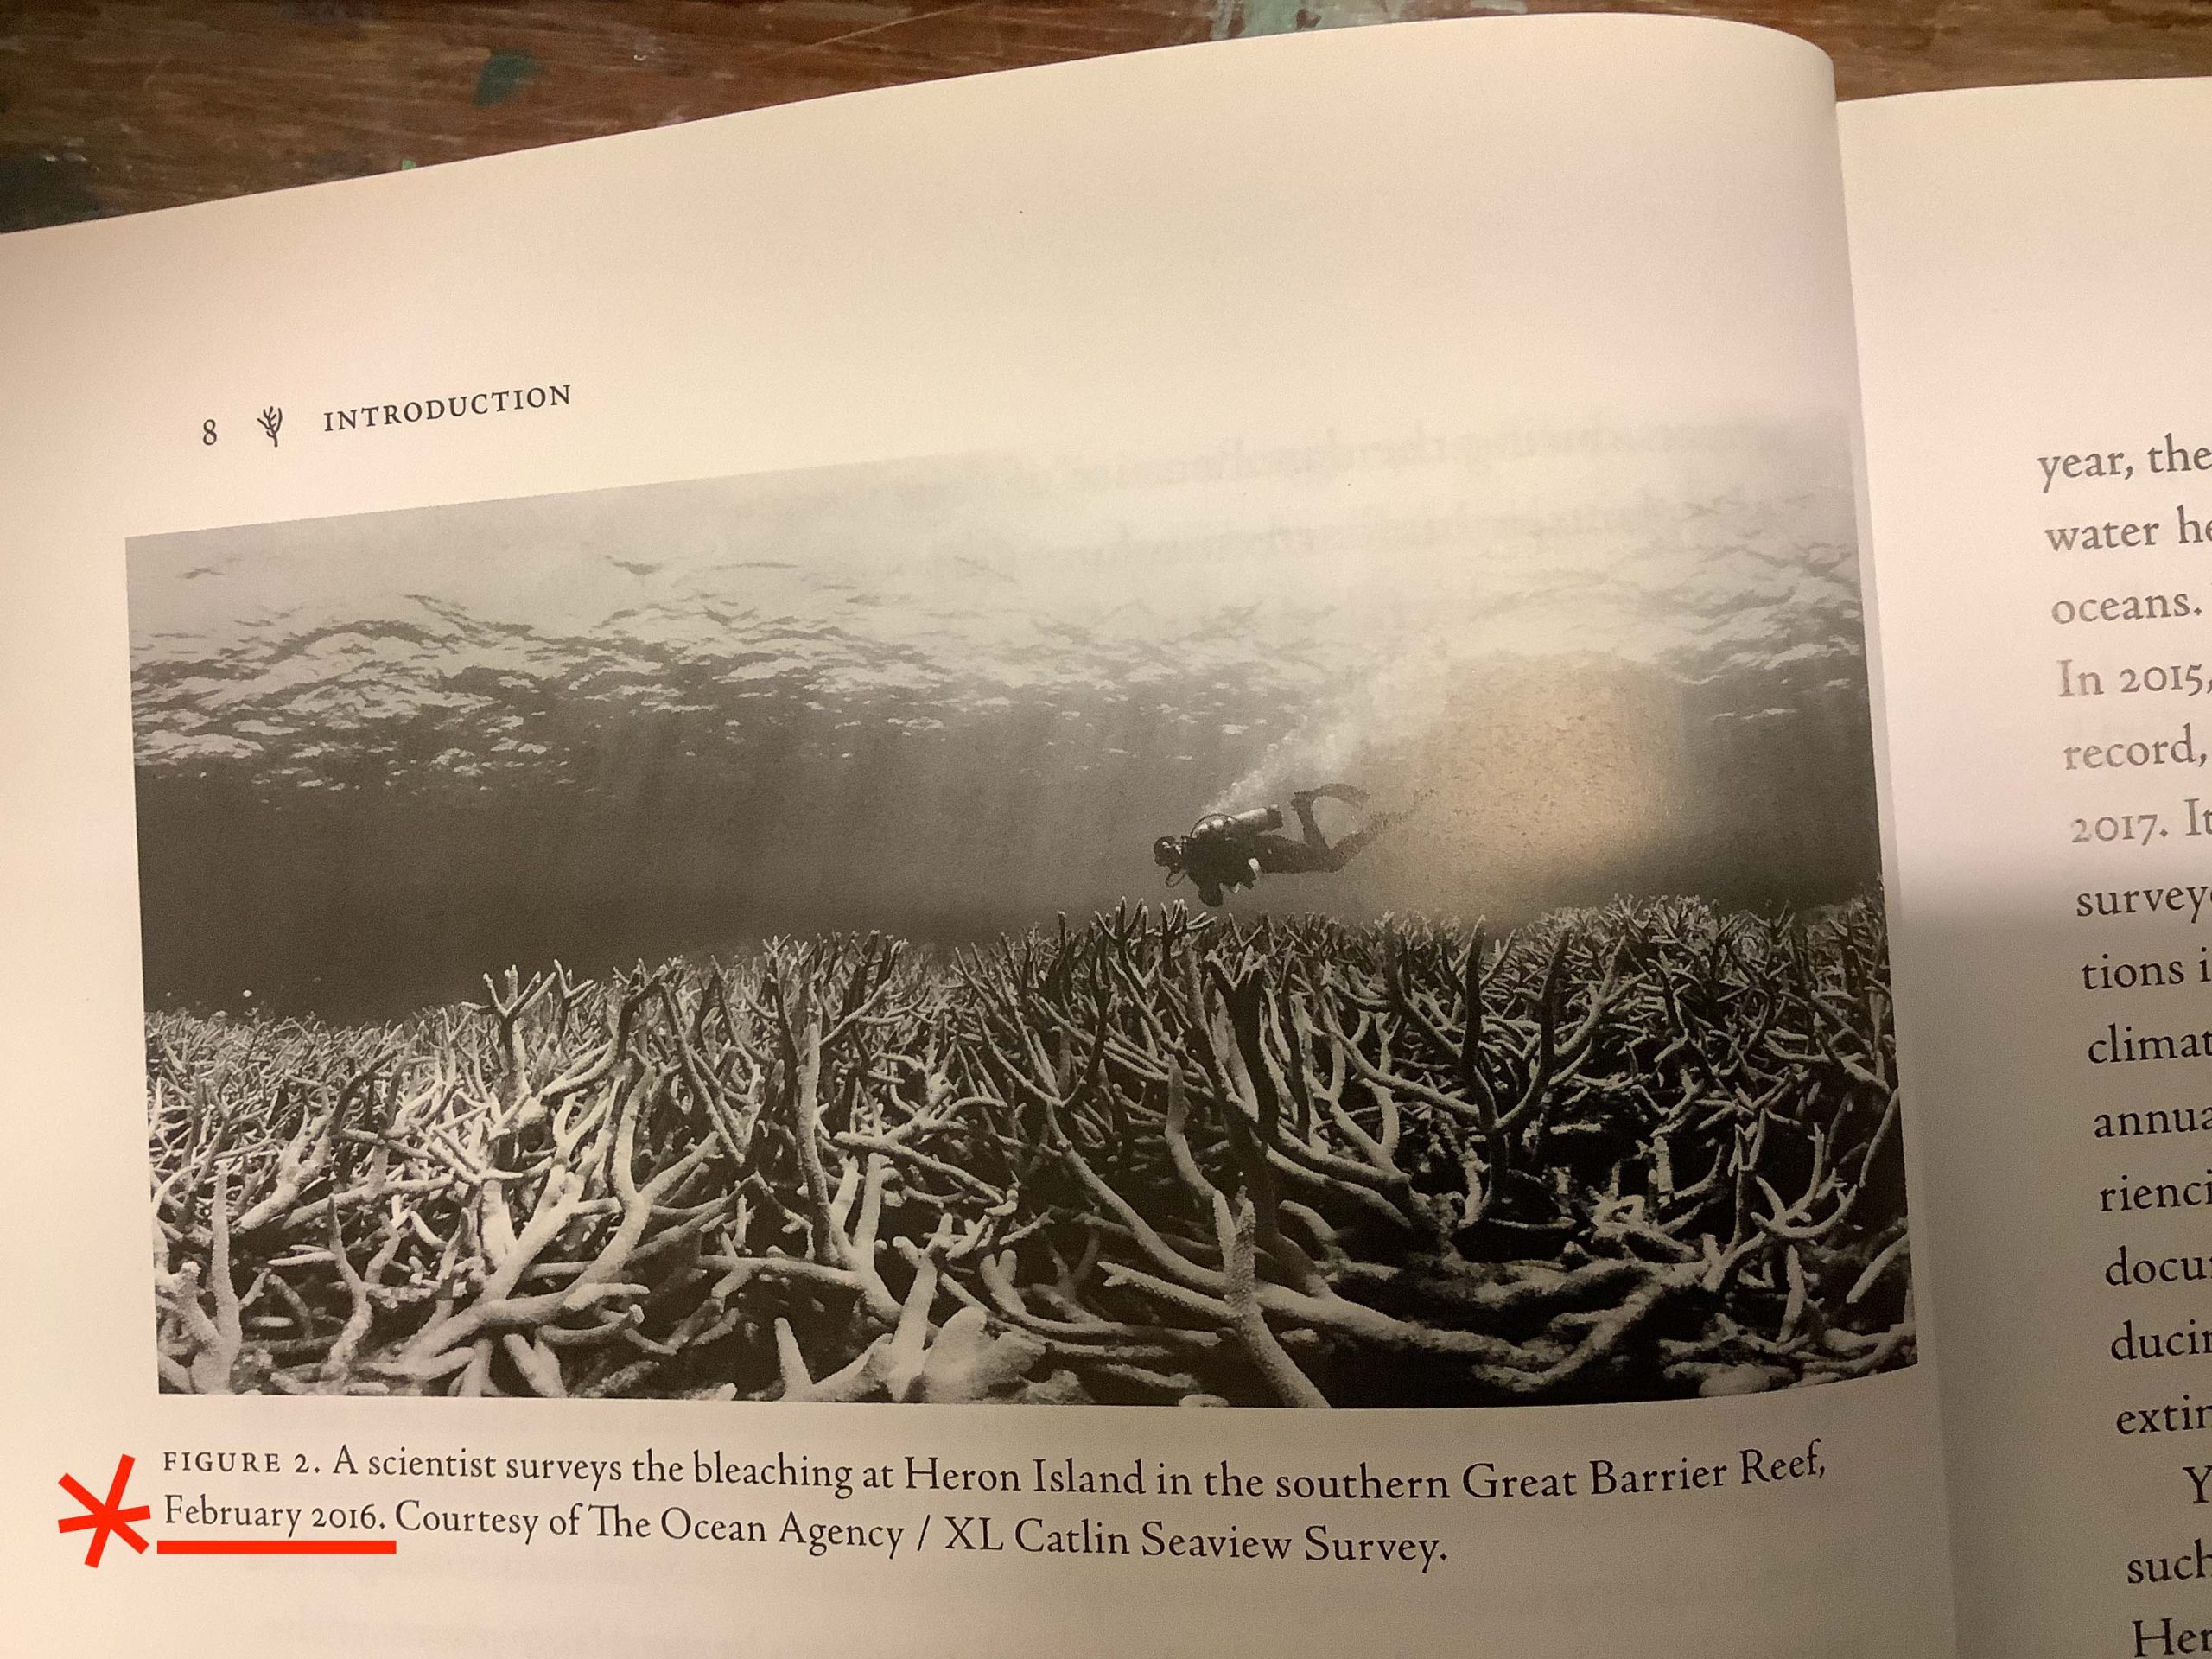
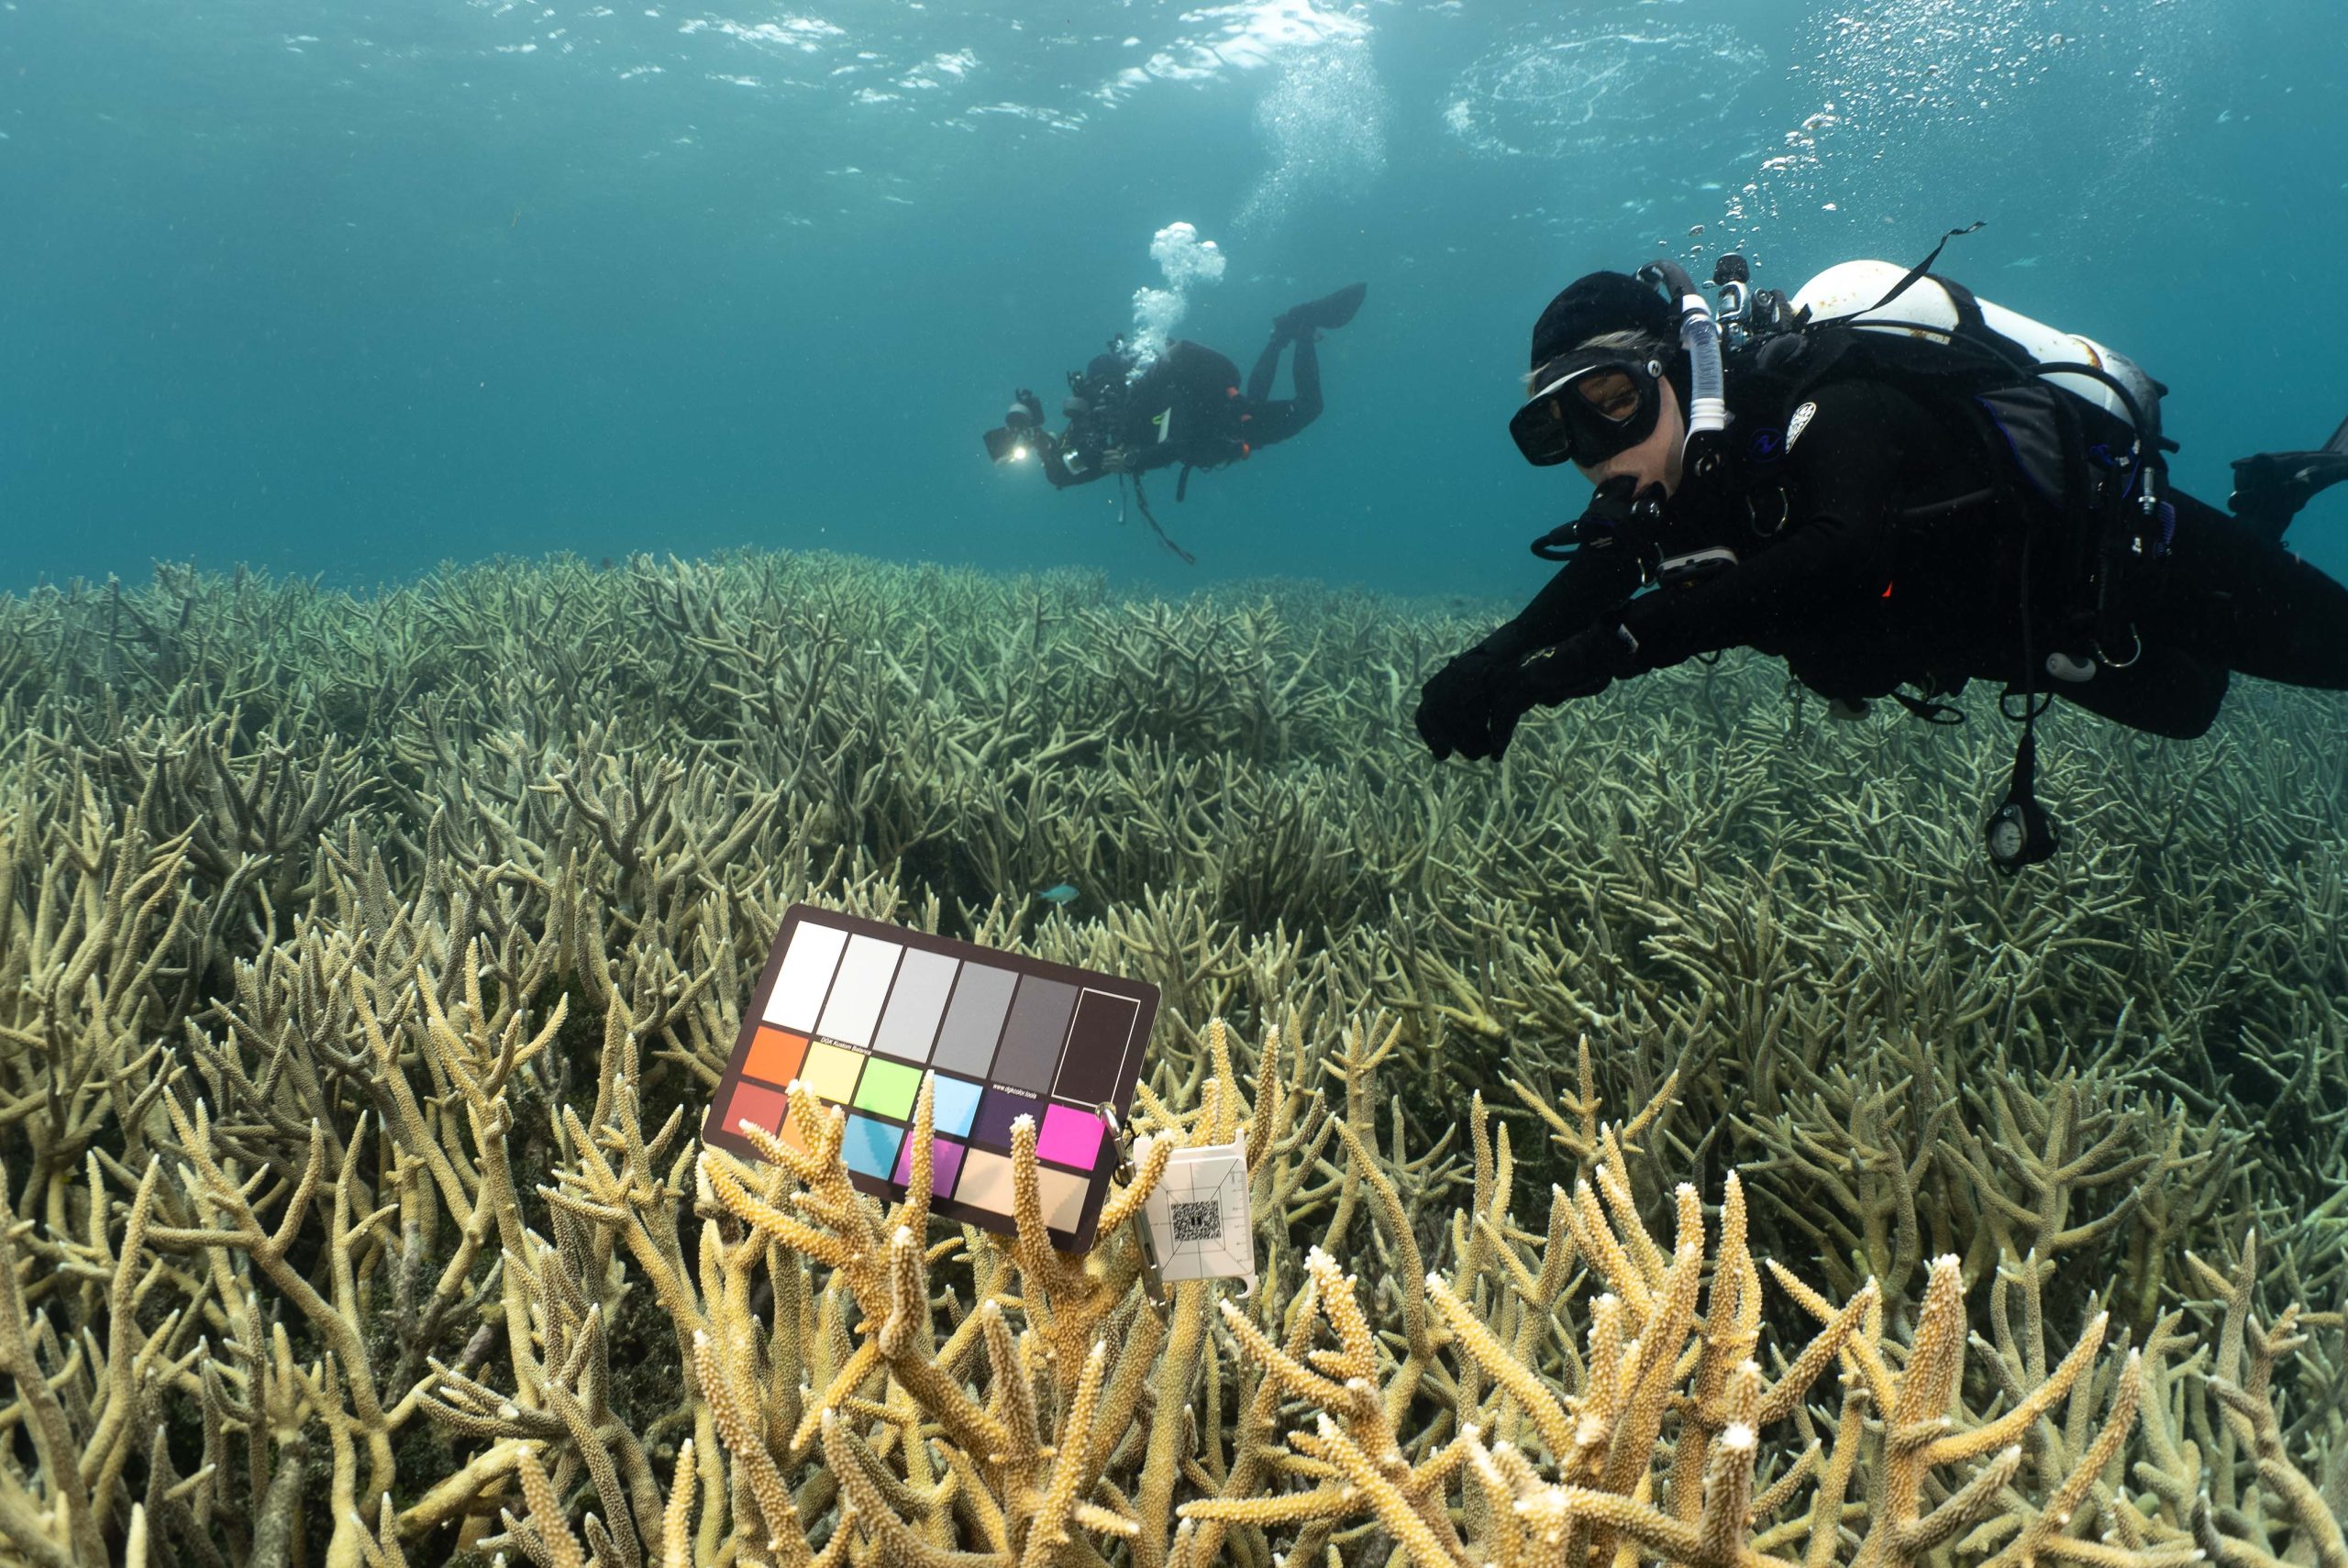
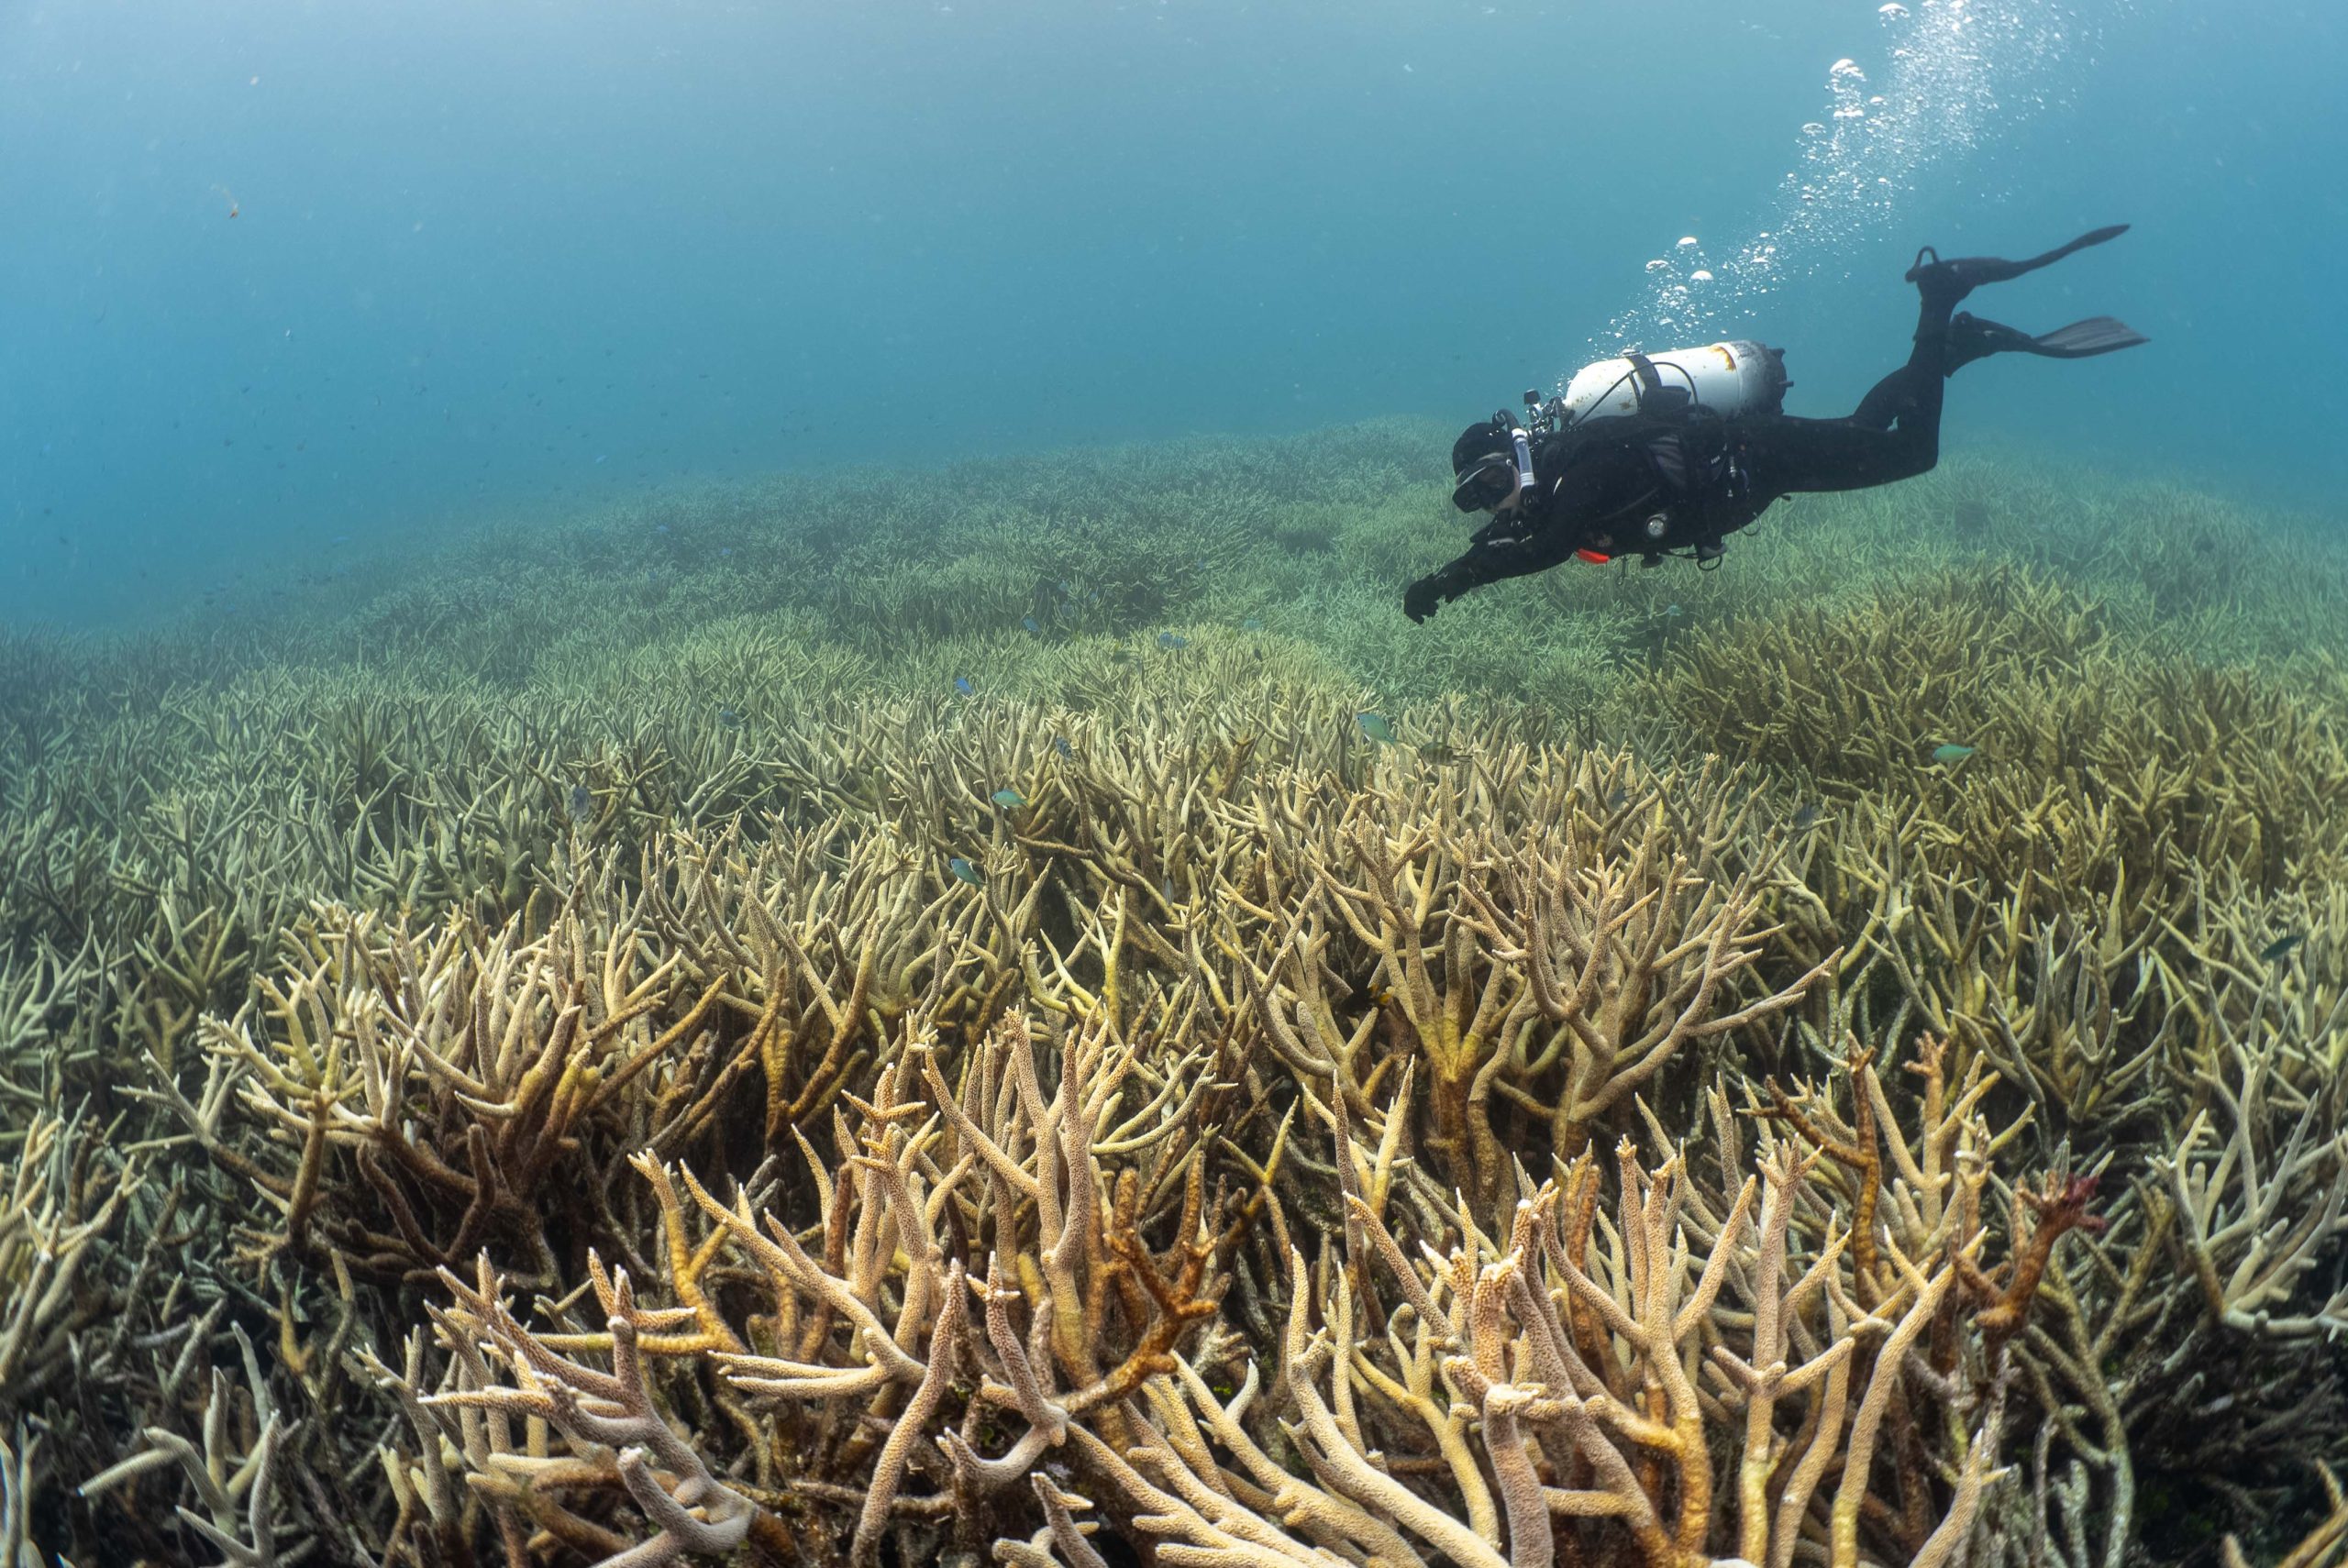
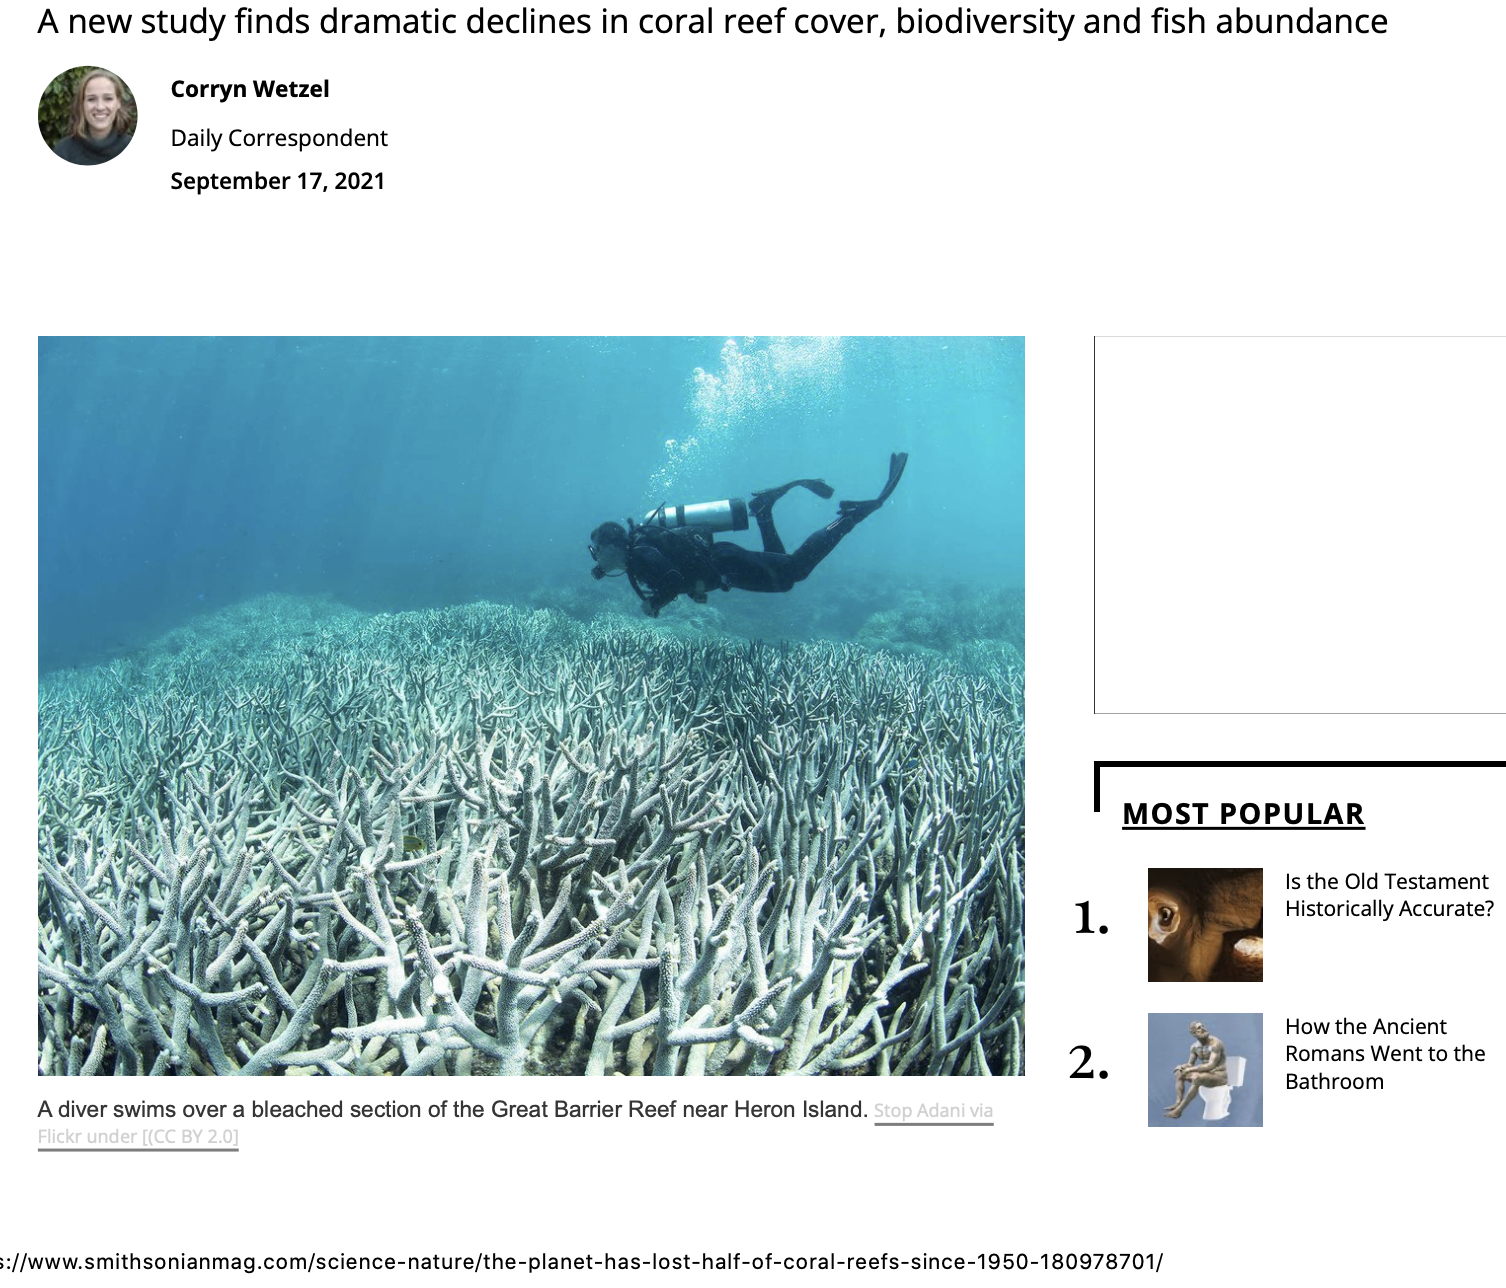
The photograph at the top is of me under-the-water offshore from Heron Island just a month ago. I’ve written a first blog post on the trip, here.  There will be more next year about Heron Island, and the need for some quality assurance of underwater photographs used as evidence of mass coral bleaching.

Key publications with John Abbot, 2012 to 2017

Abbot, J. & Marohasy J. 2017. The application of machine learning for evaluating anthropogenic versus natural climate change, GeoResJ, Volume 14, Pages 36-46. http://dx.doi.org/10.1016/j.gf.2017.08.001

Abbot, J. & Marohasy, J. 2017. Skilful rainfall forecasts from artificial neural networks with long duration series and single-month optimisation, Atmospheric Research, Volume 197, Pages 289-299. DOI10.1016/j.atmosres.2017.07.01

Abbot, J. & Marohasy, J. 2017. Forecasting extreme monthly rainfall events in regions of Queensland, Australia, using artificial neural networks. International Journal of Sustainable Development & Planning, Volume 12, Pages 1117-1131.DOI 10.2495/SDP-V12-N7-1117-1131.

Abbot, J. & Marohasy, J. 2017. Application of artificial neural networks to forecasting monthly rainfall one year in advance for locations within the Murray Darling Basin, Australia, International Journal of Sustainable Development & Planning. Volume 12, Pages 1282-1298. DOI 10.2495/SDP-V12-N8-1282-1298.

Abbot, J. & Marohasy, J. 2016. Forecasting monthly rainfall in the Bowen Basin of Queensland, Australia, using neural networks with Nino indices. In AI 2016: Advances in Artificial Intelligence, Eds. B.H. Kand & Q. Bai. DOI: 10.1007/978-3-319-50127-7_7.

Abbot, J. & Marohasy, J. 2016. Forecasting monthly rainfall in the Western Australian wheat-belt up to 18-months in advance using artificial neural networks. In AI 2016: Advances in Artificial Intelligence, Eds. B.H. Kand & Q. Bai. DOI: 10.1007/978-3-319-50127-7_6.

Marohasy, J. & Abbot J. 2016. Southeast Australian Maximum Temperature Trends, 1887–2013: An Evidence-Based Reappraisal. In Evidence-Based Climate Science (Second Edition), Ed. D. Easterbrook. Pages 83-99. http://dx.doi.org/10.1016/B978-0-12-804588-6.00005-7.

Marohasy, J. & Abbot, J. 2015. Assessing the quality of eight different maximum temperature time series as inputs when using artificial neural networks to forecast monthly rainfall at Cape Otway, Australia, Atmospheric Research, Volume 166, Pages 141-149. doi: 10.1016/j.atmosres.2015.06.025.

Abbot J. & Marohasy J. 2015. Using artificial intelligence to forecast monthly rainfall under present and future climates for the Bowen Basin, Queensland, Australia, International Journal of Sustainable Development and Planning, Volume 10, Issue 1, Pages 66 – 75. DOI: 10.2495/SDP-V10-N1-66-75.

Abbot J. & Marohasy J. 2015. Using lagged and forecast climate indices with artificial intelligence to predict monthly rainfall in the Brisbane Catchment, Queensland, Australia, International Journal of Sustainable Development and Planning. Volume 10, Issue 1, Pages 29-41.

Abbot J. & Marohasy J., 2015. Improving monthly rainfall forecasts using artificial neural networks and single-month optimisation in the Brisbane Catchment, Queensland, Australia. WIT Transactions on Ecology and the Environment, 196: 3-13.

Abbot J. & Marohasy J., 2015. Forecasting of monthly rainfall in the Murray Darling Basin, Australia: Miles as a case study. WIT Transactions on Ecology and the Environment, 197: 149-159.

Abbot J. & Marohasy J. 2014. Input selection and optimisation for monthly rainfall forecasting in Queensland, Australia, using artificial neural networks. Atmospheric Research, Volume 138, Pages 166-178.

Abbot J. & Marohasy J. 2013. The application of artificial intelligence for monthly rainfall forecasting in the Brisbane Catchment, Queensland, Australia. River Basin Management VII. WIT Press. Editor C.A. Brebbia. Pages 125-135.

Abbot J. & Marohasy J. 2013. The potential benefits of using artificial intelligence for monthly rainfall forecasting for the Bowen Basin, Queensland, Australia. Water Resources Management VII. WIT Press. Editor C.A. Brebbia. Pages 287-297.

Abbot J., & J. Marohasy, 2012. Application of artificial neural networks to rainfall forecasting in Queensland, Australia. Advances in Atmospheric Sciences, Volume 29, Number 4, Pages 717-730. doi: 10.1007/s00376-012-1259-9.

Crown-of-thorn starfish, Heron Reef, 10th November 2021. Photo credit Stuart Ireland.

Filed Under: Community

Christian Kerr – Hilarious, Insightful and Now Gone

December 3, 2021 By jennifer

He liked people, but he took no one too seriously.   He thought most of the reporting on catastrophic climate change absurd.  For a time, he would text me asking if he could republish my latest blog post.  That was when he was the online editor for Flat White where short articles, and gossip from Australia politics is published under The Spectator Australia banner.

The most successful of the pieces he republished from me was ‘Big Data Finds the Medieval Warm Period – No Denial Here.’

It begins:

According to author Leo Tolstoy, born at the very end of the Little Ice Age, in quite a cold country:  ‘The most difficult subjects can be explained to the most slow-witted man if he has not formed any idea of them already; but the simplest thing cannot be made clear to the most intelligent man if he is firmly persuaded that he already knows, without a shadow of a doubt, what is laid before him.’

So, our new technical paper in GeoResJ (vol. 14, pages 36-46) will likely be ignored.  Because after applying the latest big data technique to six 2,000 year-long proxy-temperature series we cannot confirm that recent warming is anything but natural – what might have occurred anyway, even if there was no industrial revolution.

A lesser editor might have tried to remove all the qualifiers in that last long sentence: because, after, cannot, anything, anyway, but, even if there was not.

Not Christian.  He was laughing with me.

Big data finds the Medieval Warm Period – no denial here

He told me it was the most viewed article at Flat White that year – in 2017.

The last time we spoke, and laughed, was August.  I was in Adelaide trying to work out how to get back to Queensland as the border had just closed to me.  He was in Melbourne trying to work out how to get to his father’s funeral in Adelaide.  If it wasn’t for covid we would have meetup in Adelaide and had a meal together. Instead, he arrived and went straight into quarantine.   I know it was an awful, awful experience for him.

Now he’s dead, at just 56.

He was unwell, and immune compromised, these last few years.  But he never elaborated.  When he wanted to change the subject, it was always to his children.  He adored them both: Rupert and India.   I can’t image their grief.

Christian Kerr was most famous back more than a decade when he was writing under the pseudonym of Hillary Bray for Crikey.com.   They have several articles about him today, including comment from Susan Brown that:

Christian was complex; he was not always right or easy, but was always in public a fearless contrarian. He set a fire in Australian politics and created a form of accountability which lit up many dark corners. He had more self-doubt than many realised. He loved his kids with a heart and pride the size of the universe. He had brilliant taste in music. He had a deep humanity and he suffered a lot for his intelligence, hunger for knowledge and strong values.

When he was suffering a lot physically, I wrote to him in 2019 to say I was going to Lourdes. I said I was an imperfect vessel being an atheist, but knowing he was a very devout Catholic asked if he would like me to say a prayer for him. He came back with: “Would appreciate that very much Susan. Just three key words, please. If I could be granted health, strength and wisdom.”

Vale Christian Kerr.

Filed Under: Uncategorized

Wet Summers During La Niña Cycles

November 25, 2021 By jennifer

Last night I was very briefly on Sky Television, and we were reminded by Andrew Bolt that Professor Tim Flannery once said the dams would never fill again.   Back in 2009 we were told to expect drought as the new norm here in Australia because of climate change.

That was when we had El Niño drought conditions, meaning the trade winds were weak and more rain fell on the ocean than could make it to the Australian mainland.  But, of course, the conditions changed – as they always do, because there are cycles – and what is known as a La Niña developed.  It was a very strong La Niña by the end of 2010 with an SOI value of +27.1 for December.

The dams along the east coast of Australia did fill suddenly with the change in the cycle to one of wet from one of dry.  To the extent that the city of Brisbane was flooded – with more than 20,000 homes inundated – after SEQ Water was forced to make emergency releases of water from Wivenhoe dam in January 2011!  SEQ Water had mistakenly kept the dam full of water through December, even though the dam was built for flood mitigation – to catch the water should there be torrential rain.  There was no reason for Brisbane to have flooded, except they got the seasonal forecast so wrong along with the dam management.  They weren’t thinking in terms of cycles – they never do.

Wivenhoe dam was built following the terrible 1974 inundation of Brisbane when more than 6,000 homes were flooded following torrential rains following Cyclone Wanda.  That was also a La Niña year with the SOI index at +31.6 in November 1973.

As the air pressure gradient cycles, as measured but the SOI Index, so we experience periods of dry followed by wet along the east coast of Australia.   This interactive table can be found at The Australian Bureau of Meteorology website.

The SOI index is the difference in air pressure between Tahiti and Darwin.

When there are strong pressure gradients, we have stronger than usual trade winds drawing moist air from the Pacific Ocean all the way to the Australian mainland.  When the winds are not so strong, and especially during El Niño conditions when they are weak, it is more likely to rain over the ocean with the storm clouds and cyclones not making it as far as the Australian east coast. Then we risk drought here in Australia.

We can see cycles of La Niña and El Niño in the air pressure data that goes right back to 1876 as measured between Darwin and Tahiti.    Indeed, Australia is a land of drought or flooding rains because of these cycles.

Except that David Jones, and other activists, hold such key positions at the Australian Bureau of Meteorology and have for so long, and they refuse to acknowledge the strength of the cycles because they are so wedded to the theory of catastrophic climate change and the idea that there are tipping points when there are just cycles.   They brief Tim Flannery who is really just one of the useful idiots.   Andrew Bolt shouldn’t really be so upset by him!  It is the Bureau that has the potential to deliver much better forecasts, but that would require them to recognise there are cycles that persist and give up on the notion of a climate catastrophe.

John Abbot and I went to the Bureau to talk with them, specifically with Oscar Alves, back in August 2011 about the potential of Artificial Neural Networks (a form of machine learning/artificial intelligence) for more reliable seasonal rainfall forecasting.   We used the SOI index as a key input, and have detailed our technique in a series of published papers.

****

The feature photograph at the very top of this blog post was taken outside our unit in St Lucia Brisbane after the apartment block was flooded in January 2011.  It was quite a job, the cleanup.

Filed Under: Information Tagged With: Rainfall forecasting

Heron Island Photo Check

November 24, 2021 By jennifer

I am seeking feedback, including comment and corrections, on this draft blog post. I have previously sent an email to Richard Vevers (1 October 2021) and placed a request for more information at the Catlin Survey website (20 April 2021), without receiving any response from either. Irus Braverman was kind enough to reply to my email (30 September 2021) indicating that the photograph used in her book Coral Whisperers was provided to her by Richard Vevers. 

If all science is either ‘physics’ or ‘stamp collecting’ as once suggested by Ernest Rutherford, I would argue that it is important that we not knowingly distribute fakes. 

Corals Healthy, Photograph Bleached – Draft 

Does it matter if the Internet is replete with fake photographs accompanying fake stories? Does it matter that these photographs keep children awake at night – worrying about climate change and the impending doom of our Great Barrier Reef? 

There is a photograph that has been promoted by Richard Vevers, the founder, and CEO of The Ocean Agency, a Washington-based international not-for-profit that is purportedly dedicated to marine conservation. It is described on his The Ocean Agency website as having been taken at Heron Island in 2015. On Flickr, the same photograph is described as having been taken in 2014, and in Irus Braverman’s book Coral Whisperers as having been taken in 2016. 

Screenshot from The Ocean Agency Website.  The red asterisk has been added by me, to draw attention to the date as indicated at this website.
Screen shot from Flickr website. Red underline added to draw attention to the date.
Photograph from Irus Braverman’s book. Red underline added, to draw attention to the date.

At least two of these photographs must be incorrectly labelled. 

It is the prestige associated with the XL Catlin Seaview Survey – touted as ‘the largest survey of the Great Barrier Reef ever undertaken’, ‘using unique SVII underwater camera systems’ and which commenced back in 2012 – that has given the photograph credibility.

The XL Catlin Seaview Survey was undertaken by The University of Queensland in partnership with Google, the International Union for the Conservation of Nature (IUCN), the United Nation’s Education, Scientific and Cultural Organisation (UNESCO), the United States’ National Oceanic and Atmospheric Administration (NOAA), and others. The expedition visited Heron Island on 4 November 2012. The photographs from this survey can be viewed online, but this photograph is not among them. 

According to the survey’s website, the XL Catlin returned to the Great Barrier Reef in 2014 following cyclone Ita, and again in 2016 following a mass coral bleaching. However, none of the 226,000 georeferenced coral reef survey images are publicly available from these expeditions.  

According to a different survey, which was an aerial survey undertaken in 2016 by Terry Hughes from James Cook University, it was mostly the northern section of the Great Barrier Reef that bleached in that year; however, Heron Reef, which is part of the southern Great Barrier Reef, did not bleach at all at that time.  

In fact, the photograph was almost certainly taken on 22 October 2014, and it is not coral bleaching that is being seen. I hypothesise that the corals appear bleached because the photograph has been taken through layers of water that absorb light in the red spectrum and/or because some of the colour has been stripped from the photograph in post-production. Either way, it is not fit for purpose; it cannot credibly be presented as evidence of coral bleaching at the Great Barrier Reef in 2016.

Vever’s organisation has the official endorsement of the United Nation’s Ocean Decade, and the photograph may have been promoted by him ostensibly to support ocean science and conservation, and as evidence of bleaching at Heron Island in 2016. But this doesn’t make the image a true likeness. In fact, the photograph fits all the criteria of being a fake. I believe it does not show coral bleaching and there was no mass coral bleaching at Heron Island in 2016, or in 2015 or 2014.

I visited Heron Island earlier this month (November 2021) with underwater photographers Stuart Ireland and Leonard Lim. There we found the fringing reef to be healthy, including the fields of staghorn coral. We didn’t have the ‘unique SVII underwater camera systems’, nor the endorsement and sponsorship of a university, or Google, or the United Nations, but I did have the sense to place a colour chart among the corals to facilitate correct white colour balance in post-production.  

Jen Marohasy (foreground) and Leonard Lim (background) with a colour chart above the fields of staghorn coral, Heron Reef, 9 November 2021.  Photo credit Stuart Ireland.
Jen Marohasy above the fields of staghorn corals, Heron Reef, 9 November 2021. Photo credit Stuart Ireland.

It is evident from our photographs, with the colour chart providing some quality assurance, that the fields of staghorn corals at Heron Island are not bleached – not this year anyway. Maybe next? 

Yet the XL Catlin Survey and Richard Vevers, via the Flickr website, continue to perpetuate the myth that they are bleached – most recently in the pages of the prestigious Smithsonian magazine.

Surely the children of the world deserve to know the truth about Heron Reef’s corals. 

The Smithsonian Institute is the world’s largest museum, education and research complex. But it seems they don’t have much of a process for quality control of the information in their magazine.
Screen shot. This photograph has been published and republished, including by the Sydney Morning Herald in April 2021.

*****

Tues. 30th November 2021

– A Note from Arthur Day

Dear Jen, 

Inspired by your request for help I offer the following:

Firstly, I used the uncorrected (white balance not corrected) native image you sent me the other day as one reference and adjusted the ‘fake image’ to match it.

Close-up showing the diver and also coral in the Ocean Agency image after the full image was colour corrected by Arthur Day.  To be clear, the colour correction was done to the entire image, and it was possible to restore the original colours by ‘reverse bleaching’.

That was EASY and did not require anything more of an adjustment than a global whole-of-image change, much the same as doing a simple white balance adjustment but this time mainly increasing the saturation and warming the colour temperature.

Secondly, I then selected two corresponding sets of detailed images from the before (fake) and after (adjusted) images to compare the corals with your unadjusted image (emailed to me).

The image that I emailed to Arthur before Leo undertook the colour correction using the colour chart.

The corals are definitely not dead.  And, furthermore, allowing the possibility it was more sunny or shallower water when they took their shot, I think those details demonstrate a pretty-close match to your uncorrected ‘beige shot’ if also viewed in equivalent detail. Now, for additional confirmation they have faked the bleaching, contrast the diver’s yellow belt in my corrected images with the image as published by Ocean Agency and Flickr.

In summary:

1. The coral in that fiddled/fake image is definitely still alive.

2. It is important to observe that all (or much) of the original colour information remains in that altered image. It has just been greatly suppressed (‘washed out’) when the image was manipulated.

3. It should therefore be possible to restore the original colours by reversing the adjustment that washed them out. That is, at least to a large degree, it should be possible to restore the original colours.  As I have done.

4. When we do that, it becomes apparent that this coral was alive and unbleached when the photograph was taken.

Regards Arthur

****

And so ‘Arthur’s image’ has become the feature image at the very top of this blog post.

Filed Under: Information Tagged With: Great Barrier Reef

If the South Pole Melted, A Note from Arthur

November 21, 2021 By jennifer

Over the last few decades there has been an overall decrease in the amount of ice at the North Pole, and an increase in the amount of ice at the South Pole. Should all the remaining ice melt at the North Pole it will have hardly any effect on global sea levels because it is sea ice not land ice.  Should all the ice melt at the South Pole, well this could cause global sea levels to rise by quite a bit.

I wrote something along these lines during that Glasgow talkfest. I received various emails telling me that it was not the sea ice I should be concerned about, but rather the glaciers.

There are some very large glaciers at the South Pole.  For a time there was concern about the Pine Island Glacier, but then it stabilised.  Then there is the Thwaites Glacier.  It is about the size of Britain, and melting.

I got chatting with my friend Arthur Day about this glacier, asking him whether we should be concerned, and he explained:

By far the main glacier of concern is the Thwaites glacier and its ‘rapidly’ thinning ice shelf.

This enormous glacier, described in the mainstream media as ‘the world’s most terrifying glacier’, is about the size of Britain. It is one of the largest glaciers on Earth. It has recently gained notoriety because it is currently undergoing a phase of relatively rapid flow into the sea. There is a fear that the faster flow is the beginning of an ‘irreversible collapse’ that will eventually contribute a ‘devastating amount’ of meltwater to sea level rise. Fuelling this fear is the knowledge that the glacier feeds a marine ice sheet where almost all of the basement supporting it is well below sea level, potentially making it unstable. Currently it is believed this glacier alone could already be contributing about 4% to global sea level rise.

If its ice shelf is weakened from beneath due to melting by ‘warm’ sea water, then it could lead to destabilisation of the main glacier behind, making it flow into the sea much faster than otherwise. This in turn could contribute to a faster rate of sea-level rise. While there is a lot of concern about this, there is no actual evidence it is anything more than a natural process. The glacier flows into the Amundsen Sea along the West-facing coastline of the Antarctic Peninsula and, today, its movement can be easily measured. However, just because it has been possible to easily measure the flow of the glacier over the few decades since the satellite era began in 1979, it cannot be claimed that ‘fast’ glacier flow is a ‘new’ phenomenon and, therefore, ‘unprecedented’. Glacier flow and ice shelf melting needs to be assessed from a much longer-term historical perspective with one eye on what glaciology teaches us about the complex dynamics of ice flow. For example, glaciers can start and stop moving again for no apparent reason, as has recently been demonstrated by the sudden stabilisation of the Pine Island Glacier.

In January 2020, an expedition by the US-UK International Thwaites Glacier Collaboration melted a 30 cm wide and 600-metre-deep hole through the floating ice shelf in front of the Thwaites glacier. For the first time they were able to directly measure the temperature of the ‘warm’ sea water right at the point where the ice meets the sea. The water temperature was 2°C. But this is just one measurement. A single temperature snapshot in time and place does not constitute a trend!

The seawater beneath the ice shelves is linked to an upwelling of ‘warm’ circumpolar deep water carried on an offshoot of the Antarctic Circumpolar Current. This is the strongest and most important ocean current on Earth. It is the only current linking all the major oceans. It flows around the Antarctic continent from west to east, at least in part whipped along by the drag from the strong westerly winds that blow around the polar regions. It is estimated that this current transports somewhere between 100 and 150 million cubic metres of heat-carrying sea water per second. Without the Antarctic Circumpolar Current, and its impact on planetary heat redistribution, the global climate would be very different. One of the curiosities about the Southern Ocean is that the deep water circulating Antarctica, the ‘Circumpolar Deep Water’ and the ‘Antarctic Bottom Water’ circulations, are warmer than at the surface. This happens because the deep water is also more saline, making it denser despite its higher temperature.

The Southern Ocean is a critical component of the global climate system because it is a key region for the upwelling of deep ocean waters to the surface. These upwelling waters are very old and have not been to the surface of the ocean for centuries or even millennia. It means that this water has not interacted with the atmosphere since well before the industrial era, certainly not since any human impacts on the atmosphere due to increasing CO2 were even possible. These upwelling waters bring heat to the shallower seas of the Antarctic continental shelves. When an offshoot of this current emerges along the western coastline of the Antarctic Peninsula, it can find its way to shallower depths and interact with the ice shelves in front of marine-terminating glaciers such as the Thwaites Glacier. Assisted by the prevailing westerly winds, enough heat can be transported to locally warm the climate of West Antarctica, so this current has potential consequences for the marine-terminating glaciers and the stability of the West Antarctic Ice Sheet. If the current or the assisting winds change, then the local climate can change. In fact, careful analyses suggest the strength of the upwelling and the associated currents experience significant inter-decadal variability, perhaps driven by changes in the westerly wind patterns.

What really counts in terms of judging human impacts on this natural process is whether any mooted acceleration in melting at the ice shelves can be attributed to human activity, or not. Are any short-term changes, such as they are, simply a function of natural variability in the temperature, speed, and distance at which the ‘warm’ currents pass along the coastline, or are they ‘unprecedented’ changes that lie outside the range of natural variability? It remains entirely unclear how the circulation of circumpolar deep water might change in the future. If the cause of changes in circulation is unknown, then changes could simply be random and a function of entirely self-contained ‘internal’ natural variability in the flow of the current. Imagine for a moment the flow of water in a turbulent stream. Watching closely, does the water always follow exactly the same path past any point? Ocean currents are the same but they operate on vastly greater scales over much longer time frames. In climate science, natural internal climate variability is a well-established fact. It is most pronounced at the local scale within individual climatic regions. The volatile climate of polar regions like West Antarctica is a good example.

In any case, the combined amount of ice in the affected ice shelves is only a fraction of the total amount of shelf ice that fringes the rest of the Antarctic continent. The threat that ice shelf thinning poses to the stability of the glaciers behind them is the subject of extremely challenging computer modelling. Theoretical understanding is still incomplete and there are not enough measurements in the critical areas. While of concern and worthy of monitoring, because the Thwaites Glacier behind the ice shelf is ‘the size of Britain’, should a ‘collapse’ commence at some time in the coming centuries then it would still take many thousands of years to unfold. That is because a glacier this size cannot simply ‘collapse’. It is just too big for that to occur. Geological studies of past events over the last million years show that the transition between glacial, intermediate, and collapsed states takes one to several thousand years. This is an entirely natural process, but it hasn’t stopped the Thwaites being dubbed the ‘doomsday glacier’ in headline-grabbing news articles such as one by the BBC entitled ‘Antartctica melting: Climate change and the journey to the doomsday glacier’, which is an impression cemented into folklore by many similar articles.

There is an extensive body of scientific literature that documents the past geological and climate history of West Antarctica. It documents a multi-thousand-year record of entirely natural climate volatility. This record is stored in both the offshore sediments, beneath the ice shelves, and within the ice sheet itself. The geology shows there is no evidence that current-day natural swings in climate along the West Antarctic coastline are in any way unprecedented. The ice sheet has undergone multiple massive volume changes over just the last million years alone in response to the global ‘ice age’ glaciation cycles. At times, parts of the West Antarctic Ice Sheet have disappeared almost entirely, along with its associated massive Ross and Ronne-Filchner ice shelves which combined are hundreds of times more massive than the Thwaites ice shelf. But each time, the ice has returned and, ten thousand years ago, the ice sheet on the Marie Byrd Land coast in West Antarctica was actually more than 700 m thicker than today.

These ice sheet cycles have been repeating for millions of years and therefore any current thinning of the ice beneath the ice shelves cannot simply be attributed to human activity, just because we now have the technology to measure it.”

But Arthur, they are!   By those who have no concept of our climate history, or of how much ice there is in Antarctica.

My friend Stuart Ireland scuba dove under Antarctica a few years ago and made a little video about it. I’ve taken a clip from this for the feature image and adjusted the tone curve on it to make him look colder.  Stuart told me that one of the most painful things he has ever experienced is defrosting his fingers after staying in the water with the sea lions for so long.  He did get some brilliant footage.

There is a whole section in my book ‘Climate Change: The Facts 2020’ about Antarctica including a chapter about volcanoes by Arthur.

Filed Under: Information Tagged With: Antarctica

Cyclones Downs, Corals Up – Except in Glasgow

November 4, 2021 By jennifer

It is impossible to reconcile the official statistics and what is under-the-water with the media reporting – including the reporting from Glasgow. There are meant to be more cyclones and less coral, but we have quite the reverse according to the official statistics. It is also making no sense that those who purport to care so much about the Great Barrier Reef still haven’t visited it. Then there are those who have visited it once, and then there are those who have visited it but never actually got in the water. Some of them are in Glasgow.

It was not for nothing that former Australian Prime Minister Malcolm Turnbull – he apparently visited Magnetic Island some years ago but never got in the water – approved a A$443 million grant to the tiny Great Barrier Reef Foundation. As far as I can tell it is paid out in little bits to all those in proximity who are prepared to lament how the corals are dying. I’ve meet so many who have received something, and so the useful idiots are paid off by the special people now in Glasgow.

On the eve of Glasgow, the same foundation put out comment:

Insufficient global action on climate change is taking a serious toll on the health of our Great Barrier Reef and coral reefs around the world. The facts are clear – coral reefs and their communities are on the front line. We know current climate change commitments don’t go far enough to protect them and we know this is the critical decade in which to act with urgency. Next month’s UN Climate Change Conference – COP26 – will be a pivotal moment in the global response to climate change.

Cyclones are a major problem for corals. They must be increasing.

On Tuesday 13th October 2020, the Australian Bureau of Meteorology put out a media release ‘Tropical Cyclone seasonal outlook for The Coral Sea’ in which it was acknowledged that, and I quote:

Recent decades have seen a decline in the number of tropical cyclones in our region.

Bureau climatologist, Greg Browning, went on to explain that this summer is likely to buck that trend, and that:

On average Australia sees 9 to 11 tropical cyclones each year, with 4 crossing the coast.

Cyclones can be devastating to coral reefs. Huge waves pound relentlessly smashing branching and fan corals. Sponges and squirts are upended. Massive Porites can be lifted and thrown metres – sometimes beyond the reef proper and onto the beach.

Given the Great Barrier Reef, as one ecosystem comprising nearly 3,000 individual reefs stretching for more than 2,000 kilometres, cyclone damaged areas can almost always be found somewhere. A coral reef that is mature and spectacular today, may be smashed by a cyclone tomorrow. So, I’m always in a hurry to visit my next reef particularly given all the modelling suggesting an inevitable increase in the number of cyclones and an inevitable decline in coral cover.

Yet!

The 2020–21 Australian region cyclone season was another ‘below average’ season, producing a total of just 8 tropical cyclones with just 3 of these categorised as severe. So since records began it is a case of less cyclones and less severe cyclones which must be good for the corals.

The Bureau has not updated this chart since the 2016/2017 season. The trend continues a downward trajectory with just 8 tropical cyclones last season (2020/2021) with 3 categorised as severe. http://www.bom.gov.au/cyclone/climatology/trends.shtml

Perhaps not surprisingly we are also seeing an increase in coral cover, and this is exactly what the latest report from the Australian Institute of Marine Science concludes. According to their Long-Term Monitoring Program (LTMP) based on surveys of 127 reefs conducted between August 2020 and April 2021, and I quote:

In 2021, widespread recovery was underway, largely due to increases in fast growing Acropora corals.

Survey reefs experienced low levels of acute stressors over the past 12 months with no prolonged high temperatures or major cyclones. Numbers of outbreaks of crown-of-thorns starfish on survey reefs have generally decreased; however, there remain ongoing outbreaks on some reefs in the Southern GBR.

On the Northern GBR, region-wide hard coral cover was moderate and had continued to increase to 27% from the most recent low point in 2017.

On the Central GBR region-wide hard coral cover was moderate and had increased to 26% in 2021.

Region-wide hard coral cover on reefs in the Southern GBR was high and had increased to 39% in 2021.

More information at https://www.aims.gov.au/reef-monitoring/gbr-condition-summary-2020-2021

Meanwhile former US President Barack Obama – who has never ever actually visited the Great Barrier Reef – confirmed he will attend the COP26 climate change summit in Glasgow. He is apparently meeting young climate change activists and highlighting their work around the world. I’m wondering when he will bring them to see the corals. The closest he has got, so far, is to Brisbane back in November 2014. He gave a speech at my old university lamenting the parlous state of the corals and claiming he wanted to take his daughters to see the corals before they were all gone.

But. We are still waiting. As far as I can tell, like Malcolm Turnbull, Barack Obama frightens the children about that which they have never actually seen or experienced with his own eyes – and with opinion that often does not even accord with the available statistics.

Former US President Bill Clinton hasn’t made it to Glasgow, but he did visit the Great Barrier Reef back in November 1996. He apparently spent a short hour snorkelling at a reef off Port Douglas.

If I didn’t know something about the scientific method, greenhouse gases, the Great Barrier Reef, and that foundation, I would be inclined to believe there was a crisis – and that there really was something I should do about it. As it is, I know that coral bleaching occurs as part of a natural cycle that will repeat irrespective of any agreements made in Glasgow. I also know as fact that there has been no increase in the incidence of cyclones and that coral cover is good and improving. It is also fact that coral reefs would benefit if there was rising sea levels because they could keep growing-up and also that they grow faster as sea temperatures increase. Did you know that there are arguably more colourful corals and even better coral cover in waters just a few degrees warmers? The warmer waters are just to the north of Australia around New Guinea and Indonesia.

UPDATE 8PM, 4TH NOVEMBER 2021

There is now an updated cyclone chart at the Bureau’s website.

Much thanks to the Bureau for updating the chart to this year, to the 2020-2021 season. The chart and report is here: http://www.bom.gov.au/cyclone/tropical-cyclone-knowledge-centre/history/climatology/

And much thanks to Charles for reposting at WUWT.

***
The feature image shows a blue Acropora, one of the genera most susceptible to devastation by cyclones and one that has done well at many reefs over recent years. The photograph was taken at Pixie Reef just to the north of Cairns by me.

Filed Under: Information Tagged With: Great Barrier Reef

  • « Go to Previous Page
  • Go to page 1
  • Go to page 2
  • Go to page 3
  • Go to page 4
  • Interim pages omitted …
  • Go to page 445
  • Go to Next Page »

Primary Sidebar

Recent Comments

  • Ian Thomson on Vax-ed as Sick as Unvax-ed, Amongst My Friends
  • Dave Ross on Vax-ed as Sick as Unvax-ed, Amongst My Friends
  • Dave Ross on Vax-ed as Sick as Unvax-ed, Amongst My Friends
  • Alex on Incarceration Nation: Frightened of Ivermectin, and Dihydrogen monoxide
  • Wilhelm Grimm III on Incarceration Nation: Frightened of Ivermectin, and Dihydrogen monoxide

Subscribe For News Updates

  • This field is for validation purposes and should be left unchanged.

November 2025
M T W T F S S
 12
3456789
10111213141516
17181920212223
24252627282930
« Jan    

Archives

Footer

About Me

Jennifer Marohasy Jennifer Marohasy BSc PhD has worked in industry and government. She is currently researching a novel technique for long-range weather forecasting funded by the B. Macfie Family Foundation. Read more

Subscribe For News Updates

Subscribe Me

Contact Me

To get in touch with Jennifer call 0418873222 or international call +61418873222.

Email: jennifermarohasy at gmail.com

Connect With Me

  • Facebook
  • LinkedIn
  • RSS
  • Twitter
  • YouTube

Copyright © 2014 - 2018 Jennifer Marohasy. All rights reserved. | Legal

Website by 46digital