• Skip to primary navigation
  • Skip to main content
  • Skip to primary sidebar
  • Skip to footer
Jennifer Marohasy

Jennifer Marohasy

a forum for the discussion of issues concerning the natural environment

  • Home
  • About
  • Publications
  • Speaker
  • Blog
  • Temperatures
  • Coral Reefs
  • Contact
  • Subscribe

jennifer

Recent Sea Level Fall – Since When?

July 9, 2019 By jennifer

ALWAYS in search of an ultimate truth, I’m rarely one to admit that everything is relative. When it comes to shorelines and the age of ‘wave cut platforms’, however, there is no escaping it … the relativism.

The sea and the climate are modelling our coastline as a sculptor might work a piece of clay … except over a longer time frame, and the shoreline is made of materials that are much tougher and much less consistent than clay. I’m specifically referring to the coastal sandstones, and also the granites, and even the igneous intrusions (from past volcanoes), along the coastal track from Main Beach at Noosa Heads to Hell’s Gates in Noosa National Park.

Geological time can be thought of in terms of the last few thousand years, the last few 100 thousand years, and also in terms of millions of years.

Over these periods sea levels along the east coast of Australia have risen, and fallen, and risen again. The factors causing the change in sea level over these time periods can be understood in terms of the varying orbits, tilts and wobbles of the Earth around the Sun, and also the varying levels of radiation emitted from the Sun. There are other factors. For example, varying declination of the moon may cause a 18.6 year pattern in sea levels. But this is unlikely to leave a mark on the shoreline … unless there are corals, as I will discuss at the Maroochydore Surf Lifesaving Club this Sunday*.

*****************************
If you are coming on Sunday, please book here: https://www.trybooking.com/book/event?eid=520591

******************************

Waves pound at cliff faces. Sometimes until they are cut back to sea level.

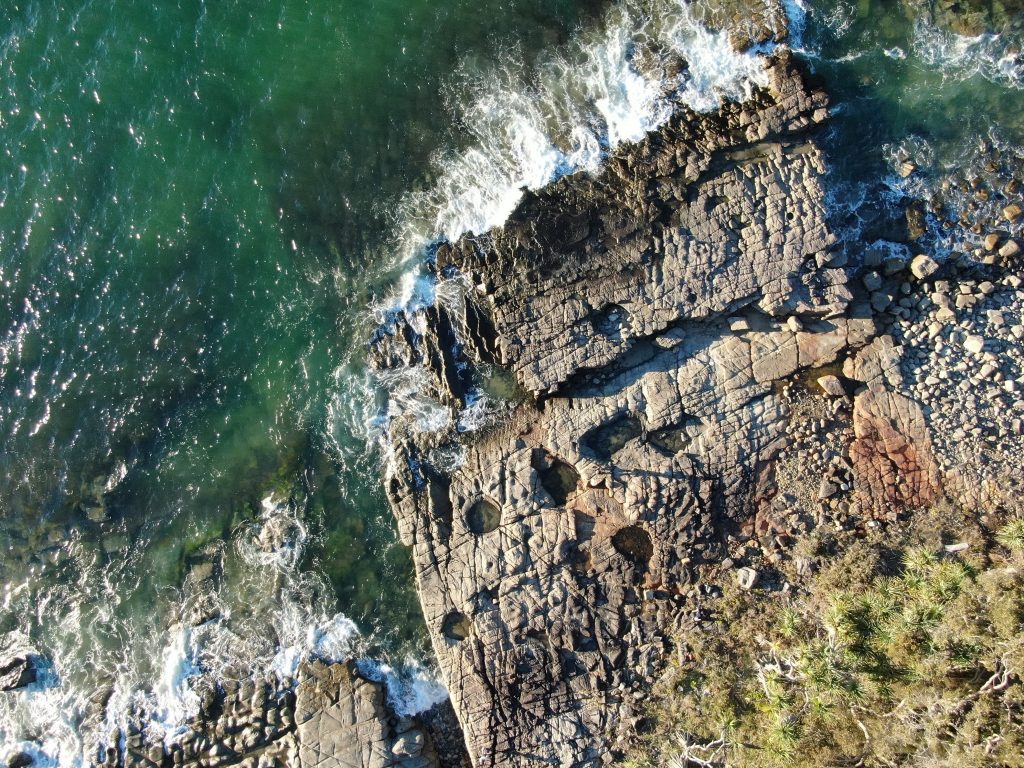
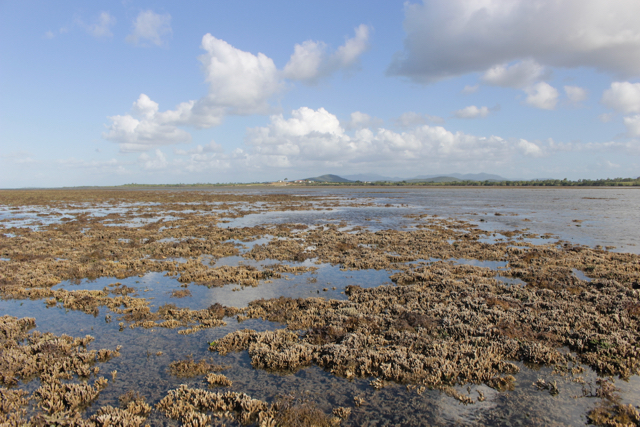
So, along the east coast of Australia – along the path I often walk from Hasting Street/Main beach to Hell’s Gates – and back, I find what are called by geologists ‘wave cut platforms’.

This photograph was taken looking north from Granite Bay, early one Sunday morning in June.

These ‘wave cut platforms’ exist where the sea has cut into the cliff face, creating a flat area that we would expect to be at sea level.

Well … we would expect the wave cut platform to be at sea level only if sea levels did not change.

If sea levels are rising then these platforms should be underwater.

The potholes in the rock platform to the north of Tea Tree Bay are above the high tide mark. These holes in the sandstone are thought to be formed from boulders working as grinding stones in the surf, as explained in the comments thread of a previous blog post.

These rock pools are known as potholes by geologists. This photographs was taken from my drone late in the afternoon, to the north of Tea Tree Bay, Noosa National Park. Can you see me in the photograph … I’m there, looking up?

Mostly, I see wave cut platforms above sea level. Yet, the east coast of Australia is often defined by geologists as a “relatively young sea-coast” — for example in W.J. Dakin’s book entitled ‘Australian Seashores’.

Where there are rock platforms that are well defined, yet a couple of metres or so above the highest tides, is this perhaps evidence that sea levels have fallen relatively recently. But exactly when?

This blog post is partly a shout-out to knowledgeable geologists …

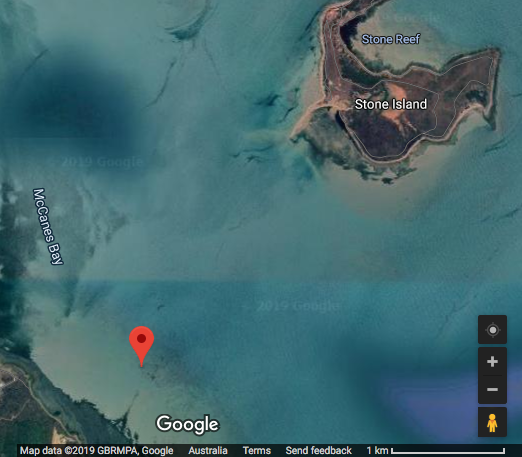
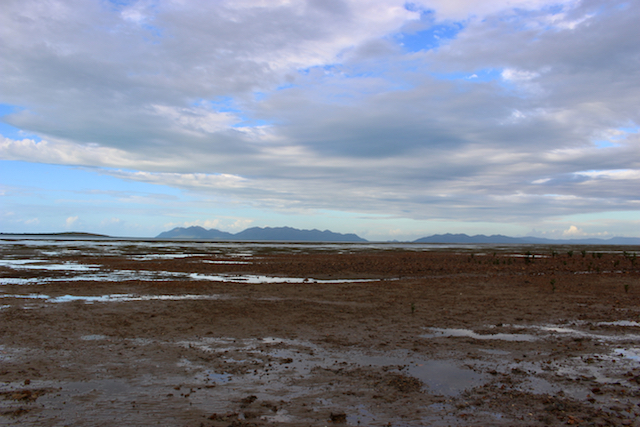
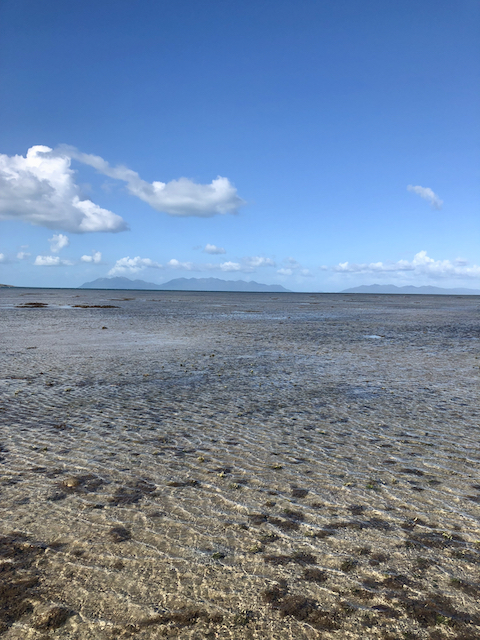
Considering the coastline in these pictures taken from my new drone (called Skido):

1. When are the sandstone platforms likely to have been cut by the waves?

2. Would the rock platform with the pot holes have been cut during the last inter-glacial period from perhaps 140,000 to 120,000 years ago?

3. Is there any evidence of the more recent Holocene high-stand, which I understand to have been about 6,000 years?

I understand that sea levels were about 2 metres higher 120,000 years ago, and about 1.5 metres higher 6,000 years ago?

According to Warwick Willmott’s book entitled ‘Rocks and Landscapes of the Sunshine Coast’ the headlands of Noosa, Coolum and Point Cartwright were islands during the last inter-glacial.

In between this last-interglacial and the beginning of the Holocene (some 11,600 years ago) we had a fall in the sea level of about 150 metres along the Sunshine Coast – I’m quoting again from Warwick Willmott.

I should like to take some photographs of the underwater platforms that are evidence of the 150 metre fall in sea level. So, how far off the coast will I need to send my drone?

*****************
UPDATE 11 JUNE 2019

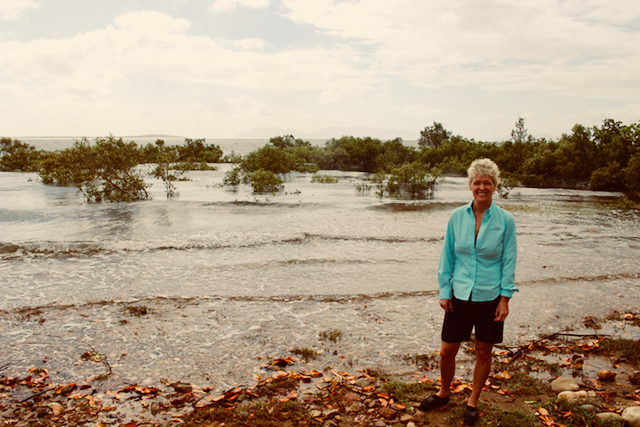
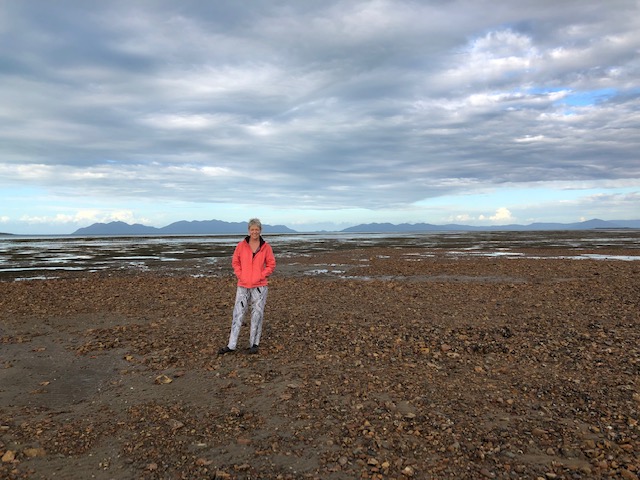
I’ve walked over these potholes at high tide, and was sure the surf didn’t get that far … but I had to check, and get some photographs to be sure. So, I went this afternoon for what was a relatively high tide of 2.0 metres at 4.30pm. The highest for this year was 2.32 metres on 22nd January. The second highest will be on 1st August at 2.27 metres.

Anyway, following are three photographs (from today on the highest tide) to provide additional perspective.

A screen shot from video of the pot holes, this time on a very high tide.

A photograph of the pot holes, on the very high tide today, 11th July 2019./caption]

****

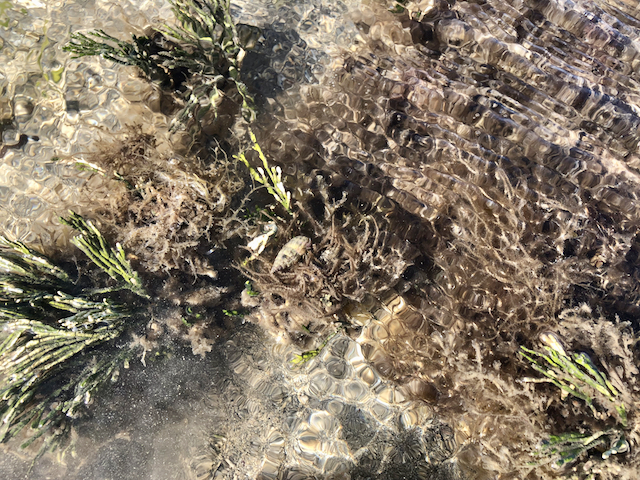
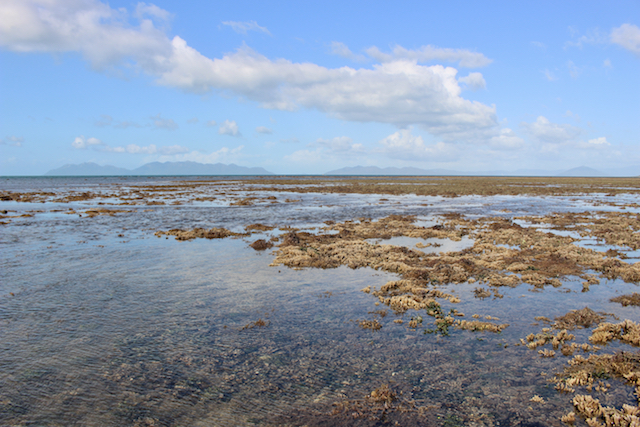
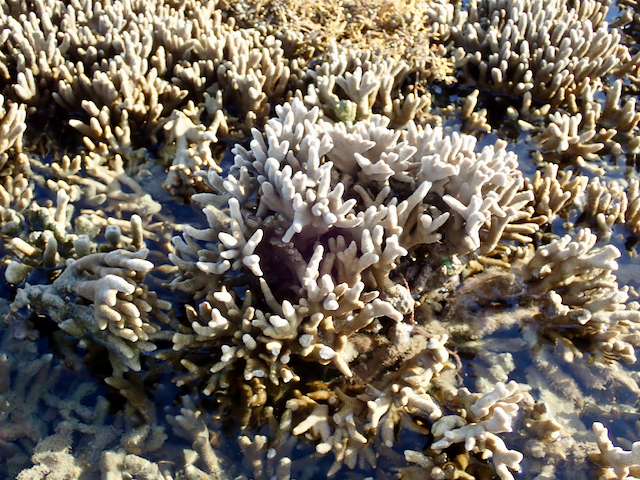
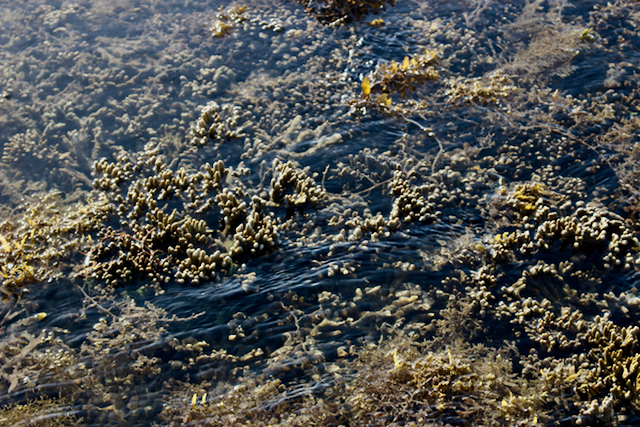
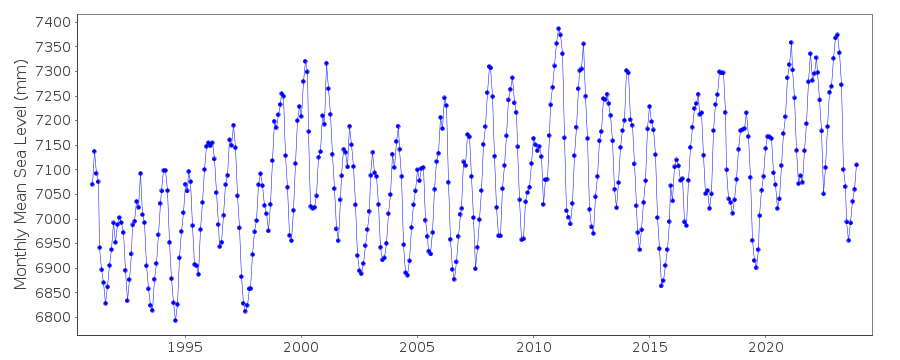
*I shall be showing these photographs of rocky landscapes, and many more of corals, at the Maroochydore Surf Lifesaving Club this Sunday (14th July) at 2pm. Coral can give us an indication of sea level fall over much shorter time frames, for example, since 1950 as I will show on Sunday.

Everyone is welcome at the surf club, entry is $10, please register online here. The instructions are to go to Level 3, which is the Conference Room. The address is 36 Alexander Parade, Maroochydore. I’m told the $10 includes afternoon tea!

Filed Under: Information Tagged With: sea level change

Sea Level Fall at the Great Barrier Reef

July 7, 2019 By jennifer

I’VE been asked to speak this coming Sunday at the Maroochydore Surf Club (36 Alexander Parade, Sunshine Coast) about climate change at the Great Barrier Reef, and to provide both a local and global perspective.

It is sometimes said that “all politics is local”, but this is hardly the case with climate change: it has become such a political issue and usually the focus is global. This global focus, and particularly the focus on carbon dioxide as a driver of climate change, has confused understanding of some really basic phenomena — phenomena that are both predictable and natural.

It was entirely predictable that with the extreme El Niño of 2015/2016 there would be more coral bleaching than usual due to the falling sea levels, and perhaps also higher temperatures.

Yes, that is correct, falling sea levels.

If we consider mean monthly sea levels at Darwin (as recorded by the
Permanent Service for Mean Sea Level based in the UK) they were exceptionally low in 1997/1998 and then again in 2015/2016, as shown in Figure 1. There were falling sea levels across the western Pacific.

Indeed an El Niño is a climate cycle in the Pacific Ocean with a global impact on weather patterns that begins when warm water in the western tropical Pacific Ocean shifts eastward along the equator toward the coast of South America.

Monthly mean sea level (mm) Darwin, 1992 to 2018.

Corals usually grow-up to just below the lowest mean spring tide. Corals are particularly vulnerable to extremely low tides and in particular low tides in the middle of the day when there is also high solar radiation. The damage from such events may leave a characteristic tell-tale structure, for example, micro-atolls.

I have a picture of my mother (who migrated to Australia after WWII, see the picture featured at the top of this post) standing in front of a micro-atoll at Heron Island, where she worked as a waitress in the mid-1950s. I have another picture — I will show at the Maroochydore surf club on Sunday — showing the extent of the bleaching at Heron Island at that time.

This coral bleaching back in the 1950s, and much of the recent bleaching at the Great Barrier Reef, may have been due to falling sea levels, rather than extreme temperatures as I will explain on Sunday.

Of course, another determinant of sea level is the quantity of ice on Earth. This has varied significantly over geological time. Modern variations in ice and sea levels are negligible when compared with those from natural Ice Age cycles.

I will show some evidence of past cycles embedded in the local Sunshine Coast landscape, including when Maroochydore was underwater because of higher sea levels just 120,000 years ago.

Everyone is welcome at the Surf Club, but please book online. I will speak for about 1 hour … beginning at 2pm on Sunday 14th July on Level 3 which is the Conference Room, 36 Alexander Parade, Maroochydore. If you are coming please book online: https://www.trybooking.com/book/event?eid=520591

I hope to see you there.

Filed Under: Information Tagged With: Great Barrier Reef

My Atheism Denies Hell, But Applauds Mary McKillop

July 5, 2019 By jennifer

MY late father told me not to admit that I was an atheist … when I was preparing to appear on the ABC television program ‘Q&A’ back in October 2010.

It was likely that Tony Jones would ask me a question about Mary McKillop being made a saint, as this was a media headline back then.

Through history atheists have been vilified.

During the nineteenth century in Britain, for example, the poet Percy Bysshe Shelley was expelled from the University of Oxford for publishing a pamphlet explaining his atheism. At the time, those unwilling to swear Christian oaths during judicial proceedings were unable to give evidence in court.

Nowadays, atheism is tolerated in the West, but not in many Muslim countries where atheists are sentenced to death — presumably with the assumption he/she is going to hell. In these countries atheism is often confused with apostasy, which is defined as the abandonment or renunciation of a religious or political belief or principle.

I’ve never actually embraced a religion — though I was raised in the Presbyterian tradition — so I’m not sure how I could renounce it.

The idea that someone like myself simply does not believe is very difficult for many/most people to accept. But it is a fact. I’ve always looked to nature, not the Bible, for answers to the big questions. So, I’m fascinated by natural landscapes, which I feel always provide me with some solace, as well as understanding.

The coastline where I live at Noosa, for example, has a history that dates back perhaps 145 million years. I’m referring to the dolorite intrusion to the north of Granite Bay. Tea Tree Bay, just to the north again, has interesting wave cut platforms of sandstone, with abrasions called potholes – by geologists. I’m keen for a knowledgable geologist to explain how old these formations in this level bedrock are likely to be (see the feature image for this blog post) and what they might tell us about sea level change.

It is a fact the etching in a shoreline hold history, and meaning, for some people – myself included.

This does not mean I am in any way intolerant of those who believe in the presence of a God. When Tony Jones did ask me about miracles back in 2010, I replied:

JENNIFER MAROHASY: Like the Prime Minister [who back then was Julia Gillard], I don’t believe in miracles but I do think that it is important that we have heroes and Mary McKillop is a hero for a lot of people, particularly within the Catholic faith and I’m very pleased that for those Australians their hero is being recognised and being recognised in the Vatican and I understand that Mary McKillop stood up against paedophilia within the church and I think it’s wonderful that the Catholic Church is not only recognising a woman but an Australian and somebody who has stood up to issues that didn’t necessarily make her popular back then.

So, while I’m an atheist I respect the beliefs held by others, including Christians and Muslims.

There is a media preoccupation at the moment in Australia with the footballer Israel Folau who was sacked from the Australian team for claiming that all homosexuals, and also atheists, are going to hell.

I understand that such a claim is likely to be more offensive to a homosexual who may also be a Christian, than to an atheist who does not believe in the concept of hell. Nevertheless, I suggest that homosexuals as well as atheists be tolerant of his perspective. In fact, I thank him for having the fortitude to be so upfront in what I perceive as his ignorance. Surely, it is better that the ignorant man tell us what he is thinking so that we can have some discussion about this, least he keep the untruth to himself and let it fester.

****
The photograph is of me, and some potholes etched into Tea Tree Bay, Noosa National Park, and was taken with my new drone (Skido) in June 2019.

Filed Under: History, Opinion, Philosophy Tagged With: geology

The GAT in the Hat

June 26, 2019 By jennifer

The hopeless pursuit of a “Global Average Temperature” mirage makes mischief in meteorology. There is a better way. 

By Mark Huxley Akin

“I AM not a scientist, but a lay person who was lucky enough to grow up with a scientist father who taught us early-on the difference between Science and consensus.

I am particularly concerned with the corruption of data that is happening with the current climate debacle.

Over the years, countless dedicated individuals have given over substantial portions of their lives to the faithful monitoring of weather stations so that we might have the reliable body of data we have today. It is disheartening to see some petty apparatchik with an agenda and an eraser—or worse, an algorithm—wipe away all that careful labor, motivated by a politicized cause more pressing than humble accuracy. 

The crux of the difficulty, it seems to me, is the problematic pursuit of a mythical “Global Average Temperature (GAT).” This effort strikes me as a fool’s errand, and one which leaves the door wide open for all kinds of subjective mischief. 

Even if such a measurement could be defined, the results would be necessarily fuzzy, and the idea that one could extract from that imprecise conglomeration, comparative measurements accurate to fractions of a degree, is just plain silly. And, to get the comparative numbers we are actually interested in, totally unnecessary. There is a better way. 

What is really wanted is a simple index based on a good sample of well-sited stations with long histories, similar in concept to the Dow Jones Averages or the S&P 500. No one ever tries establish an impossible-to-define “average stock price”— including many stocks of doubtful provenance — and nobody cares. These pre-selected indexes of certain representative stocks, that are then followed over a long time-span, tell investors what they really want to know: how the market moves over time, relative to itself. 

Temperatures as measured at Richmond in Queensland, Australia, comprise an exceptionally long continuous series unaffected by any urban heat island (UHI) and measured from within a Stevenson screen since November 1889. Furthermore, maximum temperatures are still measured using a mercury thermometer. Like most such high quality, unhomogenised series for north eastern Australia it shows 1915 to have been a particularly hot year, an overall cooling trend to about 1960, and then warming to the present. This series could be the starting point for a northern Australian temperature index.

I suggest that these indexes be regionally-based. There might be a North American Weather-Records Index, (NAWRI), South American (SAWRI), Australian (AWRI), and so on. Scientists of good-will could join together into a private club with regional branches, with no necessary connection to any government agencies, and select the best collections of well-sited stations of long duration. This club would then publish results on a regular schedule. 

Although there should be a reasonable attempt to represent a variety of climate regions, it does not matter if the sitings are necessarily spotty, because we are only measuring the output of each station against itself. There should be no attempt to “homogenize” records or create “virtual stations,” because the mission of this endeavor has nothing to do with chasing some mythical GAT. 

For the oldest records, the numbers of stations in each region would be necessarily slim, but could be incrementally-increased as history advances. In areas with an abundance of good stations, some might be pre-selected to be set aside as “understudies,” or stand- ins in case of an interruption in the records of some neighboring station. (That is, the measurements are still recorded, of course, just not included in this particular index.) 

One benefit of this system is that the results obtained, including regional averages, would be exactly as precise as the original measurements themselves. There would be no guesswork and no fuzziness. 

Each region could publish graphs and averages for the index, but should probably not try to promote some “Global Average,” as that would be likely misconstrued. However, there would be nothing to stop any outside entities from doing their own “Global Index Average,” if they wished. (An “Index Average” is not a GAT, because it would not attempt to “reconstruct” (read “invent”) records for the vast areas of the globe where there are no records.) 

If any outside critics were to object to the particular collection of sites selected for the index, they could be told they were free to form their own club and create their own index. Although the group might attract a lot of good scientists who were also AGW sceptics, that should in no way serve as a definition or requirement of membership. I have no doubt there are many good scientists whose only failing is to trust some government agency more than, perhaps, they should. As long as a scientist has a true dedication to accuracy in the records, that is all that should matter. But, as a private association, the membership would be free to exclude any mischief-makers seeking to disrupt the effort.

Below is a clip of Dr. Jennifer Marohasy (recorded in early 2014) detailing one example of how the Australian Bureau of Meteorology has been cooking the books: they took a set of data from well-sited stations of long-standing in Queensland, which was too cold for their comfort, and “homogenized” it with data from far away, warmer climate zones (from a range of up to 600 miles in radius).

An important mission of this group and its work would be to serve as a central voice for those scientists who are fighting against corruption of the temperature record, and for whistleblowers who can point out specific abuses. Press conferences and an online newsletter could keep the public and other concerned scientists informed, and would also serve as a counterweight against the harassment of individual scientists who dare to challenge the political establishment. 

**** 

I have asked the author of this post, MHA, for a picture of himself … and some biographical information. It is pending. In the meantime, I’ll use this Cat, as a book mark.

More information on the feature image, the image at the very top of this blog post can be found here: https://jennifermarohasy.com.dev.internet-thinking.com.au/2017/02/australias-hottest-day-record-ever-deleted/

Filed Under: Information Tagged With: temperates

Robots Recreating Past Temperatures – Are Best to Avoid Australian Data

May 17, 2019 By jennifer

AT an artificial intelligence (AI) conference in New York recently, Sean Gourley explained Wiener’s Law: automation will routinely tidy up ordinary messes but will occasionally create an extraordinary mess – that so mimics what could have been, that the line between what is real, and what is fake, becomes impossible to decipher, even by the experts.

AI research over the last couple of years at the University of Tasmania could have been a check on the existing mess with historical temperature reconstructions. Reconstructions that suggest every next year is hotter than the last the world over. Except that Jaco Vlok began with the Australian Bureau of Meteorology’s temperature datasets without first undertaking adequate quality assurance (QA).

Remember the infamous Climategate emails, and in particular the ‘Harry read me files’? Harry, working at the Climate Research Unit (CRU) at the University of East Anglia, wrote:

Getting seriously fed up with the state of the Australian data. so many new stations have been introduced, so many false references … so many changes that aren’t documented. Every time a cloud forms I’m presented with a bewildering selection of similar-sounding sites, some with references, some with WMO codes, and some with both. And if I look up the station metadata with one of the local references, chances are the WMO code will be wrong (another station will have it) and the latitude/longitude will be wrong too.

For years, the Australian Bureau of Meteorology has been capitalizing on the mess that by its very nature throws up ‘discontinuities’ that can subsequently be ‘homogenized’ … so Blair Trewin is obliged to apply algorithms, to ensure every reconstruction shows steadily rising temperatures in accordance with theory.

As Christopher Booker explained some years ago:

What is tragically evident from the Harry Read Me file is the picture it gives of the CRU scientists hopelessly at sea with the complex computer programmes they had devised to contort their data in the approved direction, more than once expressing their own desperation at how difficult it was to get the desired results.

In short, Phil Jones at the Climatic Research Unit in the UK, Gavin Schmidt at GISS NASA in New York, and even David Jones at the Australian Bureau in Melbourne have overseen the reworking of climate data until it fits the theory of catastrophic anthropogenic climate change (AGW).

They have, in fact, become the masters of Wiener’s Law, without actually knowing the first thing about AI.

They have overseen the use of algorithms – independently of the checks and balances routinely applied in the mainstream AI community – to recreate past temperatures.  In the process the Medieval Warm Period (MWP) and the temperature extremes of the late 1930s, so evident in the raw data for both Australia and also the US, have been removed from our historical temperature records. Thus, we have the Paris Accord, and a federal election in Australia where both candidates for future Prime Minister are committed to saving the environment from rising temperatures even if it means ruining the economy.

The history of science would suggest that disproving a failed paradigm is always more difficult than replacing one, and so I have thought beginning afresh with the latest AI techniques had merit.   But this work is only likely to succeed if the Australian raw temperature database – known as ADAM – is reworked from the beginning.  Otherwise artificial warming from both the Urban Heat Island (UHI) effect and also the Bureau’s new electronic probes in Automatic Weather Stations (AWS), that record hotter for the same weather, will keep creating hockey sticks as inescapably as Groundhog day.

While artificial intelligence, and in particular ANNs, are now considered a mature technology used for a variety of tasks that require pattern recognition and decision making and forecasting – their capacity is denied by mainstream climate scientists.  One of the reasons is that leading climate scientists claim the natural climate cycles have been so perturbed by carbon dioxide that the patterns no longer persist.  This is of course little more than a hypothesis, which can be tested using ANNs as a research tool.

It has been my experience that the raw measurements of any variable associated with weather and climate, when arranged chronologically, show a pattern of recurring cycles.

These oscillations may not be symmetrical, but they will tend to channel between an upper and lower boundary – over and over again. Indeed, they can be decomposed into a few distinct sine waves of varying phase, amplitude and periodicity.  It could be the case that they represent actual physical phenomena, which drive continuous climate change.

If this is the case, it may be possible to forecast the climate including temperature, wind speed and direction and even rainfall, by understanding its component parts.  As long as the relationships embedded in the complex oscillation continue into the future, a skilful weather and climate forecast is theoretically mathematically possible using ANNs – despite chaos theory.

Skilful weather and climate forecasts using ANN represent a new application for an existing technology.  Indeed, if only a fraction of the resources spent applying this technology to mining social media data for advertising, could be diverted to the goal of better climate forecasting I’m sure more major advances would be made very quickly.  But in the case of Australia, the databases will first need to be reworked to install some integrity.

In particular, every time there is a significant equipment change (for example, a change from a mercury thermometer to an electronic probe in an automatic weather station) then that temperature series needs to be given a new ID.  In this way the ANN has some hope of finding the real patterns in climate change from the artificial warming embedded with the new equipment … or the growth of a city.

Innovation, while usually technological, often has a real political implication.  For example, with the invention of the printing press in the 1430s, suddenly there was an efficient way of replicating knowledge – it became harder to control the information available to the masses.

Since the printing press, there have been many other inventions that have dramatically improved our quality of life including the invention of the steam engine in 1712, the telephone in 1876, penicillin in 1928 and personal computing as recently as the 1970s.  Today more people are living longer, healthier and more connected lives thanks to these and other innovations.  But when we consider the history of any single invention we find that it rarely emerged easily: there was initially confusion, followed by resistance.

The history of innovation (and science) would suggest that only when there is opportunity for competition do new and superior technologies take hold.  Of course, this does not bode well for the adoption of AI for weather and climate forecasting by meteorological agencies because they are government-funded monopolies. Furthermore, they are wedded to general circulation modelling that is a completely different technique – based on simulation modelling and next year being hotter than the last.

To be clear, there is the added complication that simulation modelling is integral to demonstrating anthropogenic global warming, while ANN rely exclusively on assumptions about the continued existence of natural climate cycles.  To reiterate, it has been said that because elevated levels of carbon dioxide have perturbed weather systems, ANNs will not work into the future because the climate is on a new trajectory. Conversely, if ANN can produce skilful climate forecasts then arguably anthropogenic climate change is not as big an issue as some claim.  Clearly, as with the printing press, there are political consequences that would follow the widespread adoption of AI in climate science for historical temperature reconstructions and also weather and climate forecasting.  I’m hoping this could begin with more funding for the important work of Jaco Vlok – but perhaps not at the University of Tasmania or with Australian temperature data.

The new report by Jaco Vlok ‘Temperature Reconstruction Methods’ can be downloaded here, and my explanation of its importance and limitations ‘New Methods for Remodelling Historical Temperatures: Admirable Beginnings Using AI’ can be downloaded here.

The feature image (at the very top) shows Jaco Vlok (left) then Jennifer Marohasy, John Abbot and JC Olivier.

**********

Figure 50 from the new report by Jaco Vlok showing monthly mean maximum temperatures from the 71 locations used to recreated the temperature history at Deniliquin.

RP-AI-JVD-Overview-20190517-test

Filed Under: Information Tagged With: temperates

Bramston Reef Corals – The Other Side of the Mud Flat

May 6, 2019 By jennifer

THE First Finding handed down by Judge Salvador Vasta in the Peter Ridd court case concerned Bramston reef off Bowen and a photograph taken in 1994 that Terry Hughes from James Cook University has been claiming proves Acropora corals that were alive in 1890 are now all dead – the fringing reef reduced to mudflat.

Meanwhile, Peter Ridd from the same university, had photographs taken in 2015 showing live Acropora and the need for quality assurance of Hughes’ claims.

Both sides were preparing evidence for over a year – with the lawyers apparently pocketing in excess of one million dollars – yet there was no interest in an independent assessment of the state of Bramston reef.

It more than once crossed my mind, that with all the money floating around for reef research and lawyers … there could perhaps be some mapping, or just one transect, at this most contentious of locations supposedly indicative of the state of the Great Barrier Reef more generally.

In his judgment Judge Salvadore Vasta was left to simply conclude that it was unclear whether there was now mudflat or coral reef where an extensive area of Acropora coral had been photographed back in 1890, but that Peter Ridd nevertheless had the right to ask the question.

Indeed, the court case and the appeal which must be lodged by tomorrow (Tuesday 7th May), is apparently all about ‘academic freedom’ and ‘employment law’, while the average Australian would perhaps be more likely to care if they got to see some coral and some fish – dead or alive.

I visited Bramston Reef over Easter because I couldn’t wait any longer to know if the corals in Peter Ridd’s 2015 photographs had been smashed by Cyclone Debbie that hovered over Bowen two years later, in April 2017.

As I drove into Bowen, I took a detour towards Edgecombe Bay, but I didn’t stop and explore – because I saw the signage warning of crocodiles.

Peter Ridd had told me that his technicians had approached from the south south-east in a rubber dinghy to get their photographs. The day I arrived (April 18, 2019), and the next, there was a strong south south-easterly wind blowing, and no-one prepared to launch a boat to take me out.

On the afternoon of Easter Friday – ignoring the signage warning of crocodiles – I walked through the mangroves to the water’s edge. I found the mudflat which Terry Hughes had claimed now covers once healthy Acropora coral and walked across it. The other side of the mudflat there was reef flat with beds of healthy Halimeda. This area of reef flat over sand extended for nearly one kilometre – before it gave way to hectares of Acropora coral.

Professor Hughes had just not walked far enough.

When, with much excitement, I showed my photographs of all the Acropora to a Bowen local. He described them as, “rubbish corals”. He seemed ashamed that the corals I had photographed at Bramston reef were not colourful.

For a coral to make the front cover of National Geographic it does need to be exceptionally colourful. Indeed, for a woman model to make the cover of Vogue magazine she needs to be exceptionally thin. But neither thin, nor colourful, is necessarily healthy. Indeed, Acropora corals are generally tan or brown in colour when they have masses of zooxanthellae and are thus growing quickly – and are healthy.

White corals have no zooxanthellae and are often dead, because they have been exposed to temperatures that are too high. Colourful corals, like thin women, are more nutrient starved and often exist in environments of intense illumination – existing near the limits of what might be considered healthy.

Such basic facts are not well understood. Instead there is an obsession with saving the Great Barrier Reef from imminent catastrophe while we are either shown pictures of bleached white dead coral, or spectacularly colourful corals from outer reefs in nutrient-starved waters … while thousands of square kilometres of healthy brown coral is ignored.

Peter Ridd did win his high-profile court case for the right to suggest there is a need for some quality assurance of the research – but I can’t see anyone getting on with this. The Science Show on our National Broadcaster, hosted by a most acclaimed scientist journalist, has reported on the case just this last weekend. Rather than launching a dinghy and having a look at Bramston Reef, Robyn Williams has replayed part of a 2008 interview with Peter Ridd, and let it be concluded that because Peter Ridd holds a minority view he is likely wrong.

Understanding the real state of the Great Barrier Reef is not a trivial question: it has implications for tourism, and the allocation of billions of dollars of public monies … with most currently allocated to those properly networked – but not necessarily knowledgeable or prepared to walk beyond a mudflat to find the corals.

Signage warning of crocodiles.
Photographs of the Acropora out of the water where taken about here.
There is a mudflat to the west of Bramston Reef.
That mudflat is teeming with life, as expected in an intertidal zone.
This Porites coral is a healthy tan colour.
After the mud flat there was reef flat, with coarse sand and lots of Halimeda. All healthy, and typical of an inner Great Barrier Reef.
Halimeda is a green macroalgae, it was healthy.
Acropora corals with a view to Gloucester Island.
I did find one bleached coral.
Most of the Acropora was a healthy brown colour suggesting good growth, rather than beauty.
There were also corals to the south east.
Looking across to Gloucester Island, in front of the mangroves when the tide was in, early on 19 April.
Looking towards Gloucester Island, the day before.

To be sure to know when I post pictures at this blog, and to get the latest news regarding the Peter Ridd court case including the possible appeal by James Cook University, subscribe for my irregular email updates.

Filed Under: Information Tagged With: Great Barrier Reef

  • « Go to Previous Page
  • Go to page 1
  • Interim pages omitted …
  • Go to page 13
  • Go to page 14
  • Go to page 15
  • Go to page 16
  • Go to page 17
  • Interim pages omitted …
  • Go to page 445
  • Go to Next Page »

Primary Sidebar

Recent Comments

  • Ian Thomson on Vax-ed as Sick as Unvax-ed, Amongst My Friends
  • Dave Ross on Vax-ed as Sick as Unvax-ed, Amongst My Friends
  • Dave Ross on Vax-ed as Sick as Unvax-ed, Amongst My Friends
  • Alex on Incarceration Nation: Frightened of Ivermectin, and Dihydrogen monoxide
  • Wilhelm Grimm III on Incarceration Nation: Frightened of Ivermectin, and Dihydrogen monoxide

Subscribe For News Updates

  • This field is for validation purposes and should be left unchanged.

November 2025
M T W T F S S
 12
3456789
10111213141516
17181920212223
24252627282930
« Jan    

Archives

Footer

About Me

Jennifer Marohasy Jennifer Marohasy BSc PhD has worked in industry and government. She is currently researching a novel technique for long-range weather forecasting funded by the B. Macfie Family Foundation. Read more

Subscribe For News Updates

Subscribe Me

Contact Me

To get in touch with Jennifer call 0418873222 or international call +61418873222.

Email: jennifermarohasy at gmail.com

Connect With Me

  • Facebook
  • LinkedIn
  • RSS
  • Twitter
  • YouTube

Copyright © 2014 - 2018 Jennifer Marohasy. All rights reserved. | Legal

Website by 46digital