• Skip to primary navigation
  • Skip to main content
  • Skip to primary sidebar
  • Skip to footer
Jennifer Marohasy

Jennifer Marohasy

a forum for the discussion of issues concerning the natural environment

  • Home
  • About
  • Publications
  • Speaker
  • Blog
  • Temperatures
  • Coral Reefs
  • Contact
  • Subscribe

jennifer

Found: 25 Hectares of Acropora at Stone Island

September 5, 2019 By jennifer

CORAL reefs in shallow waters adjacent to the Australian mainland are considered particularly susceptible to coral bleaching, and also smothering by sediment from turbid water. This was all lamented a week or so ago, including by Sussan Ley, the Federal Environment Minister. Relying on a review of more than 1,000 reports by academics who don’t get out enough, she told the nation that the prognosis for the Great Barrier Reef, and particularly inshore reefs, is very poor.

Acropora sp and Turbinaria mesenterina, both hard corals, photographed with my little underwater Olympus camera on 27th August 2019, at an inshore reef fringing Stone Island.

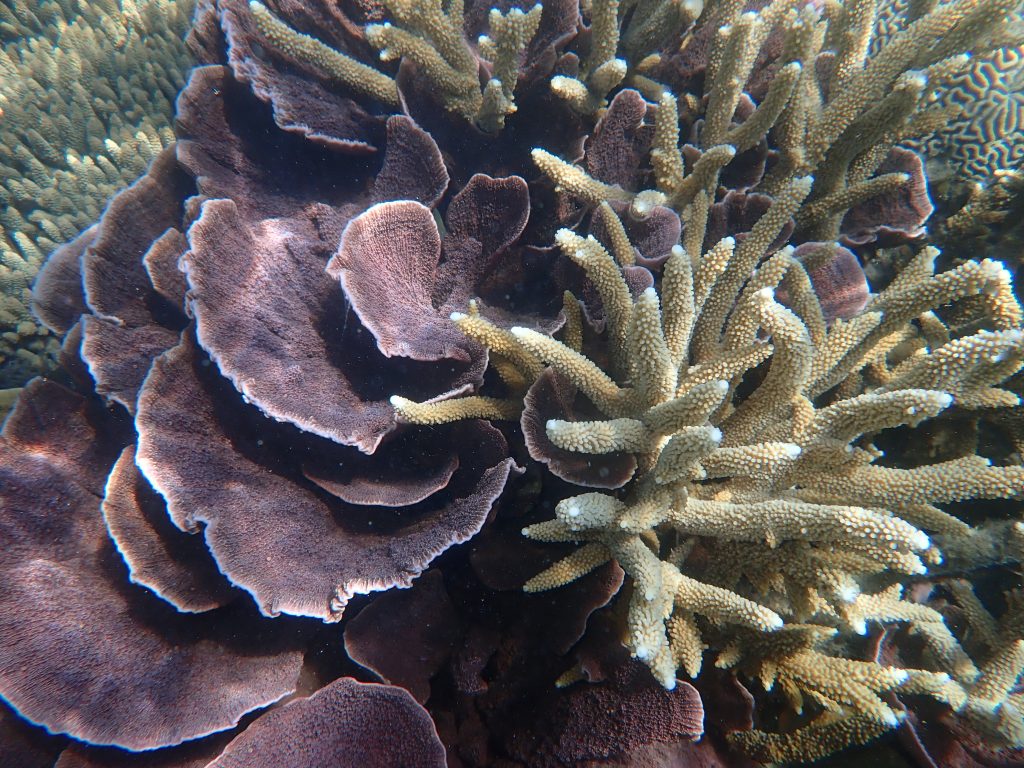
One of the papers that helped shaped this opinion is by Tara Clark (and colleagues) entitled ‘Historical photographs revisited: A case study for dating and characterising recent loss of coral cover on the inshore Great Barrier Reef’ published by Nature (DOI: 10.1038/srep19285).

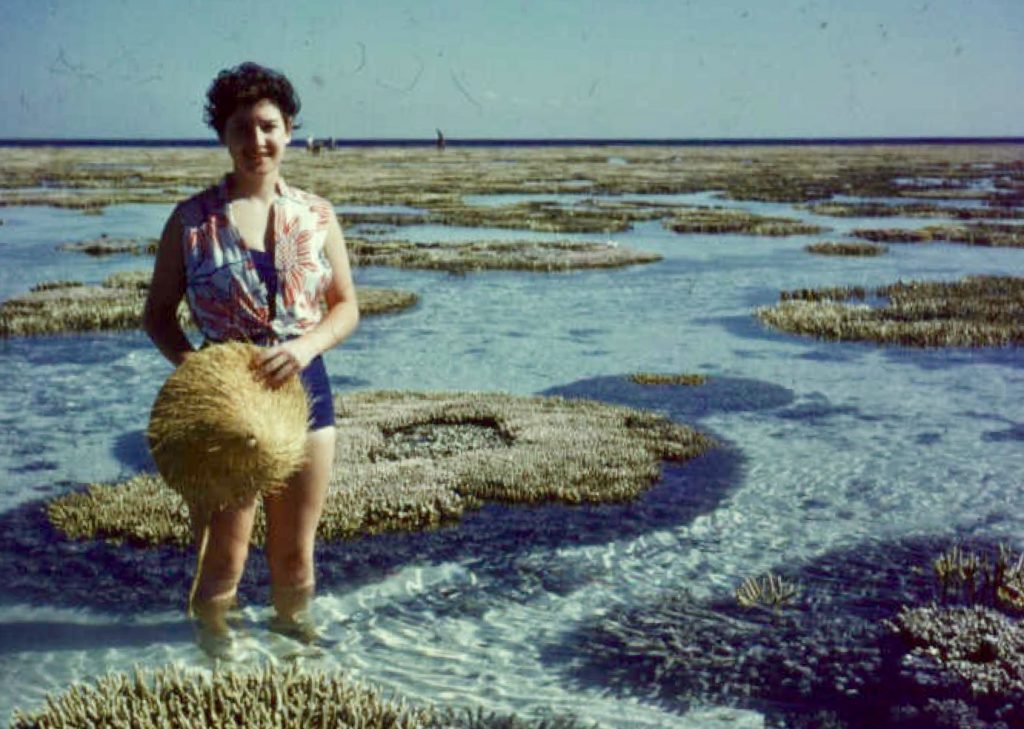
The historical photographs were taken circa 1890 and 1915 of corals in the vicinity of Stone Island, off Bowen, and they show healthy corals including species of the branching coral Acropora spp.. The historic photographs have Gloucester Island and Gloucester passage as an iconic backdrop.

Tara Clark and colleagues concluded in the peer-reviewed paper published in 2016 that:

Using a combination of anecdotal, ecological and geochemical techniques, the results of this study provide a robust understanding of coral community change for Bramston Reef and Stone Island. In the late 19th and early 20th Century, historical photographs revealed large and abundant living tabular Acropora sp. and massive faviid colonies at Bramston Reef and high cover of both plating and branching Acropora sp. colonies at Stone Island. By contrast in 1994, no living Acropora colonies were found at either location and the majority of the large faviids that featured so prominently at Bramston Reef in c.1890 were dead, covered in algae and/or mud.

And further that:

In 2012 (eighteen years later), Bramston Reef was still characterized by many large faviid colonies, dead and overgrown by algae and sediment, as well as a large number of small living faviid colonies. Yet there was evidence of some small increase in coral cover, primarily driven by tabular Acropora sp. and other genera. In addition, living faviid colonies that appeared to be of equal size to their predecessors were also found in 2012, albeit scarc. At Stone Island, the reef crest was similar to that observed in 1994 with a substrate almost completely devoid of living corals.”

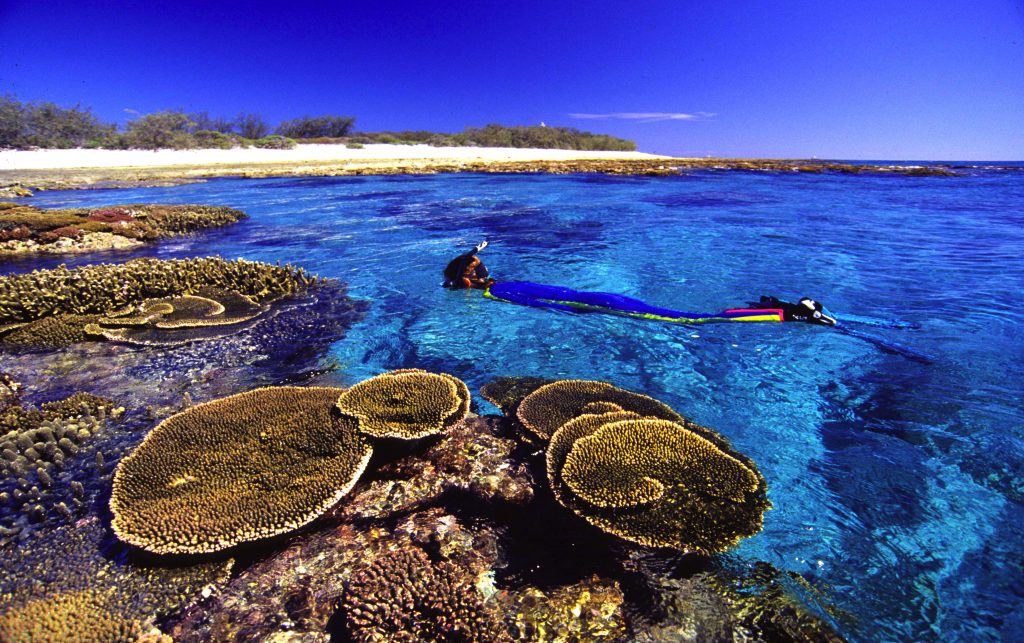
I visited Stone Island late August, and was surprised to find an abundance of Acropora spp. forming both plate and branching colonies. I saw and photographed large pink plate coral on 25th August — some more than 1 metre in diameter — at the reef edge just 30 metres from where Tara Clark and colleagues ended their transect as published in Nature.

I’ve named this coral reef — that Clark and others claim doesn’t exist — Clint’s reef after Clint Hempsall, the underwater cinematography who spent over an hour filming there on 25th August 2019.

Me (Jen Marohasy) photographing Clint Hempsall filming off Stone Island with a rather large underwater camera.

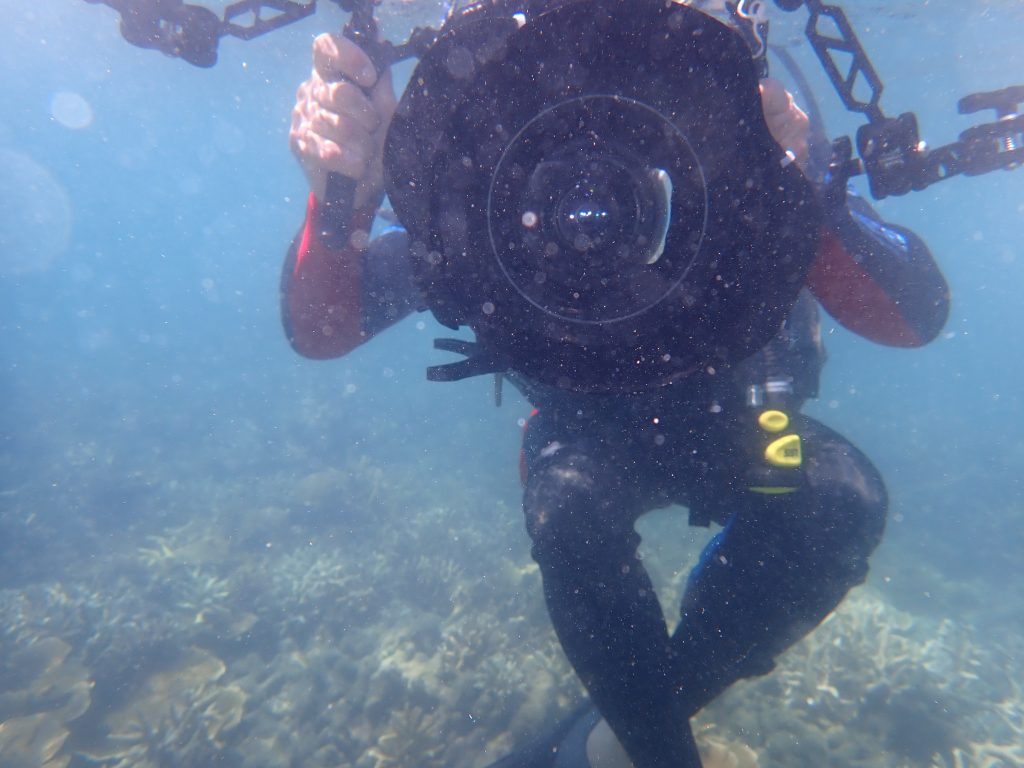
This footage will hopefully be included in the film we are making about the inner reefs of the northern Whitsundays: an area that includes Bowen harbour and Stone Island. The footage should also be archived, so that like the 1890 and 1914 photographs it is available as a historic record, a snapshot in time of the state of these reefs.

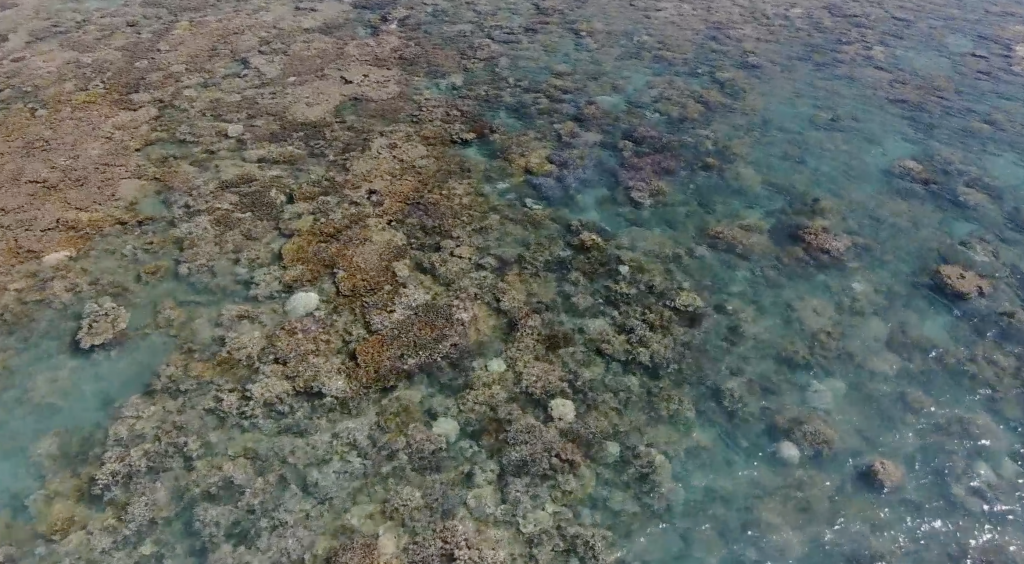
The two days later, on 27th August, we visited a reef just around the headland from Clint’s reef, in the southern corner of the north-facing bay at Stone Island. The coral coverage here was much more extensive, and this bay also has a view across to Gloucester Island and Gloucester passage.

A screenshot from aerial drone footage (Skido of course) that will hopefully be in the film … showing Beige Reef beyond some seagrass in the middle distance and Gloucester Island in the background.

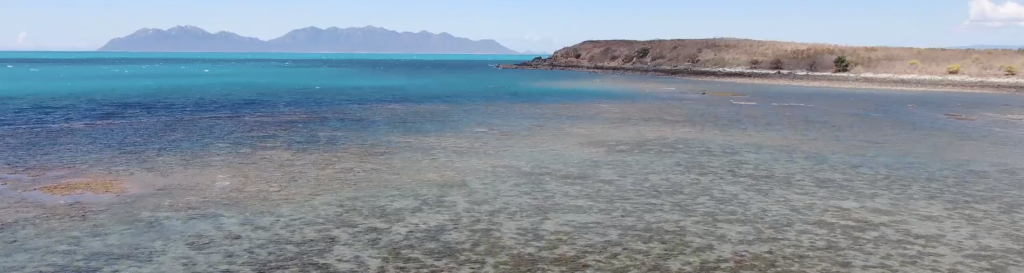
At this reef, that I’m calling Beige reef, my colleagues Rob McCulloch and Walter Starck estimated close to 100% coral coverage over perhaps twenty-five (25) hectares. I want to return to this reef and map it with my drone (Skido, of course).

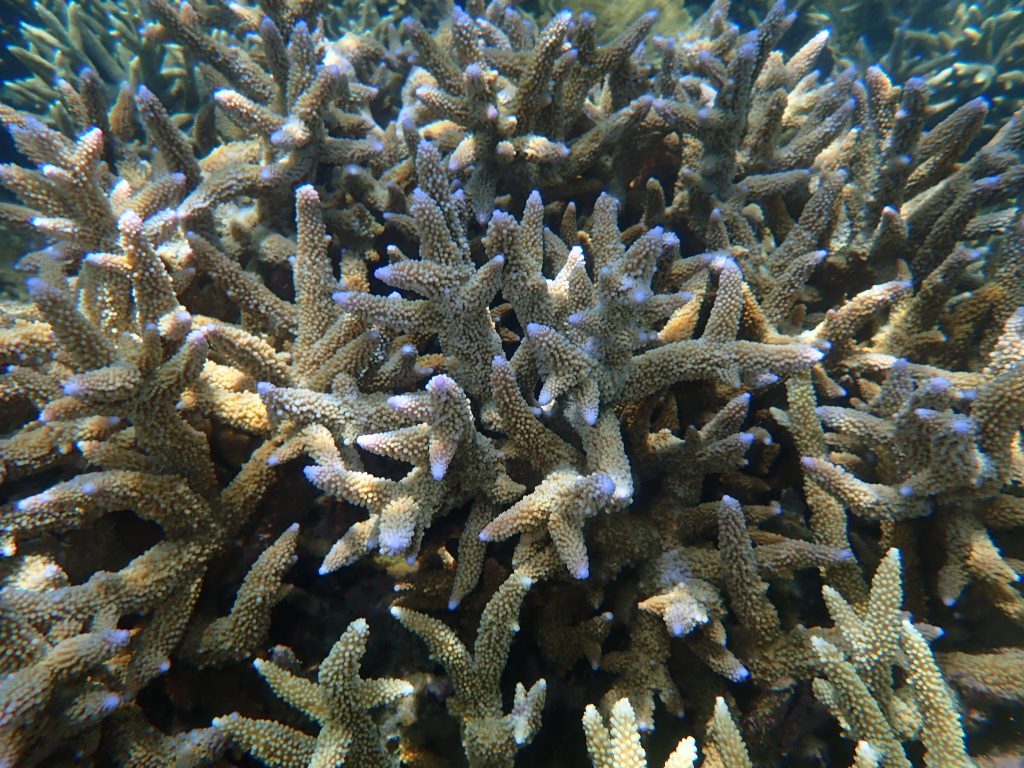
There are two dominant coral species at Beige Reef – an Acropora sp. and Turbinaria mesenterina.

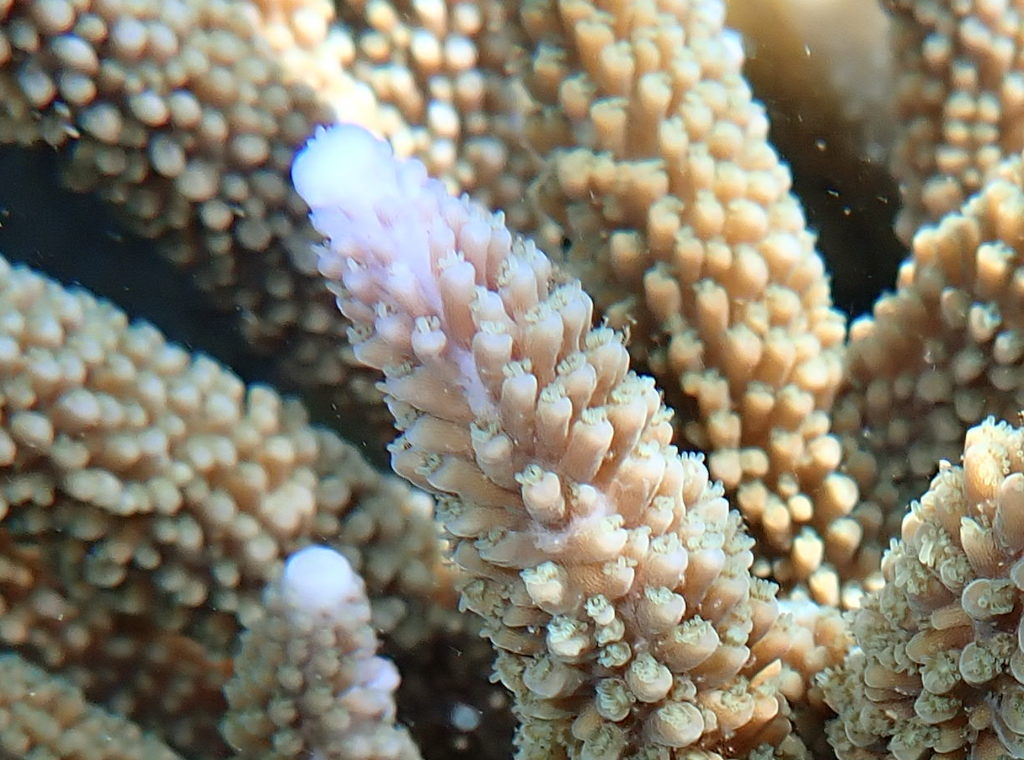
The genus Acropora is distinguished by having axial corallites at the tip of each branch, that are different in size, form and often colour from the radial corallites on the same branch. At Beige reef you can easily distinguish the axial corallites on the dominant Acropora species because they are florescent and glow either white or purple. So the branch is beige and the tip white or purple.

The beige Acropora with a florescent tip, which is the axial corallite.

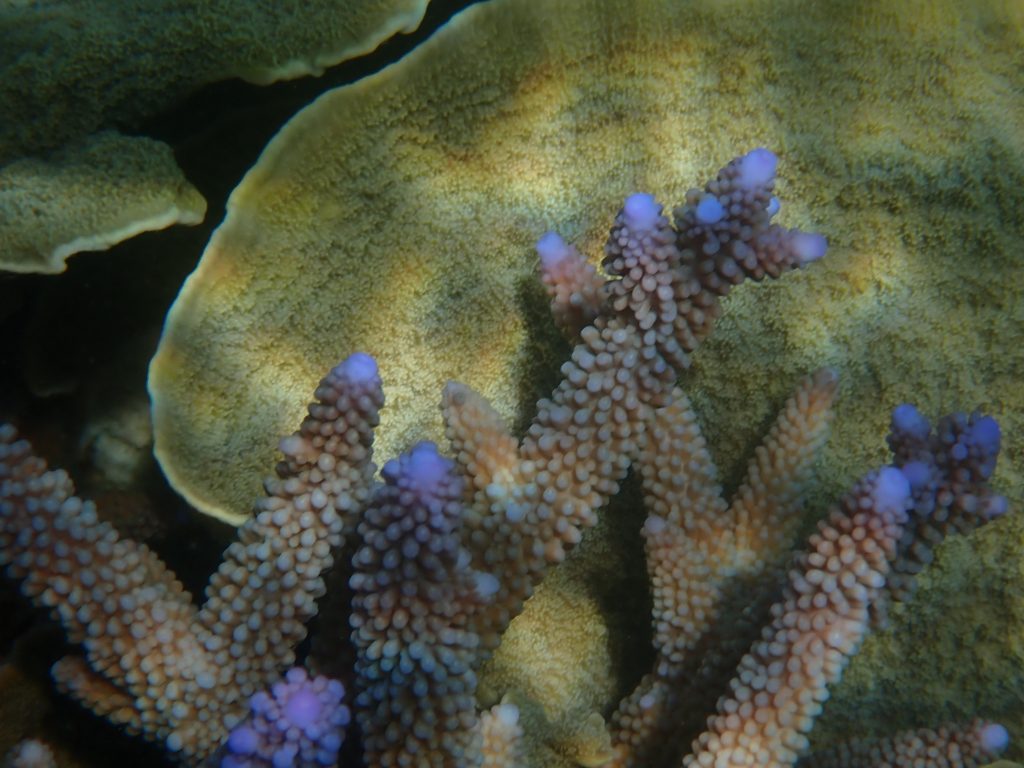
I’ve read that such shallow-water reef-building corals with these photoproteins that fluoresce are more resistant to bleaching when the photoproteins are positioned above the zooxanthellae to protect them from harsh light, as is in the case with this Acropora species at Beige reef. Bleaching occurs when the symbiotic algae (zooxanthellae) are expelled when temperatures become too hot or too cold. Apparently in some deep water corals that fluoresce, the photoproteins are below the zooxanthellae to reflect the light back.

There are apparently over 130 species of Acropora and I would be keen to know the actual species at Beige reef… with these florescent tips.

This is a dominant coral species over perhaps 25 hectares at Beige reef, which is in the south-eastern corner of the northern facing bay at Stone Island in Bowen Harbour.

Does anyone want to hazard a guess as to the specific species of Acropora that I have photographed?

It is possible to see the corallite and the tentacles in the close-up photograph.

I’m just learning how to take such pictures that are important for accurate coral identification. The next stage will be to include a scale, for reference … to know the size of the corallites.

A close-up of the dominant Acropora sp. at Beige reef, showing its tentacles extended. I took this photograph on 27th August with the microscope setting on my little underwater Olympus camera.

Beige reef is a shallow inshore reef that would be more suspecting to bleaching from both exposure at low tide and also the water heating-up than any of the other reefs I snorkelled off-Bowen. Yet surprisingly there was little evidence of bleaching here — or at the other reefs.

Another screenshot from aerial footage from my drone Skido … drones could be used much more to do detailed surveys of inshore reefs with the footage archived.

The most damaged of the eight reefs that we snorkelled was at Middle Island, with much of the reef to the south-west of the island reduced to rubble by Cyclone Debbie which struck in early 2017.

The other dominant coral species at Beige Reef is Turbinaria mesenterina. This is a type of foliose coral in the family Dendrophylliidae. The individual polyps fuse to form what are called unifacial laminae, that look something like lettuce leaves made of limestone and all with a white trim.

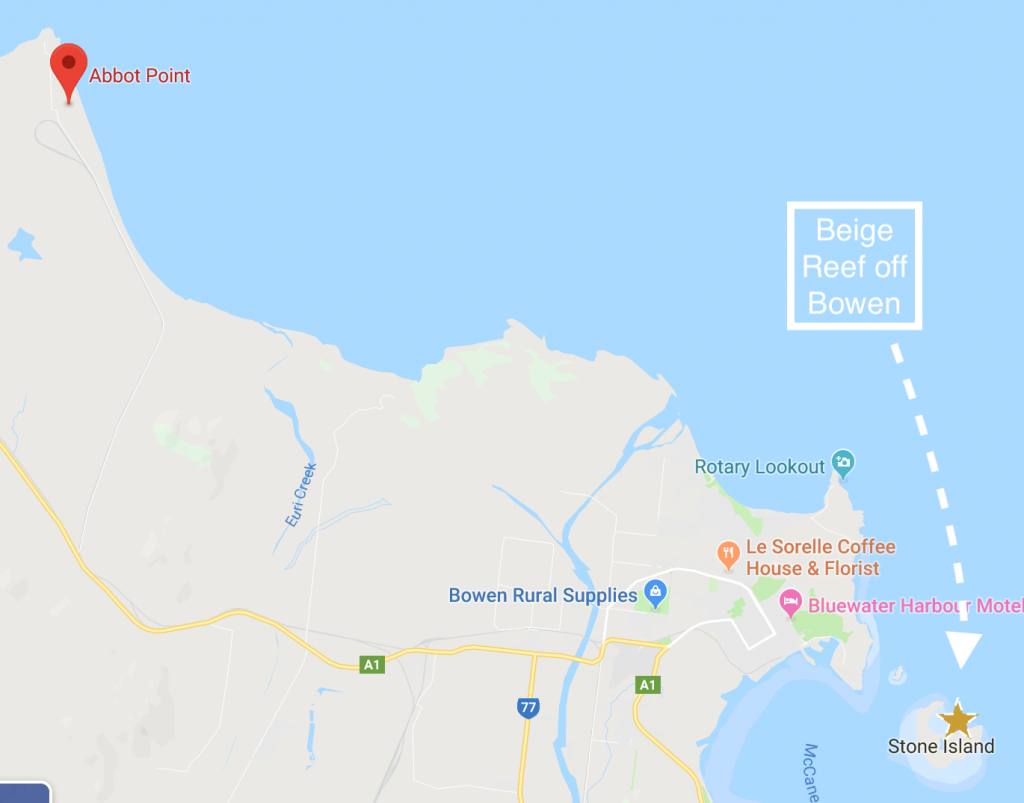
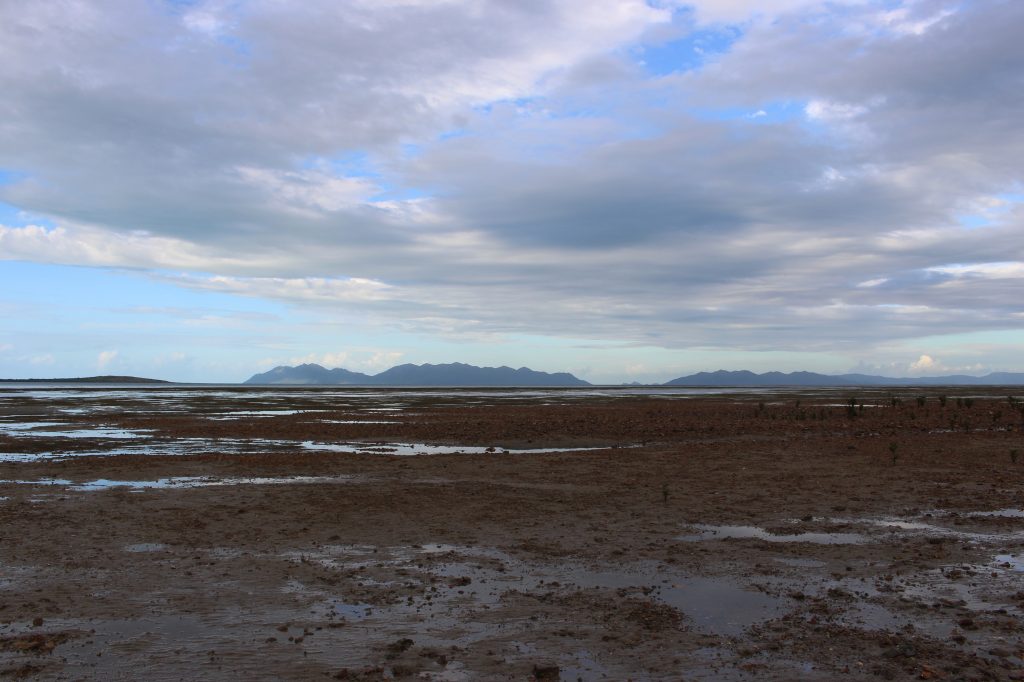
I’ve read that this coral can self-clean, which is perhaps handy given it lives in relatively turbid inshore waters. Indeed there are mudflats and mangroves at Stone Island, and the Abbot Point coal terminal is not far away, as shown on the map.

These ‘lettuce leaf’ corals were mostly beige in colour, though there were also corals of the same species (T. mesenterina) that were a deep purple, as shown in the second photograph at the very top of this blog post. Both the purple and white forms have the same white trim around the perimeter.

Of course, the colour of a coral has everything to do with the species of symbiotic zooxanthellae, which is the species of symbiotic algae that lives in the coral. So, the same species of coral may be different colours and different species of coral the same colour.

At Beige reef there are a lot of corals that are a delicate beige colour, which is perhaps not for everyone. But I thought it a most beautiful coral reef.

It is a pity that this reef, Beige reef, is denied in the scientific report by Tara Clark and colleagues as published by Nature in 2016. And I find it surprising that Minister Ley can be so negative about the inshore reef because this was not my experience at all having just spent 10 days exploring 8 mostly inshore reefs in the Whitsundays including Beige and Clint Reefs that fringe Stone Island.

UPDATE 06/09/2019: THERE WAS AN ERROR WITH A DATE (I PHOTOGRAPHED THE PLATE CORAL AT CLINT’S REEF ON 25TH, NOT 26TH) AND I’VE MADE A COUPLE OF OTHER EDITS JUST NOW … 1PM ON 6TH SEPTEMBER. THANKS FOR YOUR PATIENCE. ALSO, I’VE ADDED A PHOTOGRAPH. I SHALL STOP NOW. JEN

***
Beige reef has been flown over with my drone, and there is over an hour of underwater cinematography from Clint Hempsall. This footage all needs to be archived … but first some of it will hopefully be included as part of a short film just on Beige reef and then there will be the longer film about all eight reefs. Subscribe at my website so you know when.

Me (Jen Marohasy) on my way back to Bowen from Stone Island on 26th August 2019.

Filed Under: Information Tagged With: Great Barrier Reef

10 Days at the Magnificent Great Barrier Reef (Part 1, Whitsundays)

August 31, 2019 By jennifer

I’VE spent the last 10 days snorkelling, paddle boarding, and droning over the coral reefs of the northern and southern Whitsundays. I’ve been with a great crew including Clint Hempsall who has an underwater camera and he has taken so much footage … been filming underwater all of this time.

We started at Horseshoe bay that is right in Bowen township … in fact there is a coffee shop within perhaps 250 metres of the southern headland where there are a great diversity of colourful corals growing on the granite, and there is a lifeguard.

I was surprised to see such colourful, healthy corals straight-off the beach and so accessible from the mainland/a north Queensland town. A family can train/bus/drive to this local beach at Bowen and go snorkelling and find many of the corals found throughout the Great Barrier Reef. Indeed, the bays and headlands around Bowen offer an opportunity for anyone to see corals, without spending a lot of money.

Bramston Reef is also off-Bowen, just to the south from the end of Ocean View Drive. It is possible to park a car here and walk out across the mudflat that is teeming with life, then across the reef flat with Halimides and red starfish … then there is so much coral. This coral reef looks very different to Horseshoe Bay. The corals are mostly brown, but there are also pinks and greens and they are large and spread over perhaps 40 hectares, it would be great to map this area but much of it falls under a no-fly zone which is the approach to Bowen airport and so I haven’t been able to fly my drone there … but I have gone out over it on my paddle boat. That was so much fun.

I have also snorkelled over Butterfly reef on the Southern Whitsundays … a uniquely different reef with lots of very yellow soft corals. That day I also jumped-in at Luncheon reef and saw an old Porites (dead) now with a layer of a brilliant blue encrusting coral growing over it. And there were so many fish, and also seagulls. You look back to the islands and they are covered in Hoop pine. It is so pretty: above and below the water.

I didn’t see any coral bleaching, but there was some damage from crown-of-thorn at Luncheon reef.

Most of the last 10 days has been at Stone Island, which is just off Bowen and has so many unique and different reefs around it.

I know that at its narrowest it is 1.3 km between the mainland and Stone Island because I had originally intended to do all of this on my paddle board and was measuring distances … as it turned out my friend Rob McCulloch bought a boat down from Cairns for this part of our project.

Attached is an aerial view from my drone (Skido) looking down on Clint Hempsall with his underwater camera and oxygen tank at what I’ve named Clint’s reef, off the south western edge of Stone Island. This reef has some beautiful pink plate corals, and a lot of stoney corals (what look like Porites). There are also various soft corals. On the mud flat we saw so many sea cucumbers, and there was a whale breaching off shore that day, not to mention all the green turtles (perhaps 8 along a stretch travelling/boating slowly for perhaps 10 minutes).

Just around the corner to the north east from Clint’s reef is the eastern facing bay at Stone Island. There are large bombies covered in different corals to the north, but my very favourite reef is in the south western corner of this bay … I’m calling it Beige Reef. There is nearly 100 percent coral cover over at least 20 hectares here … and so much foliose corals that are a delicate light beige colour with a white trim: image lettuce leaves in a hard limestone in these colours. Scattered amongst these corals are off-white Acropora (staghorn corals) with fluorescent purple tips and so many little Damsel fish, mostly black in colour. This coral garden is truly a sight to behold. Not particularly colourful, but rather subtle, beautiful, textured and with the light dappled through as I swam over.

At Beige reef there were also large Wrasse fish, and also Parrot fish and also Cheatadon (Butterfly fish).

So, I’ve had a wonderful 10 days so far … and I’m still to visit Middle Island today (Saturday) and Bait Reef on Sunday.

I will be in Mackay Monday night (2nd September) to give a talk about all of this at the Ocean International Resort, 1 Bridge Road, Illawong Beach, Mackay from 7pm.

Clint Hempsall will put together a few minutes of underwater footage with a focus on Beige reef … and this will also feature the the rest of the team on the boat and also some of us snorkelling and diving.

I hope to see you there!

****
The feature image shows Clint Hempsall filming underwater off the southern end of Stone Island (off Bowen) this year on my birthday, which was 26th August. I took the picture from my drone, called Skido.

I also have many minutes of aerial drone footage of this scene with the water washing against the edge of reef. I’m hoping the scene will make it into our film documenting the 2 weeks (in total) that we will have spent exploring the Whitsundays this August/September 2019.

This adventure has been funded by the B. Macfie Family Foundation through the Institute of Public Affairs.

Filed Under: Nature Photographs Tagged With: Great Barrier Reef

Heron Island Corals: Still Constrained by Sea Level Fall

August 20, 2019 By jennifer

MY mother lived and worked on Heron Island at the Great Barrier Reef in 1955. That was the same year the young Bob Endean established the University of Queensland Heron Island Research Station. He went on to become a famous marine biologist, and instrumental in the formation of the Great Barrier Reef Marine Park Authority (GBRMPA) in 1975.

There are photographs of my mother, then Joan Edith Pearce, standing knee deep surrounded by Porites coral micro atolls that are stunted and bleached. I showed one of these at my talk entitled ‘Climate Change Concern’ at the Maroochydore Surf Life Saving Club on 14th July. This has now been made into a YouTube:

The growth of corals back in 1955 at Heron Island was constrained by their inability to continue to grow-up, because sea levels were not rising. This continues to be the situation today — despite what you might to be told on the nightly news.

In fact, a peer-reviewed technical paper by L. Scopelitis et al. published in the journal ‘Coral Reef’ (2011) and rather curiously entitled ‘Coral colonisation of a shallow reef flat in response to rising sea level: quantification from 35 years of remote sensing data at Heron Island, Australia’ explains that the period 2002 to 2007 has been the most constrained for Heron Island corals since at least 1940. This is apparently because they have reached their vertical limit for growth, and there has been no sea level rise.

The single biggest threat to the Great Barrier Reef is sea level fall. Sea levels did fall some 30 centimetres during the recent super El Nino event of 2015/2016 as I explain in the YouTube presentation.

This is not a large amount considering that the tidal range at Heron Island on any one day can be anything from 1 to 3 metres.

But 30 centimetres is enough to result in bleaching of the top 30 centimetres of a coral that may be subject to sunshine on the exposed reef flat for perhaps an hour.

Heron Island is a coral cay that formed perhaps 6,000 years ago, perhaps following a violent storm when a large pile of coral rubble and broken shells was left above the high tide mark. It has grown since then.

The incident of bleaching due to low sea levels associated with El Nino events has been documented at other Great Barrier Reef islands back 3,000 years by Helen McGregor at Wollongong University.

I’m specifically thinking of her paper entitled ‘Coral micro atoll reconstructions of El Nino-Southern Oscillation: New windows on seasonal and inter annual processes’, which was published in the journal ‘Past Global Changes’ (volume 21) in 2013. By dissecting micro-atolls — the type shown in the picture of my mother at Heron Island back in 1955 — it is possible to understand that sea level has been a constraint to coral growth at the Great Barrier reef for at least this long: at least 3,000 years.

The distinctive micro-atoll form is a result of continual exposure to heat and sunlight at extremely low tides, which result, of course, in low sea levels.

****

I’m leaving Noosa tomorrow for the Great Barrier Reef. If you would like to be updated on my work there — with a drone pilot and underwater photographer — considering subscribing for my irregular email updates:https://jennifermarohasy.com.dev.internet-thinking.com.au/subscribe/

Filed Under: Information, News Tagged With: Great Barrier Reef, sea level change

Lady Elliot, Temperature Trends

August 3, 2019 By jennifer

THERE is concern that if global warming exceeds 2°C per 100 years, there will be catastrophe. There are various ways of anticipating this… I tend to favour the empirical. Indeed, running a ruler over a temperature series can be useful, if we want perspective.

Considering the maximum temperature record available for Lady Elliot Island — an isolated coral cay off the Australian east coast — and after running a trend line through the numbers, we find that we are almost at this tipping point of 2°C, as shown in Figure 1.

Figure 1. Maximum annual mean temperatures as measured at Lady Elliot Island charted for the period 1940 to 2018.

There has been a consistent annual temperature rise of 0.0195°C since 1940, which would translate into a rise 1.95°C per hundred years.

The situation appears even worse if we just consider temperatures from 1960. Then the temperature trend for Lady Elliot is more than 2°C per hundred years, as shown in Figure 2.

The mean annual maximum temperature series from the nearby Sandy Cape lighthouse has a very similar pattern for this period from 1960. There is more inter-annual variation in the temperature series from nearby Gayndah, which is typical of land series that will be more affected by droughts and floods.

Figure 2. Temperature change as measured by the annual mean maximum since 1960 at Lady Elliot and also nearby Gayndah and Sandy Cape Lighthouse

I’ve spent many years poring over temperature data from a diversity of locations across Australia, and what I’ve found is that when such records are extended back in time — even just a few decades — the overall temperature trend is quite different and ‘the catastrophe’ disappears.

The record for Lady Elliot Island only starts on 1 July 1939. To understand what temperatures were like in this region before then, we need to consider temperature measurements from neighbouring stations that begin in the late 1800s.

There are several weather stations within a 300 km radius of Lady Elliot Island that have long temperature records.

Locations within a 300 km radius of Lady Elliot with long and continuous series. Drawn by Jaco Vlok.

The temperature record as measured at the Gayndah Post Office (number 39039) actually begins in June 1893, and the record for Bundaberg (number 39015) in 1892, as shown in Figure 3. There is a single breakpoint in the early record for each of these two locations, marked by a circle when a Stevenson screen was installed.

Figure 3. Annual mean maximum temperatures for the 14 stations with long and continuous records within a 300 km radius of Lady Elliot. Drawn by Jaco Vlok.

Considering the longer records within the 300 km radius, maximum temperatures have sometimes fluctuated by more than 2°C within a few years. This is evident from the detail in the individual series in Figure 3. The more than 2°C variation in temperatures as measured at Gayndah between 1900 and 1904, for example, is more than the overall warming trend at Lady Elliot of 1.95°C per hundred years since 1940.

Maximum temperatures for Gayndah and Bundaberg spiked in 1915, as they did for all the other stations recording within a 300 km radius of Lady Elliot Island at that time.

So, we can perhaps assume it was also a relatively hot year at Lady Elliot Island … back in 1915. Perhaps it was as hot back then as it is now, which is quite hot considering the longer records. Then again the spike may have been a consequence of the land drought, and places like Sandy Cape Lighthouse and Lady Elliott less affected. There is no mean annual maximum value for Sandy Cape Light House (number 39085) for 1915 because of missing values … but these could be infilled (using regression and/or an artificial neural network), to better estimate the likely temperature history for this region over land and also sea.

It can be difficult separating out the individual series in Figure 3. The squiggly lines are a representation of individual annual mean maximum temperatures. In Figure 4, I plot these individual values for just the Gayndah Post Office (number 39039) from 1900 (after the breakpoint, only after the Stevenson screen was installed) and for Lady Elliot (number 39059) from the beginning. Both series are plotted with trend lines.

The overall temperature trend for Gayndah Post Office, considering this longer record, is just 0.38°C per hundred years, as shown in Figure 4. This contrasts significantly with the value of 2.58°C per hundred years when we plot the same values for Gayndah but only for the interval from 1960 to 2009, as shown in Figure 2.

Figure 4. Annual mean maximum temperatures as recorded at Gayndah (after installation of Stevenson Screen) and the entire record at Lady Elliot

Whenever I take the time to run a ruler over temperature series for any particular region and considering a long enough time period not artificially warmed by a combination of Urban Heat Islands (UHI) and homogenisation, I have trouble finding catastrophe. Rather I’m inspired by the extent of the available data and the degree of synchrony between the series that tend, if anything, to be simply moving sideways.

Lady Elliot Island. Photo credit Clint Hempsall.

____

This is the third post in my ‘GAT in the Hat’ series, which began when Huck suggesting we get on and develop a simple temperature index based on a good sample of well-sited stations. Jaco Vlok and I are working our way around Australia with such an index in mind … we are working anti-clockwise from Brisbane.

Thanks to the Australian Bureau of Meteorology for making all this data available at http://www.bom.gov.au/climate/data/

The feature image (very top of this blog post) is a plot of all the available maximum temperature data (from 59 weather stations) within a 300 km radius of Lady Elliot as 12-month moving averages, with the data compiled and plotted by Jaco Vlok.

This post was updated at midnight on 3rd August, with figures added, the picture changed, and the title modified …

Filed Under: Information Tagged With: temperates

Understanding Brisbane’s Temperature History (Part 1)

July 19, 2019 By jennifer

DECONSTRUCTION can be affirmation rather than questioning. Jaco Vlok and I have been deconstructing various temperature series from the Brisbane region with a view to developing an index that is an accurate, and affirming, representation of Brisbane’s temperature history.

To progress this work, we are making the following two recommendations, that concern the Australian National Archive:

RECOMMENDATIONS

1. The Australian National Archive needs to digitise the long temperature series from the mercury thermometer that was recording temperatures at the Brisbane airport (station number 40842) from 9 June 2004 until 3 September 2014, as shown in the Gantt chart. Only when this data is available will it be possible to begin to know if measurements from electronic probes now recording official temperatures, have any equivalence with temperature measurements from 100 years ago.

When there is an equipment change, there should be some overlapping data to enable comparisons … and also a new number. In contravention of its own policies the Bureau has made major equipment changes and yet kept the same station number.

2. The first government weather station at Brisbane (station number 40214) opened in 1840, which is 179 years ago. The daily recordings from this mercury thermometer should be There may be daily temperature readings and they may be archived in the Australian National Archive. This needs to be confirmed, and the daily maximum values digitised to enable the current record for Brisbane to be extended back in time.

For the period from 1840 to 1896 the mercury thermometer was housed in a Glaisher stand rather than a Stevenson screen.* It is unknown how the thermometers where housed before the installation of the Stevenson screen in 1896.

There will potentially need to be an adjustment when joining the series. Adjustments are currently made by the Australian Bureau of Meteorology to all the Brisbane series for the period from 1950, through the process of homogenisation.

BACKGROUND

There is intense interest in climate change as a cause, but perhaps not enough interest in the quality of the data underpinning all the rhetoric. If we really care about this issue of global warming then we will want to know exactly how much temperatures have really warmed over recent decades. So, we will need to know the equivalence of temperatures now measured using electronic probes with temperatures previously measured using mercury thermometers.

The Australian Bureau of Meteorology measures temperatures from electronic probes that have not been calibrated relative to the mercury thermometers that were once used. Further, the Bureau makes adjustments to temperatures after they have been measured, recorded and archived in the creation of the new official temperature series, known as ACORN-SAT. These homogenised series are then used to calculate national and global averages.

Mark Huxley Akin (Huck) has suggested that we just get on and start constructing regional climate indices based on real and unadjusted/unhomogenised temperature series.

Specifically, he has suggested we use “a good sample of well-sited stations with long histories”, using the analogy of the Dow Jones Average. He writes:

No one ever tries to establish an impossible-to-define ‘average stock price’— including many stocks of doubtful provenance — and nobody cares. These pre-selected indexes of certain representative stocks, that are then followed over a long time-span, tell investors what they really want to know: how the market moves over time, relative to itself.

It is the case that for some Australian locations there are long consistent records through much of the twentieth century. For example, temperature data recorded at Brisbane (station number 40214) are currently publicly available from January 1887 to March 1986. This is one of the longest continuous high quality temperature records for anywhere in the Southern Hemisphere with measurements taken using the same mercury thermometer at the same place every day (although the Glaisher stand was replaced with a Stevenson screen in 1896).

Problems begin, however, around the late 1980s, when there are site moves and equipment changes. In the case of Brisbane, in order to continue any index beyond 1986, it is going to be necessary to join different temperature series and yet there is no data to quantify the equivalence of the measurements from electronic probes, mercury thermometers and also thermohygrographs — that were also used at Brisbane.

The first ever detailed list of the equipment used to measure temperatures at Brisbane has just been compiled by Jaco Vlok, as shown in master_table4 which is a work-in-progress.

BRISBANE MAXIMA IN THE RAW

According to the available metadata, maximum temperatures were measured at Brisbane (40214) from January 1840 until July 1994. There is only data available online, however, to construct an annual mean series from 1887 to 1985, as shown in Figure 1. For most of this record, from 1896, temperatures were recorded using the same mercury thermometer in a Stevenson screen. This very long continuous record does NOT show a pattern of warming consistent with human-caused global warming theory, Figure 1.

Figure 1.Maximum temperatures recorded at station number 040214, in a Stevenson screen with a mercury thermometer as downloaded from the Bureau’s ADAM database.

Consistent with many other such high-quality and long continuous records from Australia, this maximum temperature series shows cooling to about 1960 and then warming.

THE OFFICIAL BRISBANE RECORD

The official temperature record for Brisbane is from a combination of two official Bureau series both recorded at the airport (Series 40223 and 40842), and subsequently homogenised. The homogenisation method is outlined in general terms in a peer-reviewed article by Blair Trewin published in 2013.

In the case of Brisbane, Blair Trewin has decided to begin the official record in 1950, which is presented as a bar chart at the Bureau of Meteorology website, as shown in Figure 2.

Figure 2. The official annual mean maximum temperature record for Brisbane, as displayed at the Bureau of Meteorology website.

The temperature series used to construct this bar chart are shown in Figure 3, as well as the resulting ACORN-SAT versions 1 and 2.

ACORN-SAT version 2, as shown in Figure 3, represents the official record for Brisbane and data from this series is incorporated into international datasets.

Figure 3. The temperature series that are homogenised by Blair Trewin and then used to create the ACORN-SAT series, also shown.

The latest official ACORN-SAT maximum temperature series for Brisbane (version 2 in Figure 3) suggests warming of 0.9 degrees Celsius per century.

To be clear, this temperature series does not show the early measurements for Brisbane, so it does not show how hot temperatures were in 1902 and then again in 1912 and 1915. The official record also does not show the period of overall cooling, to about 1960.

CHANGING SITES AND CHANGING EQUIPMENT

It is a fact that understanding the true temperature history of a place can be difficult because of: site moves, changes in equipment, changes in the method of recording for the same equipment, and homogenisation of the raw data.
A true representation of temperatures over the last 100 years for Brisbane would not ignore the long series beginning in 1840. Nor would a true representation gloss over the many equipment changes particularly since 1995, as shown in the first Gantt chart, and that Jaco Vlok has began to document in Table 1.

Since 1996 the Australian Bureau of Meteorology has been transitioning away from the use of traditional mercury thermometers to electronic probes in automatic weather stations for the measurement of maximum temperatures. This is a major change in equipment — a major change in how temperatures are measured — yet when this change occurs the Bureau keeps the same station number and just continues to add to the previous record.

This is in contravention of its own policies that clearly state that a new station number should be assigned, and that there should be at least three years (preferably five) of overlapping/parallel temperature recordings at the same location.

This parallel data exists for a limited number of stations, but the Bureau has so far not made the data accessible. Much of it is currently held by the Australian National Archive as manual recordings into observation books. The numbers need to be digitised so that we can see whether or not the measurements from the electronic probes are comparable to the measurements from the mercury thermometers.

After much effort, I obtained parallel data for Mildura – as thousands of photographed records. Manual transcribing of some of the data has established that the current electronic probe at Mildura often records 0.4 degrees Celsius hotter — for the same weather. The first electronic probe at Mildura actually recorded cooler. So, the custom-built probes installed sequentially at Mildura have different time constants. It was only possible to establish this after the parallel data was provided to me, and I began an analysis of some of the manually transcribed data.

We know that since 1996 the temperature record for the Brisbane airport (station number 040842) actually represents measurements from an electronic probe, not a mercury thermometer. We don’t know what the time constant is for this probe. We do know that there is parallel data available from 14 February 2000; that is temperature measurements taken from a mercury thermometer in the same shelter (Stevenson screen).

We know that there have been four different probes used at the Brisbane airport site, as shown in Table 1.
The Bureau has not published the time constants for these probes. Depending on the time-constant, a probe may be much more sensitive to temperature change than a mercury thermometer and thus record warmer temperatures for the same weather.

APPROPRIATE QUALITY ASSURANCE

Breaking down the Bureau’s series into their component parts and then plotting the available data on one chart, can give an indication of temperature change since 1897.

The extent to which the many different Brisbane series move in synchrony suggests they are an accurate representation of climate variability and change for this region, as shown in Figure 4. Consider, for example, the first three records in the table for the period from 1950 to 1986; including the Brisbane Regional Office (40214), Brisbane airport (40223) and Amberley (40004) series: they generally move in unison but do not show a consistent warming trend.

At the moment this is all a work in progress, with the labels for the series charted in Figure 4 not yet corresponding to the new codes/numbers in Table 1.

Figure 4. The longest continuous temperature series from the Brisbane regions, segmented by equipment and also when there was a site move.

MOVING FORWARD

Brisbane’s temperature record could form the basis of a new index of temperature change. The construction of such an index would be aided by the provision of parallel data, that is data from both a mercury thermometer and electronic probe recorded at the same time and place.

Specifically, the most useful data right now would be the mercury thermometer recordings from the Brisbane airport (station number 40842) from 9 June 2004 until 3 September 2014, as shown in the Gantt chart. This information is held by the Australian National Archive and needs to be made publicly available, and digitised.

*****
The image featured at the top of this blog post is from https://www.slq.qld.gov.au/blogs/jol/inclement-wragge-pioneer-weather-forecaster. It shows Clement Wragge, Government Meteorologist for Queensland, with temperature recording equipment, and the Brisbane Tabernacle Baptist Church in the background.

I would like to acknowledge all the advice from Lance Pidgeon regarding ‘Brisbane’ over the years. He will also be acknowleged in the more detailed report that Jaco and I are working-up.

Also, the final recommendations in this report, and the nature of our index may be informed/improved by your comments (and Lance’s comments/input) in the following thread.

Filed Under: Information Tagged With: temperates

More Government Regulation Won’t Save the Great Barrier Reef from Scientists — or Politicians. Oink.

July 16, 2019 By jennifer

THE idea that the Great Barrier Reef is in need of saving from catastrophe is popular, especially among academics and politicians. In 2003, I published an article in the IPA Review entitled ‘Deceit in the Name of Conservation’ concerning the then Queensland Premier and Chief Scientist. In an earlier article entitled ‘WWF says Jump, Governments ask How High’ I explained the extent to which there was collusion within members of a Reef Protection Taskforce, that including activists and the CSIRO, to the extent that they felt a need to invent evidence of damage to the reef — least none existed.

Former Prime Minister Malcolm Turnbull approved a $443 million grant to the tiny Great Barrier Reef Foundation. That grant includes an allowance of up to $86 million for ‘administration’.

Those with a belief in the general competence of government and academics might assume that there are some big questions reef scientists have prioritized and are in the process of answering through their reef research. But. It is perhaps more a case of individual researchers confirming the end is nigh in accordance with the consensus, while denying Nemo, his corals and the crystal-clear blue waters that is the reality at 319 percent of this deep nature … that is for those who still put their heads under the water without drowning from a ladder while entangled in a fishing net.

The Queensland Liberal National Party (LNP) passed a resolution at its conference on the weekend to establish an ‘Office of Science Quality Assurance’ to check the science that is being used for policy decisions — with the push for the creation of this office coming from those now very concerned about yet more regulation that could mean the end of the sugar industry as a proposed solution to saving the reef from ruin.

The conference was attended by many politicians, and they all spend much more time on Twitter than ever visiting the Great Barrier Reef.

In bureaucratic speak such an ‘office’ could mean almost anything, but usually an ‘office’ is just a branch of a government department. Somewhat like a polp within a corallite that is anchored to the colony for better or worst as sea levels fall.

Here is my mother, then Joan Edith Pearce, standing knee deep at the Great Barrier Reef in 1955 before coral bleaching was an issue … this now almost 90 year old great grandmother was photographed in front of a bleached micro atoll almost certainly a colony of Porites cylindrica that could be described as already dead on top from exposure to falling sea levels back in the mid-twentieth century with the top of the Porites colony perhaps regularly pruned by heat, cold and rain.

This ‘Office of Science Quality Assurance’ may pride itself on its independent advice.  For example, Finance and Treasury sometimes give independent advice which may conflict with what the Cabinet and the Government wants to do.  Such advice is usually ignored.  This is the reason there are Cabinet-in-Confidence laws: to prevent publication of such internal discussions and possibly differing views. 

There have already been commissions set up by government specifically to investigate corruption within institutions and organisations — even universities that undertake reef research in Queensland.

In facts claims of the need for quality assurance, could be a euphemism for ‘the scientists are taking the money and just making-stuff-up’.

Presently each Australian state has an anti-corruption commission. In Queensland there is the Crime and Corruption Commission (QCCC). The core function of this office is to investigate such allegations.

Indeed this branch of the Queensland government — with the grand title ‘Commission’—has far reaching powers to compel testimony and examine evidence. The QCCC actually receives thousands of complaints each year concerning misconduct by politicians, government officers even scientists — but finds time to investigate less than 5 percent of what is lodged by the tax-payers who funds this office/commission, as well as all the reef research.

The other 95 percent of the complaints lodged annually at the QCCC are referred straight back to the organisation against which the complaint has been lodged!

So, if you as a citizen of Queensland lodge a complaint against the Great Barrier Reef Marine Park Authority, for example, chances are that you will have your complaint investigated by — the Great Barrier Reef Marine Park Authority.

I know of a complaint of corrupt conduct lodged against a Queensland university (not James Cook University) by a former staff member in about 2016 that was immediately referred back to that same Queensland university. Despite all the evidence meticulously complied by the well-qualified former staff member concerning their misconduct, that university’s management determined that it simply did not have a case to answer.

Concerned that his detailed allegations had ended-up back with her university management that wouldn’t let him back on the ladder, the former staff member made a ‘Right to Information Request’ to the QCCC. He wanted to know how often this was the course of action, and how effective such an approach might be — essentially asking the vixens to inspect the chickens, dead and alive.

The QCCC responded that there was no relevant documentation at all. To be clear the Queensland Crime and Corruption Commission has never undertaken an assessment of the effectiveness of their complaints referral process. Yet this is where 95 percent. of the complaints from Queensland citizens reside.

This same commission, set up by government to provide some oversight of government, including government science at universities, has an annual budget of more than $60 million.

The Royal Commission into misconduct in the Banking, Superannuation and Financial Services found these non-government organisations also had oversight committees, and the committees were often aware of serious misconduct and possible criminal behaviour impacting on customers. Yet they mostly failed to do anything about it: they failed to properly self regulate.

Previously, the Royal Commission into Institutional Responses to Child Sexual Abuse in Australia uncovered that senior church officials were aware of sometimes hundreds of individual cases of abuse, yet their response though internal investigation was denial extending over the decades as victims suicided.

So, why would the LNP — currently the opposition government in Queensland — think that an ‘Office of Science Quality Assurance’ within a government department or other, will be able to make a difference to research research – or the plight of sugarcane growers who happen to farm next to the Great Barrier Reef?

Investigation into the veracity and quality of Great Barrier Reef scientific findings, is going to be infinitely more difficult than an investigation into a transaction between the Commonwealth Bank and yet another customer looking for some help with their superannuation.

Research institutions across Australia, including the Great Barrier Reef Marine Park Authority, the ARC Centre for Excellence and the Australian Institute of Marine Science are now as conformist and corporatist as banks — while almost totally dependent on government funding but under no obligation to archive their data.

The idea that these government-institutions run by bureaucrats (each on a ladder) will do anything except ensure such an ‘Office of Science Quality Assurance’ endorses the research that they manage, while squashing dissent, is so naive as to be dangerous.

The term Fourth Estate is sometimes used with reference to the mainstream media, suggesting they are as important as the three branches of government: legislative, executive and judicial for the correct functioning of a democracy. But we know they are as wedded to the idea the Great Barrier Reef is ruin, as Barrack Obama who, also, has never visited it.

There is a need for a revolution: for individuals within governments to become accountable again, for individual scientists to interest themselves in matters of truth, and for individual journalists to take an interest in their evidence.

Instead we increasingly persist in a society where legitimacy resides only with those embedded in such institutions that are increasingly conformist and corporatist — intent on limiting the potential of the individual particularly the individual who dissents. Through constant negotiations — mostly behind closed doors — the special interests of reef research charities and renewable energy advocates, alike, are growing.

Regulation and oversight of government by government does not work anymore — if it ever did.

The best response to the current corruption so obviously now embedded in Great Barrier Reef research would be for the LNP to pass a motion to severely restrict tax payer funding to those so animated by the prospect of reef ruin.

This could potentially limit the waste, and deceit — and who really would miss them? Only politicians who must save things, and journalists too lazy to find real stories — and to check if there really is coral beyond that mud flat to the immediate south of Bowen.

The corporatist culture that increasingly rules Queensland means an ‘Office of Science Quality Assurance’ within any branch of this state government, as proposed by the LNP on the weekend, will only inevitably end-up another brick in the wall against creativity, innovation and independent thought … all so important for the progress of science.

Indeed, all our science is primitive and childlike when measured against the reality of the resilience of the Great Barrier Reef — that has existed for 10,000 years despite floods, droughts and climate change.

There are corals, including so much Porites cylindrica, the other side of this mud flat but for the sake of fake news so many reef researchers deny it.

***
The feature image is by The National Archives UK – Animal Farm artwork, No restrictions.

Filed Under: Information Tagged With: Great Barrier Reef

  • « Go to Previous Page
  • Go to page 1
  • Interim pages omitted …
  • Go to page 12
  • Go to page 13
  • Go to page 14
  • Go to page 15
  • Go to page 16
  • Interim pages omitted …
  • Go to page 445
  • Go to Next Page »

Primary Sidebar

Recent Comments

  • Ian Thomson on Vax-ed as Sick as Unvax-ed, Amongst My Friends
  • Dave Ross on Vax-ed as Sick as Unvax-ed, Amongst My Friends
  • Dave Ross on Vax-ed as Sick as Unvax-ed, Amongst My Friends
  • Alex on Incarceration Nation: Frightened of Ivermectin, and Dihydrogen monoxide
  • Wilhelm Grimm III on Incarceration Nation: Frightened of Ivermectin, and Dihydrogen monoxide

Subscribe For News Updates

  • This field is for validation purposes and should be left unchanged.

November 2025
M T W T F S S
 12
3456789
10111213141516
17181920212223
24252627282930
« Jan    

Archives

Footer

About Me

Jennifer Marohasy 
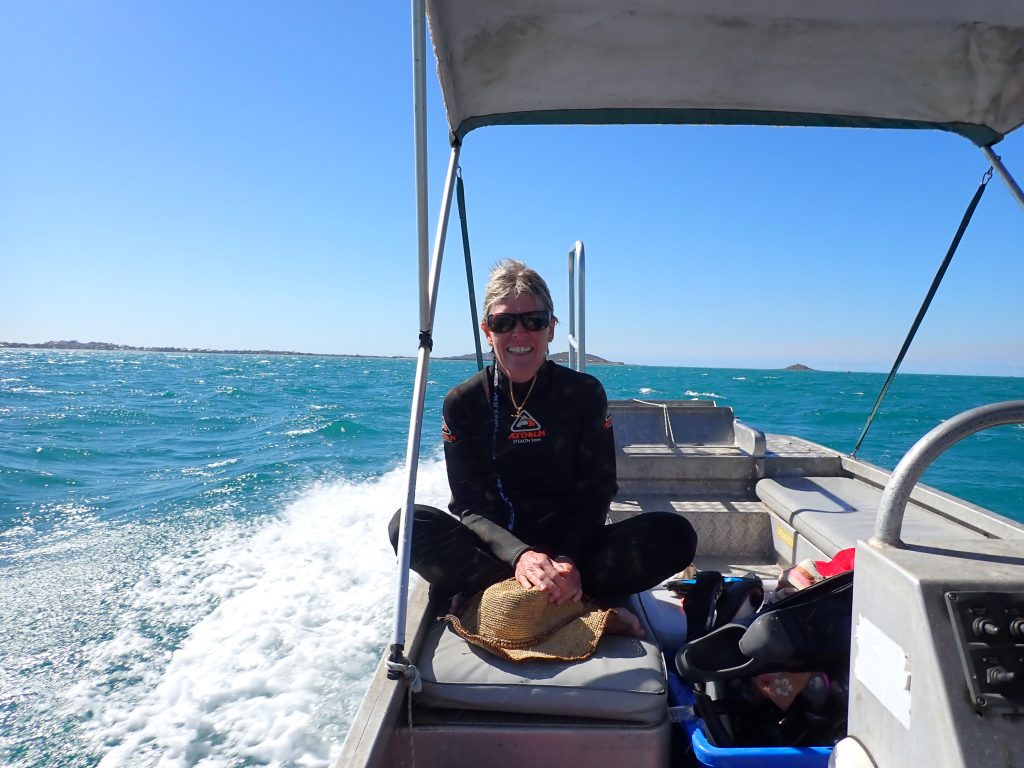
Jennifer Marohasy BSc PhD has worked in industry and government. She is currently researching a novel technique for long-range weather forecasting funded by the B. Macfie Family Foundation. Read more

Subscribe For News Updates

Subscribe Me

Contact Me

To get in touch with Jennifer call 0418873222 or international call +61418873222.

Email: jennifermarohasy at gmail.com

Connect With Me

  • Facebook
  • LinkedIn
  • RSS
  • Twitter
  • YouTube

Copyright © 2014 - 2018 Jennifer Marohasy. All rights reserved. | Legal

Website by 46digital