• Skip to primary navigation
  • Skip to main content
  • Skip to primary sidebar
  • Skip to footer
Jennifer Marohasy

Jennifer Marohasy

a forum for the discussion of issues concerning the natural environment

  • Home
  • About
  • Publications
  • Speaker
  • Blog
  • Temperatures
  • Coral Reefs
  • Contact
  • Subscribe

jennifer

After the Tragic Wildfires: History is Rewritten or Forgotten

January 13, 2020 By jennifer

The infernos of January 2020 will be remembered for destroying so much of southeastern Australia. I weep for the burns’ victims. So many people and so much wildlife in so much pain.

In terms of area of land burnt, these last few weeks may be recorded as unprecedented. This has everything to do with our mismanagement of the landscape, including the lack of hazard reduction burning especially in eucalyptus forests.

We were warned in the report from the 1939 Royal Commission by Judge Leonard Stretton, and in the more than 18 major inquiries since, forests are potentially dangerous and explosive places. Fuel loads must be kept within acceptable limits.

Blaming the recent fires on climate change is to rewrite our temperature history, something the Australian Bureau of Meteorology has been doing for some time. This has involved the:

  1. remodelling of measured values
  2. addition of hotter locations to only the most recent years in the compilation of a national average trend
  3. transition to electronic probes that are designed to record hotter for the same weather, and
  4. deleting of the hottest day in the official record, which was January 3, 1909.

These misdeeds have all been comprehensively documented, yet the current government turns a blind eye, while referring the matter of a firefighter who claims an Indigenous heritage to the Australian federal police. It is as though we are ruled over by a political elite more interested in continuing subsidies to electricity companies, and continuing funding to corrupt coral reef researchers – both of which have a vested interest in catastrophe – rather than listening to practical solutions to these and other major environment issues currently confronting Australia.

BUSHFIRE HISTORY, REMEMBERING JANUARY 1939

The “Report of the Royal Commission to inquire into the causes of and measures taken to prevent the bush fires of January 1939 and to protect life and property and the measures to be taken to prevent bush fires in Victoria and to protect life and property in the event of future bush fires” begins:

In the State of Victoria, the month of January of the year 1939 came towards the end of a long drought which had been aggravated by a severe hot, dry summer season. For more than twenty years the State of Victoria had not seen its countryside and forests in such travail. Creeks and springs ceased to run. Water storages were depleted. Provincial towns were facing the probability of cessation of water supply. In Melbourne, more than a million inhabitants were subjected to restrictions upon the use of water.

“Throughout the countryside, the farmers were carting water, if such was available, for their stock and themselves. The rich plains, denied their beneficent rains, lay bare and baking; and the forests, from the foothills to the alpine heights, were tinder. The soft carpet of the forest floor was gone; the bone-dry litter crackled underfoot; dry heat and hot dry winds worked upon a land already dry, to suck from it the last, least drop of moisture. Men who had lived their lives in the bush went their ways in the shadow of dread expectancy. But though they felt the imminence of danger they could not tell that it was to be far greater than they could imagine. They had not lived long enough. The experience of the past could not guide them to an understanding of what might, and did, happen. And so it was that, when millions of acres of the forest were invaded by bushfires which were almost State-wide, there happened, because of great loss of life and property, the most disastrous forest calamity the State of Victoria has known.

“These fires were lit by the hand of man

“Seventy-one lives were lost. Sixty-nine mills were burned. Millions of acres of fine forest, of almost incalculable value, were destroyed or badly damaged. Townships were obliterated in a few minutes Mills, houses, bridges, tramways, machinery, were burned to the ground; men, cattle, horses, sheep, were devoured by the fires or asphyxiated by the scorching debilitated air. Generally, the numerous fires which during December, in many parts of Victoria, had been burning separately, as they do in any summer, either ‘under control’ as it is falsely and dangerously called, or entirely untended, reached the climax of their intensity and joined forces in a devastating confluence of flame on Friday, the 13th of January.

“On that day it appeared that the whole State was alight. At midday, in many places, it was dark as night. Men carrying hurricane lamps, worked to make safe their families and belongings. Travellers on the highways were trapped by fires or blazing fallen trees, and perished. Throughout the land there was daytime darkness.”

THE IMPORTANCE OF HAZARD REDUCTION BURNING

Just last week, at the height of the January 2020 bushfire emergency, Minister for Home Affairs Peter Dutton referred a complaint against a firefighter, who allegedly falsely claims Aboriginal heritage, to the Australian federal police. I have no opinion on Bruce Pascoe’s lineage, but I do know that the Mob he identifies with have real solutions to our recurrent bushfire tragedies. Their culture has a long history of land management through the expert use of fire as a tool to create visually pleasing and practical mosaics resistant to the spread of wildfires.

Bruce Pascoe’s book Dark Emu draws from the more technical work by Bill Gammage entitled “The Biggest Estate on Earth”. This tome explains how Aborigines actively and skilfully managed the land in a far more systematic way than has ever been acknowledged. And I know, from my time spent reading original sources at the South Australian Museum about the Yaraldi of the Lower Murray River, that there were also complicated systems of governance, with a focus on a sustainable harvest and the storage of food.

Judge Stretton’s 1939 report also noted:

When the early settlers came to what is now this state [of Victoria], they found for the greater part a clean forest.Apparently, for many years before their arrival, the forest had not been scourged by fire … Their canopies had prevented the growth of scrub and bracken to any wide extent. They were open and traversable by men, beasts and wagons. Compared to their present condition, they were safe” (p. 11).

While quick to refer Bruce Pascoe, who is best known for his unorthodox perspective on Aboriginal history, to the federal police, Minister Dutton and his government have over a very long period of time turned a blind eye to the rewriting of Australia’s historical temperature record by Blair Trewin and David Jones of the Australian Bureau of Meteorology. The work of Trewin and Jones underpins the notion of an unprecedented climate emergency, when the real issues are perhaps management of fuel loads in forests and current resourcing.

Indeed, now absurdly corralled by the climate change meme, Prime Minister Scott Morrison is actively promoting the need for yet another Royal Commission as though this will prevent future bush fire tragedies. Yet recommendations of previous Royal Commissions have never been implemented. For example, a hazard reduction burn across at least 390,000 hectares each year was recommended for the state of Victoria.

It is because “The Elites” don’t trust the work of practical land managers, whether that be thinning young forests to ensure that a proper over-storey canopy develops, or adopting straight-forward hazard reduction burningprogrammes. Climate change may be a convenient scapegoat, but it will not protect our land into the future.

HOTTER AND DRIER SUMMERS

Sunday morning on national television the Prime Minister said a Royal Commission into “the killer bushfire season” is necessary and reiterated claims that the nation is facing a “new normal”, with more severe natural disasters on the way; he said he would be seeking more powers to allow the Australian Defence Force to respond more quickly.

Bill Gates has famously said that if you can’t measure it you can’t manage it, and that fundamental to improvement is the capacity to accurately measure.

Yet we have a situation where key statistics are either remodelled or ignored.

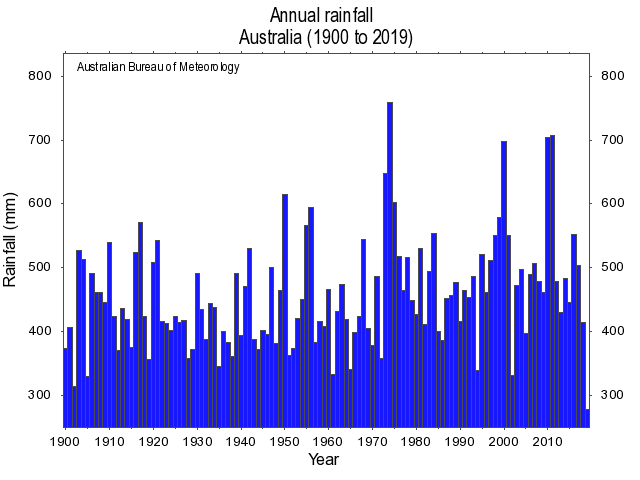
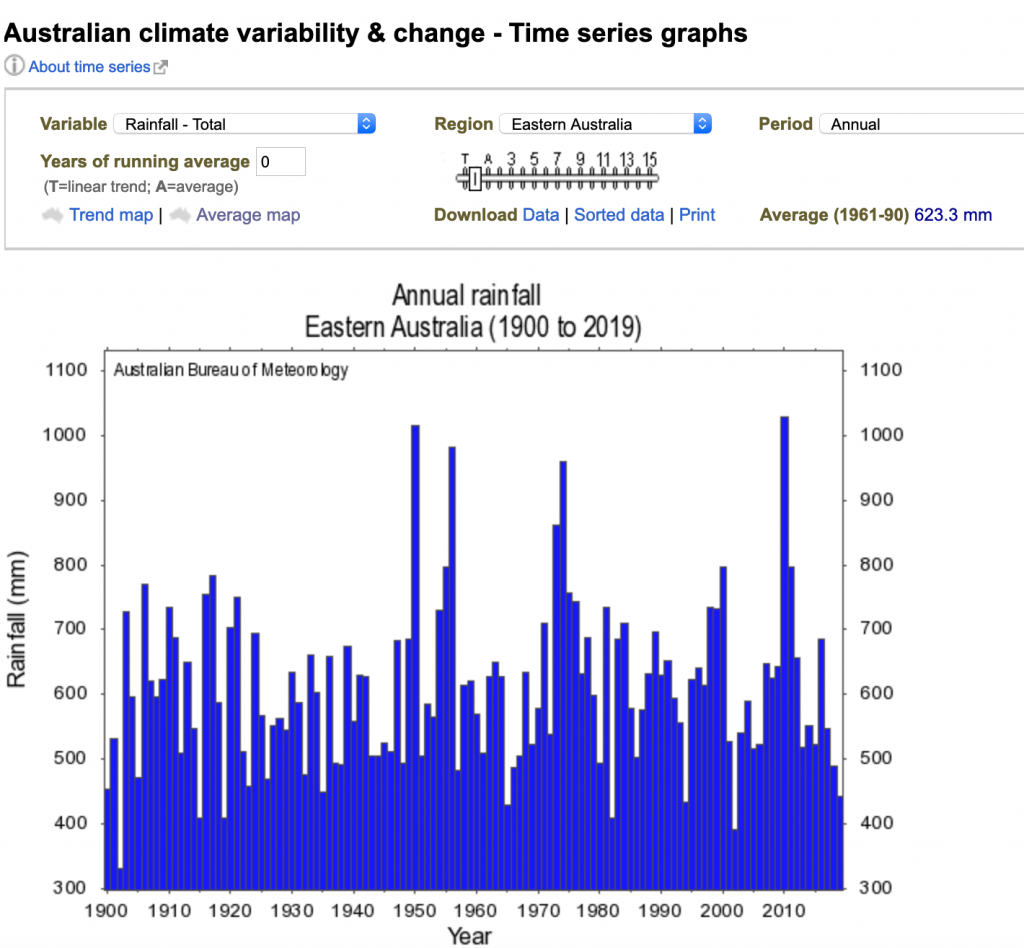
Mr Morrison mentioned hotter and drier summers in his television address. The historical record shows that the land mass of Australia is not drying out. Last year, 2019, was exceptionally dry. But the long-term trend is not towards a drier continent but rather we have on average had consistently wetter years since the 1970, as shown in Figure 1.

Figure 1. Annual average rainfall for Australia, 1900 to 2019.

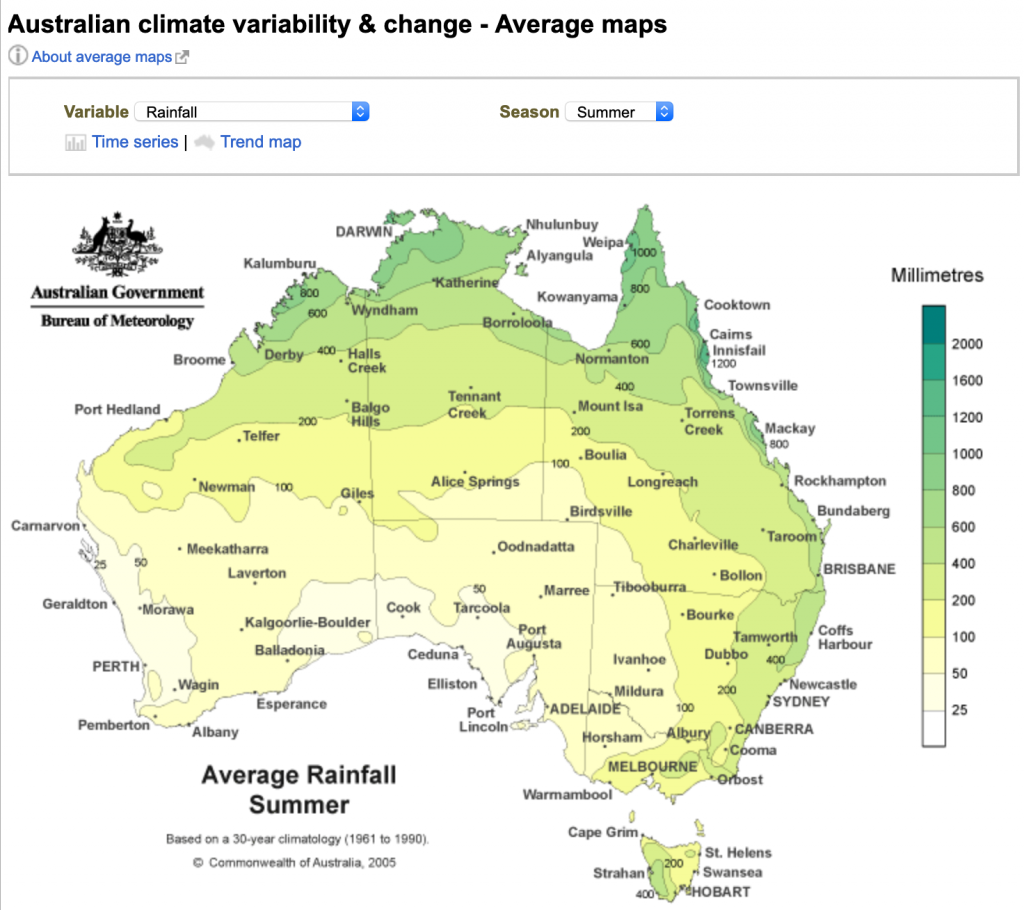
It is also the case that summers are not getting drier, as shown in Figure 2.

Figure 2. Average summer rainfall since 1900.

According to the Bureau, recent summers have been hotter, but such claims would not pass scrutiny if assessed, for example, for inclusion in the Guinness Book of records. This is because of all the changes to the way temperatures are now measured.

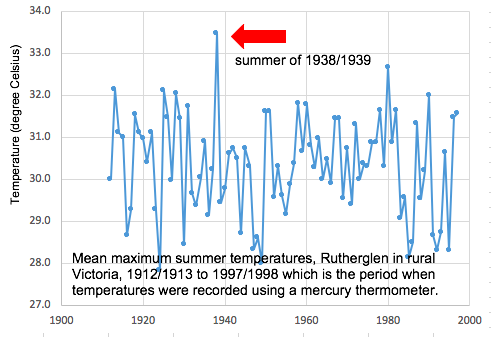
The Rutherglen agricultural research station has one of the longest, continuous, temperature records for anywhere in rural Victoria. Minimum and maximum temperatures were first recorded at Rutherglen using standard and calibrated equipment back in November 1912. Considering the first 85 years of summer temperatures – unadjusted, as in not homogenised – the hottest summer on record at Rutherglen is the summer of 1938–1939.

Figure 3. The hottest summer at Rutherglen was the summer of 1938-1939. This chart only extends to the summer of 1997-1998. Since January 1998 temperatures have been measured with a electronic probe and it is impossible to know whether it is measuring hotter or colder than the original mercury thermometer, because the Bureau makes none of this information public.

At Rutherglen, the first big equipment change happened on 29 January 1998. That is when the mercury and alcohol thermometers were replaced with an electronic probe – custom built to the Australian Bureau of Meteorology’s own standard, with the specifications still yet to be made public.

According to Bureau policy, when such a major equipment change occurs there should be at least three years (preferably five) of overlapping/parallel temperature recordings. Except the mercury and alcohol thermometers (used to measure maximum and minimum temperatures, respectively) were removed on exactly the same day the custom-built probe was placed into the Stevenson screen at Rutherglen, in direct contravention of this policy.

The policy implications are significant, far more significant than Bruce Pascoe paraphrasing some text from the early explorers to make a point, while claiming an Aboriginal heritage.

In 2011, the Bureau made further changes to how it measures temperatures in that it stopped averaging one-second readings from the probe at Rutherglen over one minute. The maximum temperature as recorded each day at Rutherglen is now the highest one-second spot reading from the custom-built probe. That is correct – spot reading.

Across Australia non-standard methods of measuring (spot readings) from non-standard equipment (custom-built probes) make it impossible to establish the equivalence of recent temperatures from Rutherglen – or any of the Bureau’s other 695 probes in automatic weather stations – with historical data.

REWRITING OUR TEMPERATURE HISTORY

It was at the Sydney Institute in 2014 that I first began to detail the extent to which the Australian Bureau of Meteorology has rewritten our temperature history to create the impression of catastrophic global warming using the technique of homogenisation. This is in addition to the issues with calibration.

Back in 2014, I showed how temperatures are changed in the ACORN database, and not by a small amount. I showed that the recorded values — the actual measurements — are often changed by more than a degree from the original measurements to remove the cooling trend from at least 1940 to 1960. Cooling the past, makes the present appear hotter.

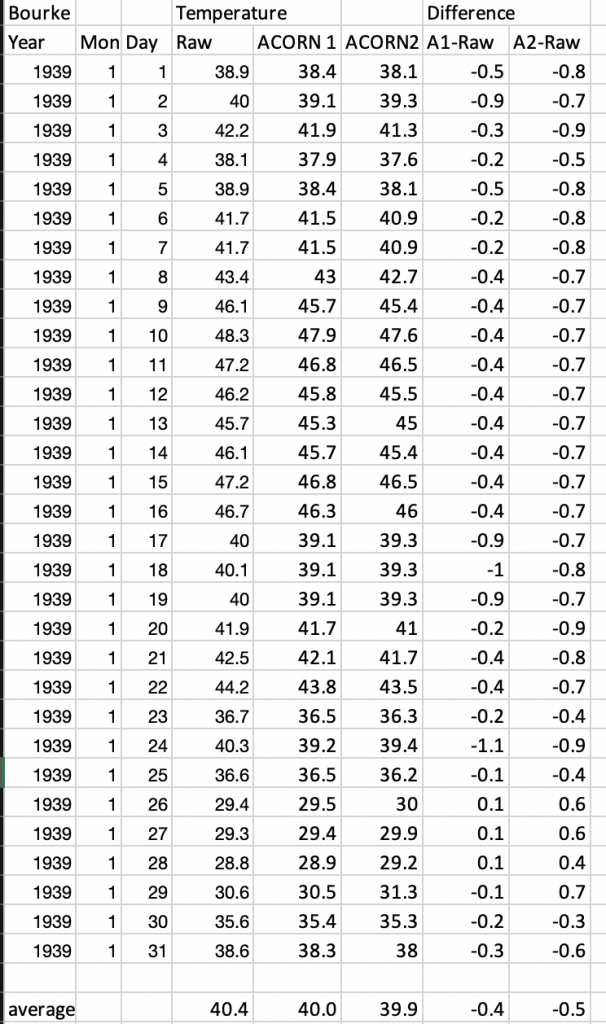
If we consider, as an example, Bourke in western New South Wales, the temperature as measured using a mercury thermometer in a Stevenson Screen at the official recording station was 38.9 degrees Celsius.  This value was changed to 38.4 in the first official ACORN database, and then dropped-down by a further 0.3 degrees when the Bureau published version 2 of ACORN.

Table 1. Temperatures actually recorded at Bourke in January 1939, and temperatures then changed for the first version of ACORN, and then changed again for the next version of ACORN.

This is in addition to the more recent issues that I have uncovered, issues caused by the transition to electronic probes without due regard to calibration. In the case of Mildura, I have shown that the official electronic probe is regularly recording 0.4 °C hotter than the mercury thermometer in the same shelter.

Then there is the issue of how all the temperature series are added together.

Concerned that the Bureau made many errors in its calculation of the mean Australian temperature, Merrick Thomson, a retired accountant, asked questions in a submission to a government inquiry some years ago, specifically:

  1. Why was the mix of stations changed with the transition to ACORN, and why was this not explained and declared, particularly given that it has resulted in a large increase in theannualtemperature for Australia.Hecalculates this was 56 °C.
  2. What criteria is used to determine whether or not a station becomes part of the national network, and specifically, why was the very hot location of Oodnadatta added to the national network in 2011?

His submission was never acknowledged, and his questions never answered.

So, when the Bureau announce that last year was the hottest on record we can have absolutely no confidence that this is true.  The charts they show, and values they present are totally contrived.

I recently explained to Chris Smith on Sky News that the hottest day ever recorded in Australia using standard equipment at an official recording station is 51.6 °C at Bourke in January 1909. I also explained that this legitimate record has been expunged from the record by Blair Trewin at the Bureau.

Over the last six years I have provided more and more evidence — some of it reported by Graham Lloyd and published in The Australian — which shows Blair Trewin, under the direction of David Jones, is falsely rewriting our temperature history.But nothing has ever been done about this. Rather, successive state and federal governments have let the meme of human-caused catastrophic global warming grow, while neglecting the forests.

I have it on good advice that the detail of my accusations against the Bureau have been discussed by the Australian Cabinet, including in the presence of Peter Dutton and Scott Morrison. At that time then prime minister Tony Abbott was apparently keen to have some sort of inquiry into the industrial-scale remodelling by Jones and Trewin through the process of homogenisation. But his efforts were thwarted by Greg Hunt and Julie Bishop.

REWRITING THE HISTORY OF THE LOWER MURRAY RIVER

When it comes to really important practical environmental issues like restoring the Murray River’s estuary, they also all turn a blind eye.

The Tauwitchere sea dyke has destroyed the once abundant fishing grounds of the Yaraldi. This Mob once caught both Murray cod and also mulloway depending on the season; it is all detailed in the South Australian Museum. The solution to the dwindling fish stocks in the Lower Murray River is simple: remove the barrages and bring back the sea tide. Instead some locals complain of climate change.

Since 1941, the barrages have blocked 90 per cent of flows between the lakes and the South Ocean. Over the last decade, a new and false history and geography of the Lower Lakes, Coorong and the Murray’s mouth have been created. But so far, no government minister has ever rallied against this rewriting of history.

When I wrote a report about it, explaining all the benefits that could come from restoring the Murray River’s estuary, the Australian Broadcasting Corporation (our ABC), ran a campaign against me.

The restoration of the Murray River’s estuary would not only be good for the environment, but it would also free-up so much water for upstream farmers and firefighters.

ELITES RUN AUSTRALIA, BUT FOR HOW MUCH LONGER

For decades respected Aboriginal elders have been invited onto local bushfire management committees, only to find government-appointed chairpersons refusing to even record their advice. In the Dreaming active land management is so important, while a particular zeitgeist and red tape now most deliberately prevent it. Then there is the issue of adequate resourcing. So, much money is provided to science managers to fake news about the Murray River, the Great Barrier Reef and human-caused catastrophic climate change. Yet the real and pressing issues concerning management of weeds, feral animals, and fuel loads in forests is mostly ignored. Meanwhile, artificial constraints on commercial opportunities for the sustainable harvest of so much of our natural bounty, including kangaroos and crocodiles, are indirectly imposed by Hugh Jackman and other Hollywood celebrities who support campaigns led by Terri Irwin. Grahame Webb has spent a lifetime overseeing the successful resurgence of crocodile numbers in the Northern Territory, only to now be prevented from realising any commercial gain for his Aboriginal colleagues because of successful campaigning by Hollywood Elites.

As Bruce Pascoe writes in Black Emu:

Strangely, though, when Ross Garnaut, who prepared the climate-change policy for the Rudd Government in 2008, championed kangaroo farming as a way of conserving the land and cutting greenhouse gases, because cattle are greater polluters than motor cars, the press could hardly contain their contempt” (p. 53).

I’ve discussed the need to not only restore the historical temperature record, but also the need to restore the estuary of our longest river system, with Minister Simon Birmingham. But he tells me that there is no advantage in it for South Australia. Also, he has told me that the Australian Greens — effectively run by his mate and fellow South Australian Sarah Hanson-Young — would never support such an initiative.

I met with Sarah Hanson-Young back in 2011. She told me that while she sees some merit in the Murray River having an estuary, South Australian Greens and Liberals ‘will hold the line’ together on this one.

It is the case that here in Australia, just a few rule over us, and at the behest of their politics that has scant regard for the natural environment, and little more for the economy.

Contrary to the impression given by our ABC, quiet Australians of diverse lineage are not being heard, while the mostly white leadership across The Greens, Coalition and Labor parties together decide how key issues will be managed.

Worse, it is a fact that practical individuals who operate outside the current zeitgeist are hounded by our elites and our government.

Peter Ridd was sacked for telling the truth about the Great Barrier Reef under the watch of the current Coalition government. If Peter Dutton wants to be useful, he would refer Terry Hughes rather than Bruce Pascoe to the Australian federal police. Perhaps Minister Dutton has not yet heard about the latest revelation of misconduct from within the ARC Centre of Excellence for Coral Reef Studies at James Cook University?

The political Elite know there is a disproportionate influence from what is understood as the AGL* faction of the New South Wales Liberal party. It is this faction that not only ensures various subsidies for various energy sources, but also oversaw the taxpayer funded $443 million grant to the tiny Great Barrier Reef Foundation — to Malcom Turnbull’s mates. I heard not a slither of discontent from Minister Dutton on this, yet the faux research findings they sponsor directly and negatively impact all Australians.

There is a real need for Peter Dutton to make important referrals to the Australian federal police. Those who do fake science and attempt to pass it off as the truth, and those who remodel the historical temperature record to something completely different, need to be held to account.

The terrifying infernos of recent weeks are a wake-up call. It is time that the Prime Minister and all the Ministers in the current Australian Government showed some real leadership. They know the real issues, and they understand the politics. So, it is past time they climbed out from under the thumbs of the catastrophists embedded in our most important government-funded institutions. Stop taking orders from them, and start referring them to the Australian federal police.  Their misdeeds are significant.

____

* AGL Energy Ltd is an Australian listed public company involved in the generation and retailing of electricity for residential and commercial use.

***
UPDATE JANUARY 16, 2020

Adding an east coast of Australia rainfall chart, as requested by a couple in the thread. Whichever way you cut the data, Australian rainfall data does not show a drying trend, and for non-UHI affected inland sites the temperatures generally show cooling to about 1960, and then warming since. Its about as warm now as it was back more than 100 years ago. This is no consistent with lots of homogenised data from other places … but I think many sceptics and alarmists should spend more time with the data before forming their opinion.

Annual average rainfall for the east coast of Australia.

Filed Under: Information Tagged With: Bushfires, temperates

It has been hotter, fires have burnt larger areas

January 4, 2020 By jennifer

The word unprecedented is applied to almost every bad thing that happens at the moment, as though particular events could not have been predicted, and have never happened before at such a scale or intensity. This is creating so much Klonopin anxiety, because it follows logically that we are living in uncertain time: that there really is a climate emergency.

The historical evidence, however, indicates fires have burnt very large areas before, and it has been hotter.

Some of the catastrophe has been compounded by our refusal to prepare appropriately, as is the case with the current bushfire emergency here in Australia. Expert Dr Christine Finlay explains the importance of properly managing the ever increasing fire loads in an article in today’s The Australian. While there is an increase in the area of national park with Eucalyptus forests, there has been a reduction in the area of hazard reduction burning.

The situation is perhaps also made worse by fiddling with the historical temperature record. This will affect the capacity of those modelling bushfire behaviour to obtain an accurate forecast.

We have had an horrific start to the bushfire season, and much is being said about the more than 17 lives lost already, and that smoke has blown as far as New Zealand. Unprecedented, has been the claim. But just 10 years ago, on 9 February 2009, 173 lives were lost in the Black Saturday inferno. On 13th January 1939 (Black Friday), 2 million hectares burnt with ash reportedly falling on New Zealand. That was probably the worst bushfire catastrophe in Australia’s modern recorded history in terms of area burnt and it was 80 years ago: January 13, 1939.

According to the Report of the Royal Commission that followed, it was avoidable.

In terms of total area burnt: figures of over 5 million hectares are often quoted for 1851. The areas now burnt in New South Wales and Victoria are approaching this.

Last summer, and this summer, has been hot in Australia. But the summer of 1938-1939 was probably hotter. In rural Victoria, the summer of 1938-1939 was on average at least two degrees hotter than anything measured with equivalent equipment since, as shown in Figure 1.

Figure 1. Mean maximum summer (December, January February) temperatures as measured at Rutherglen in rural Victoria by The Australian Bureau of Meteorology for the period when mercury thermometers were used. Data unadjusted/not homogenised.

The summer of 1938-1939 was probably the hottest ever in recorded history for the states of New South Wales and Victoria. It is difficult to know for sure because the Bureau has since changed how temperatures are measured at many locations and has not provided any indication of how current electronic probes are recording relative to the earlier mercury thermometers.

Further, since 2011, the Bureau is not averaging measurements from these probes so the hottest recorded daily temperature is now a one-second spot reading from an electronic devise with a sheath of unknown thickness. In the United States similar equipment is used and the readings are averaged over five (5) minutes and then the measurement recorded.

The year before last, I worked with the Indonesian Bureau of Meteorology (BMKG), and understood their difficulty of getting a temperature equivalence between mercury thermometers and readings from electronic probes at their thousands of weather stations. The Indonesian Bureau has a policy of keeping both recording devices in the same shelter, and taking measurements from both. They take this issue very seriously, and acknowledge the problem.

The Australian Bureau of Meteorology has a policy of a three year period of overlap, yet the metadata shows that for its supposedly highest quality recording stations (for example Rutherglen), the mercury thermometer is removed the very same day an electronic probe is installed. This is a total contravention of the Bureau’s own policy, and nothing is being done about it.

I explained much of this to Australia’s Chief Scientist in a letter some years ago — neither he, nor the Bureau, deny that our current method of recording temperatures here in Australia is not covered by any international ISO standard. It is very different from methods currently employed in the United States and also Indonesia, and as recommended by the World Meteorological Organisation.

Then there is the issue of the remodelling of temperatures, I explained how this affects trends at Rutherglen in a blog post early last year.

The remodelling, that has the technical term of homogenisation, is a two-step process. With respect to the temperature maxima at Rutherglen, the Bureau identified a ‘statistically significant discontinuity’ in 1938–1939. Values were then changed.

It is somewhat peculiar that the Bureau did not recognise, in its process of remodelling the historical data for Rutherglen, that the summer of 1938-1939 was exceptionally hot because of drought, compounded by bushfires. Rather David Jones and Blair Trewin at the Bureau used the exceptional hot January of 1939 as an excuse for remodelling the historical temperature record at Rutherglen, with the changed values subsequently incorporated into international data sets.

These made-up values are then promoted by the United Nations’ International Panel on Climate Change (IPCC). This propaganda is then tweeted by Hollywood superstars like Bette Midler to The Australian Prime Minister.

After a recent Sky News Television interview that I did with Chris Smith several people have contacted me about the hottest day ever recorded in Australia. They have suggested it is 16th January 1889 being 53.1 degrees Celsius at Cloncurry in Queensland. A problem with this claim is that the temperature was not measured from within a Stevenson screen, though it was a recording at an official station. A Stevenson screen (to shelterer the mercury thermometer) was not installed by Queensland meteorologist Clement Ragge at Cloncurry until the next month, until February 1889.

The hottest temperature ever recorded in Australia using standard equipment (a mercury thermometer in a Stevenson screen) at an official recording station is 51.7 degrees Celsius (125 degrees Fahrenheit) at the Bourke Post Office on January 3, 1909.

We are all entitled to our own opinion, not not our own facts.

*****
The picture featured at the very top of this post is of grass trees at Scott River, Western Australia, taken in January 2007, following a “mild, patchy burn” by David Ward. David has contributed several articles on bushfire management to this blog, you can find some of the links here:https://jennifermarohasy.com.dev.internet-thinking.com.au/2009/04/the-mathematics-of-connectivity-and-bushfire/

Filed Under: Information Tagged With: Bushfires, temperates

No Data on Coral Growth Rates for 15 Years

January 2, 2020 By jennifer

CORALS are animals, closely related to jelly fish, but they differ in having a limestone skeleton. This is hard-stuff, calcium carbonate, and it can persist in the environment and provide an indication of changes in sea level, and also the growth rates of corals, over thousands of years.

Porites corals are typically used to estimate growth rates the Great Barrier Reef. I photographed the surface of this coral when I visited Bramston Reef with Peter Ridd in August 2019. It was so soft, like a carpet, but firm from the corallite: the limestone skeleton supporting individual coral polyps.

There are well established techniques for coring corals, and then measuring growth rates. But as Peter Ridd explains in the following article just published by The Australian, since 2005 there has been no systematic study* of coral growth rates at the Great Barrier Reef.

It is the case that lots of claims are made about declining calcification rates and also declining water quality. But the data is either missing or could actually tell quite a different story.

This is the first in a series of blog posts planned on what Peter is calling ‘The Coral Challenge’. Graham Lloyd has a companion piece, also in today’s The Australian.

Great Barrier Reef Truth May Be Inconvenient, But It Is Out There
By Dr Peter Ridd

We have no data of Great Barrier Reef coral growth rates for the last 15 years. Has growth collapsed as the Australian Institute of Marine Science claims?

Is the Great Barrier Reef (GBR) being affected by climate change, the acidification of the ocean, and the pesticides, sediment and fertiliser from farms? One way to tell is to measure the coral growth rates. Our science institutions claim that coral growth rates collapsed between 1990 and 2005 due to stress from human pollution. Remarkably, despite having data of coral growth rates for the last few centuries, there is no data for the last 15 years. We don’t know how the GBR has fared since 2005.

Corals have yearly growth rings similar to tree rings. By drilling cores from large corals, scientists can measure the growth rates over the life of the coral. The yearly rings are roughly 10 millimetres thick so a coral that is many meters across can be hundreds of years old. In a landmark study, the Australian Institute of Maine Science (AIMS) took cores from over 300 corals on the GBR and concluded that for the last three hundred years, coral growth was stable, but in 1990 there was an unprecedented and dramatic collapse of 15%.

With Thomas Stieglitz and Eduardo da Silva, I reanalysed the AIMS data and, in our opinion, AIMS made two major mistakes. The first was incorrect measurement of the near surface coral growth rings on most of the corals that were giving data from 1990 to 2005. After years of argument AIMS have begrudgingly agreed that they made this mistake. The other problems is that they used much smaller and younger corals for the 1990-2005 data compared with the mostly very large and old corals of the pre 1990 data: they changed their methodology and this is what caused the apparent drop at 1990. When we corrected this problem, the fall in growth rate disappeared.

AIMS continue to dispute this second error and still claim there was a worrying reduction in growth rate between 1990 to 2005. This disputed work is quoted in influential government documents such as the 2019 reef outlook report. I am not cherry-picking a minor problem. It is a fundamental problem with a keystone piece of GBR science.

We thus have a situation that arguably the most important data that tells us about the health of the GBR is highly questionable from 1990 to 2005.

What is far worse is that we have no data whatever since 2005.

The science institutions have not only failed to investigate probable major errors in their work, they have also failed to update measurement of this fundamental parameter while claiming, in increasingly shrill tones, that the GBR is in peril.

But ironically, this failure provides a fantastic opportunity: The Coral Challenge.

For the last 15 years we don’t know what growth rates have been. It is easy to fill in the missing data, and check the previous data, by taking more cores from the reef. AIMS have effectively stated that coral growth is falling at 1% per year. According to the AIMS curve, growth should now be 30% lower than it was in 1990 – a disastrous fall.

I predict it has stayed the same. Either way, it would be nice to know what has actually happened – is the reef really in danger or not?

Peter Ridd is predicating that when the data is finally analysed it will show little change in growth rates, perhaps some improvement. The Australian Institute of Marine Science (AIMS), in contrast, is predicting a significant fall in coral calcification rates.
Science is a method. The best test of competing theories, hypotheses and claims is with the data.

But a second and almost equally valuable outcome of measuring the missing data is that it will be an acid test of the trustworthiness of our major science institutions. AIMS have dug in their heels and denied they made a major methodological mistake. Let’s do the experiment and see if they are right, or untrustworthy. Same for me. If this measurement is done, and done properly, and it shows there has been a major reduction in coral growth rates, I will be the first to accept I was wrong and that there is a disaster happening on the reef.

The coral challenge is a measurement that will have to be done sooner or later. The longer it is neglected the worse it will look to the public. Farmers who are accused of killing the reef are especially interested.

We need to make sure these new measurements are done properly and without any questions about reliability. They must be supervised by a group of scientists that are acceptable to both sides of the agricultural debate on the reef to ensure methodology and execution is impeccable.

End of article by Dr Ridd.
___

*There have been some recent studies of calcification rates at a limited number of sites, and these contradict the media headlines and the landmark AIMS study. For example:
‘Long-term growth trends of massive Porites corals across a latitudinal gradient in the Indo-Pacific’ by Tries B. Razak, George Roff, Janice M. Lough, Dudi Prayudi, Neal E. Cantin, Peter J. Mumby in Marine Ecology Progress Series, Volume 626. The Abstract reads:

“Previous studies have reported recent substantial declines in the growth rates of massive Porites corals under warming oceans. However, the majority of these reports are from inshore reefs, and few have explored growth responses in offshore reefs from remote locations with low levels of pollution, sedimentation or nutrient loading. Here, we examined continuous growth records of massive Porites from remote locations spanning a 25° latitudinal gradient in the Indo-Pacific, including Palau, central Sulawesi, West Papua and the central Great Barrier Reef (GBR). Between 1982 and 2012, no significant changes in calcification or extension anomalies were observed at any study location, despite significant increases in sea surface temperature (SST) at all sites. Skeletal density increased linearly by ~0.4% yr−1 in Palau, but no change was found in Sulawesi, yet skeletal density showed a significant nonlinear change in West Papua and the GBR. Skeletal density displayed a significant positive linear relationship with SST at Palau and West Papua, whereas no relationship was observed in Sulawesi. In the GBR, skeletal density exhibited a nonlinear parabolic relationship with SST, with strong negative anomalies occurring following major thermal events. Unlike the ongoing declines in growth rates of inshore corals that have been widely reported, we found that calcification and extension anomalies of the majority of Porites from offshore remote locations do not appear to be exhibiting negative growth responses to warming SST. Our results suggest that reefs experiencing low levels of local stressors may show increased resilience to warming SST in an era of rapidly warming oceans.

Further Reading

There is more background information on Peter Ridd’s work in this area in the book that I edited: ‘Climate Change: The Facts 2017’, specifically the chapter entitled: ‘The Extraordinary Resilience of Great Barrier Reef Corals, And Problems with Policy Science’. Go have a read!

This is a close-up of the corallite walls, of the same coral that features at the very top of this post. It was photographed at Bramston Reef in August 2019. According to Professor Terry Hughes this reef does not exist, at least that is what he told 4,500 delegates at an international conference in Cairns a few years ago. The picture of the mud flat that has apparently replace it was featured on the front page of the Cairns Post. That fake news story was written by News Ltd Journalist Peter Michael.

The coral featured at the top of this blog post is a huge Porites, perhaps 1,000 years old, that the experts claim does not exist because they deny the inshore reefs off-Bowen. I rested on it, while exploring south of Bowen in August 2019 with my paddle board. The black case (the Jarvis Walker) is for my drone Skido, who comes with me paddle boarding.

Filed Under: Information Tagged With: Coral challenge, Coral Reefs

What Can You See, Indicating Sea Levels are Rising?

December 28, 2019 By jennifer

Many Australians are fearful of catastrophic human-caused climate change because this is what the state-sponsored propaganda on the Australian Broadcasting Corporation (the ABC) tells us.

In Australia, we mostly live near the sea. All along our coastline there is evidence of sea level fall, yes fall.*

Where is the evidence for rising sea levels?

Will you see how much sea levels have risen when you watch the fireworks over the Opera House in Sydney Harbour this New Year’s Eve — or will you see evidence of sea level fall?

It is that time of year when family and friends visit me at the beach. My niece told me just before Christmas that she had read so many of the comments at the YouTube thread following my first short film ‘Beige Reef’. She was surprised at how many comments there were — an awful lot she commented.

When I asked her what she thought of the film, she told me that she had not actually watched the film.

At that morning tea, under a shelter at Coolum Beach, none of my nieces or nephews or older brother could admit to having watched the film.

It is all of 12 minutes long.

This first film involved me wading into, and diving below, waters that my sister-in-law some weeks earlier had indicated put me at risk of a shark attack. But still she has not actually watched the film.

I know that there is fear within the varies communities within which I exist, of at least three things: sharks, catastrophic human-caused global warming — and that I could lead some of them down the path of global warming scepticism and from this they could end-up pariahs.

I diverge.

The best evidence is that global sea level has fallen by at least 2 metres since the the Holocene high stand about 4,000 BC; that is about 6,0000 years ago, a time known as the Minoan warm period.

The evidence in rocks and cliff faces all along the Australian east coast is that sea level was about 1m higher in the Roman warm period (year 0), and about 0.5m higher in the Medieval warm period (1,000 AD).

Conversely, it is believed the sea level was lower in the cold periods of 500 AD (Dark Ages) and the Little Ice Age (1,650 AD), maybe both 0.2 — 0.5 metres below today’s level. This last low sea level is particularly important, because it from this base sea levels are perhaps still rising back to average Holocene levels. But are they really?

When I go kayaking, and walk along the sea shore, and send my drone Skido up into the sky and look down and take pictures of things like marine potholes that feature at the top of this blog post: I see evidence for a sea shore that is receding.

The sea begins at the land’s edge. Where the sea begins is the ‘sea level’.

When I stand beside the circular pothole that you can see in the centre of the picture accompanying this blog post (… scroll to the very top).

I’m standing on a wave-cut platform of sandstone bedrock with rectangular fractures, and red iron oxide colouring.

Potholes are formed by the relentless grinding of harder rocks — perhaps granite— caught in a depression in this softer sandstone. Pounding surf causes the harder rocks to swirl — round and round — grinding down.

The grinding that created these potholes could only have happened when sea levels were higher, when this platform was between the high and low tide marks.

I took the picture on a highest tide this last year, in 2019. A year that is nearly over.

Sea levels must have been higher in the past. Because even on the highest tides this last year, the waves never reached this far?

The ABC may be concerned about rising sea levels, but where is your evidence for it? Are you brave enough, do you care enough, can you find the time enough, to think through some of these issues this next year: in 2020?

We are all entitled to our own opinions, but not our own facts.

I photographed this cliff face just to the north-west of the pot holes, which is just to the north-west of my favourite beach in Noosa National Park, so near where I live. What can you see in this landscape? Is there a wave cut platform, and what might have created it? Have you seen similar along other sections of sea shore?

______________________

* This is intended as the first of a series of blog posts on sea level change.

Filed Under: Information Tagged With: sea level change

New Record Temperatures Need Justification

December 20, 2019 By jennifer

IN September 2017, the Bureau declared the hottest ever September on record for the state of Victoria based on temperature data from Mildura.

I’ve since shown that this was helped along by the Bureau replacing a mercury thermometer with an electronic probe that can record a good 0.4 degrees hotter for the same weather.

There is not only the issue of the Bureau not providing any information on how the electronic probe was calibrated, but as I’ve explained to the Chief Scientist, there is also the issue of averaging:

There is a lot of natural variability in air temperature (particularly on hot sunny days at inland locations), which was smoothed to some extent by the inertia of mercury thermometers. In order to ensure some equivalence between measurements from mercury thermometers and electronic probes it is standard practice for the one-second readings from electronic probes to be averaged over a one-minute period, or in the case of the US National Weather Service the averaging of the one-second readings is over 5 minutes.

The Australian Bureau began the change-over to electronic probes as the primary instrument for the measurement of air temperatures in November 1996. The original IT system for averaging the one-second readings from the electronic probes was put in place by Almos Pty Ltd, who had done similar work for the Indian, Kuwaiti, Swiss and other meteorological offices. The software in the Almos setup (running on the computer within the on-site shelter) computed the one-minute average (together with other statistics).

This data was then sent to what was known as a MetConsole (the computer server software), which then displayed the data, and further processed the data into ‘Synop’, ‘Metar’, ‘Climat’formats. This system was compliant with World Meteorological Organisation (WMO) and the International Civil Aviation Organisation (ICAO) standards. The maximum daily temperature for each location was recorded as the highest one-minute average for that day. This was the situation until at least 2011.

I have this on good advice from a previous Bureau employee.

It is likely to have been the situation through until perhaps February 2013 when Sue Barrell from the Bureau wrote to a colleague of mine, Peter Cornish, explaining that the one-second readings from the automatic weather station at SydneyBotanical Gardens were numerically-averaged. At some point over the last five years, however,this system has been disbanded. All, or most, of the automatic weather stations now stream data from the electronic probes directly to the Bureau’s own software. This could be an acceptable situation, except that theBureau no-longer averages the one-second readings over a one-minute period.

Indeed, it could be concluded that the current system is likely to generate new record hot days for the same weather, because of the increased sensitivity of the measuring equipment and the absence of any averaging/smoothing. To be clear, the highest one-second spot reading is now recorded as the maximum temperature for that day at the 563 automatic weather stations across Australia that are measuring surface air temperatures.

Just yesterday, the Bureau fed that “hottest ever” meme with a claim that analysis of data from about 700 weather stations across the country showed Wednesday was the hottest day recorded in Australia, with the nationally averaged maximum daytime temperature reaching 41.9C.

That was apparently a full degree higher than the previous record of 40.9C set on Tuesday, which itself broke the mark of 40.3C from January 2013.

But how exactly are the temperatures being measured, and which stations are being combined?

The Bureau has deleted the hottest day ever recorded with a mercury thermometer in a Stevenson screen, which was 51.6 degrees Celsius at Bourke in 1909.

Then there is the issue of the Bureau cooling the past. 


For example, it is a full 1.4 degrees cooler in Darwin on 1st January 1910 in the official ACORN-SAT version 2, temperature data base, relative to the actual temperature recorded back then in a Stevenson Screen with a mercury thermometer.

I have also documented how the Bureau put a limit on how cold a temperature can be recorded.

Not to mention closing stations in high altitude regions that may record colder temperatures. So the 700 weather stations used to calculate the hottest day on Wednesday may be skewered warmer since the closure of stations in the coldest places:

During June and July 2017, blizzard conditions were experienced across the Australian Alps, but we will never know how cold it actually got. Because a MSI1 card reader prevented the equipment – able to record down to minus 60 – from recording below minus 10 at Thredbo and probably also at many other locations.

It is also impossible to know how cold this last winter was relative to 1994 because the weather station at Charlotte Pass was closed in March 2015 – it is no longer in operation.

I’ve written to the National Audit Office about only some of these issues and that was some years ago now.

I could go on …

Filed Under: Information Tagged With: temperates

Exquisite

December 8, 2019 By jennifer

Exquisite: that is my word for an important book published this year, entitled ‘A Stray Liana’.

It is replete with the most beautiful photographs all by Neil Hewett, and all taken amongst the Daintree Rainforest where he has lived for perhaps two decades now.

Before that Neil lived for seven years within a remote Northern Territory Indigenous homeland.

The book is not just exquisite photographs, but Neil’s story about reconnecting with nature: how we are a part of nature with an obligation to manage our landscapes wisely.

Neil has long argued that it is only through the sustainable harvest of our natural wealth that wild places and wild creatures can truly flourish.

‘A Stray Liana’ is a large and heavy book replete with wildlife and also wise words.

On pages 248 and 249 there is a Chameleon Checko (Carphodactylus laevis) drinking from a leaf. The image fills the entire two pages and yet we only get to see the eyes and snout of the creature! This is enough to discern a personality.

Another favourite for me is the Northern Barred Frog (Mixophyes schevilli) sitting so quietly in that stream. Then there is the bright yellow moth caterpillar (Dysphania numana) like something from outer space daring a bird to not eat it.

If you are looking for the ultimate Christmas present, this book is it:

https://www.astrayliana.com.au/product/a-stray-liana-book/

Neil with his children some many years ago.

****
Neil shared the image of the lichen spider that features at the top of this blog post with me many years ago. I have a whole collection of them, different lichen spiders … from the Daintree, from Neil.

Filed Under: Information

  • « Go to Previous Page
  • Go to page 1
  • Interim pages omitted …
  • Go to page 10
  • Go to page 11
  • Go to page 12
  • Go to page 13
  • Go to page 14
  • Interim pages omitted …
  • Go to page 445
  • Go to Next Page »

Primary Sidebar

Recent Comments

  • Ian Thomson on Vax-ed as Sick as Unvax-ed, Amongst My Friends
  • Dave Ross on Vax-ed as Sick as Unvax-ed, Amongst My Friends
  • Dave Ross on Vax-ed as Sick as Unvax-ed, Amongst My Friends
  • Alex on Incarceration Nation: Frightened of Ivermectin, and Dihydrogen monoxide
  • Wilhelm Grimm III on Incarceration Nation: Frightened of Ivermectin, and Dihydrogen monoxide

Subscribe For News Updates

  • This field is for validation purposes and should be left unchanged.

November 2025
M T W T F S S
 12
3456789
10111213141516
17181920212223
24252627282930
« Jan    

Archives

Footer

About Me

Jennifer Marohasy Jennifer Marohasy BSc PhD has worked in industry and government. She is currently researching a novel technique for long-range weather forecasting funded by the B. Macfie Family Foundation. Read more

Subscribe For News Updates

Subscribe Me

Contact Me

To get in touch with Jennifer call 0418873222 or international call +61418873222.

Email: jennifermarohasy at gmail.com

Connect With Me

  • Facebook
  • LinkedIn
  • RSS
  • Twitter
  • YouTube

Copyright © 2014 - 2018 Jennifer Marohasy. All rights reserved. | Legal

Website by 46digital