• Skip to primary navigation
  • Skip to main content
  • Skip to primary sidebar
  • Skip to footer
Jennifer Marohasy

Jennifer Marohasy

a forum for the discussion of issues concerning the natural environment

  • Home
  • About
  • Publications
  • Speaker
  • Blog
  • Temperatures
  • Coral Reefs
  • Contact
  • Subscribe

jennifer

Coral Catastrophes Imagined

April 10, 2020 By jennifer

Exactly one year ago yesterday, I was getting off a train in Proserpine, looking to pickup a hire car to drive to Bowen. I wanted to know if the coral there was all dead, or not. Bowen is a coastal town in North Queensland, not far from Abbott Point that is the coal terminal for the controversial Adani coal mine.

Judge Salvador Vasta had earlier that week handed down his findings regarding the sacking of Peter Ridd. He had exonerated Ridd and explained that James Cook University had wrongly sacked him.

Some claim that it all came to a sorry end for Ridd because he dared to question the consensus of scientific opinion concerning the health of the Great Barrier Reef – particularly the impact of global warming. The university claimed it was because he had become ‘un-collegial’ and did not follow various directives while disclosing confidential information.

These issues were argued in the Federal Circuit Court in Brisbane a month earlier, in March 2019. Very few people realized that at the heart of the case were a couple of what might be best described as fake-news photographs promoted by Terry Hughes.

This is the same Terry Hughes who is now claiming that 60%* of the Great Barrier Reef has been bleached, and that this is an extraordinary catastrophe for which we should all be ashamed.

If Peter Ridd had become un-collegial and disclosed confidential information, it was because he was fed-up with the fake news. As Ridd wrote in chapter 1 of the book that I edited three years ago, a chapter entitled ‘The Extraordinary Resilience of Great Barrier Reef Corals, and Problems with Policy Science’:

I have carried out half-a-dozen audits on some of the science claiming damage to the Great Barrier Reef, and in every case I have discovered serious problems.

The first of the 21 findings handed down in the Federal Court by Judge Vasta one year ago, concerned photographs used by Terry Hughes to claim that the corals off Bowen had been variously destroyed by global warming, ocean acidification and sediment run-off. Hughes claimed where there had once been healthy coral reef, there was now only mudflat.

This is the mudflat at Bramston Reef, with the Gloucester Island backdrop, that Terry Hughes claims now replaces once healthy coral reef. I walked a kilometre towards the ocean at low tide and found hectare upon hectare of healthy coral on Easter Friday in 2019.
I took this photograph on Easter Friday in April 2019. It shows corals at low tide with the Gloucester Island backdrop, and is about one kilometre to the south east of the photograph showing only mudflat.
Bramston Reef is to the south of Bowen, and across from Stone Island. Terry Hughes has claimed there is now only mud flat where there were once healthy coral at Bramston Reef. This map features in the film Beige Reef.

The most recent claims from Hughes, that all of the Great Barrier Reef is at risk from global warming, do not follow close-up examination of individual corals or even individual reefs. Rather Hughes has flown in a light plane in all sorts of conditions through the day even when it was windy, and looked down from a very high altitude, from some hundreds of metres away.

His claims are being uncritically reported as fact across the world, including in popular scientific magazines.

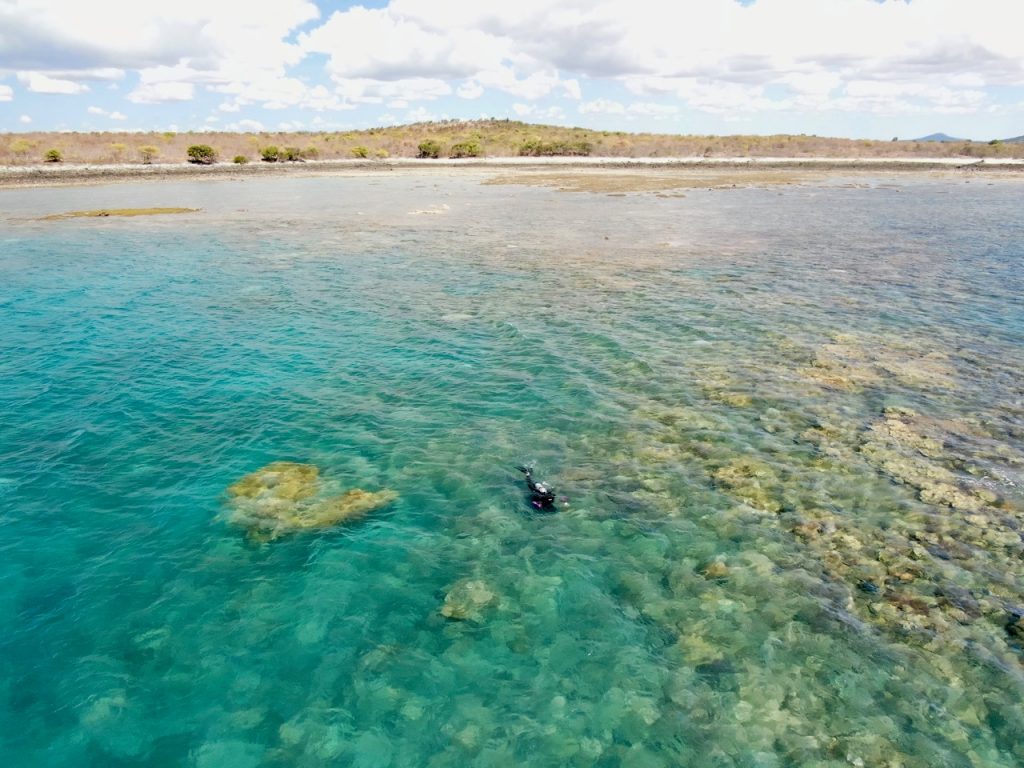
I’ve flown a drone at 30 metres above a coral reef and spotted white corals. I’ve snorkelled that same reef and found the same white corals to be very much alive and with zooxanthellae. I made a film of this adventure, documenting its health for that moment in time. That was in August 2019. I named that reef and the film: Beige Reef. You can see the white corals from the drone footage at 9.38, 10.35 and 11.07 minutes.

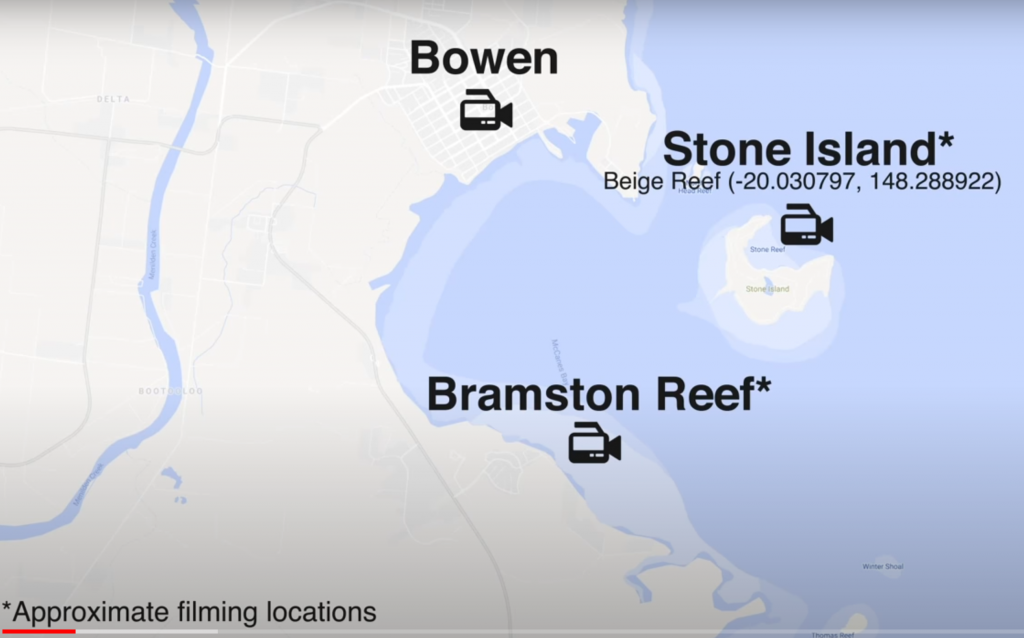
Beige reef fringes the north facing bay at Stone Island, which is across the channel from Bramston Reef at the entrance to Bowen Harbour.

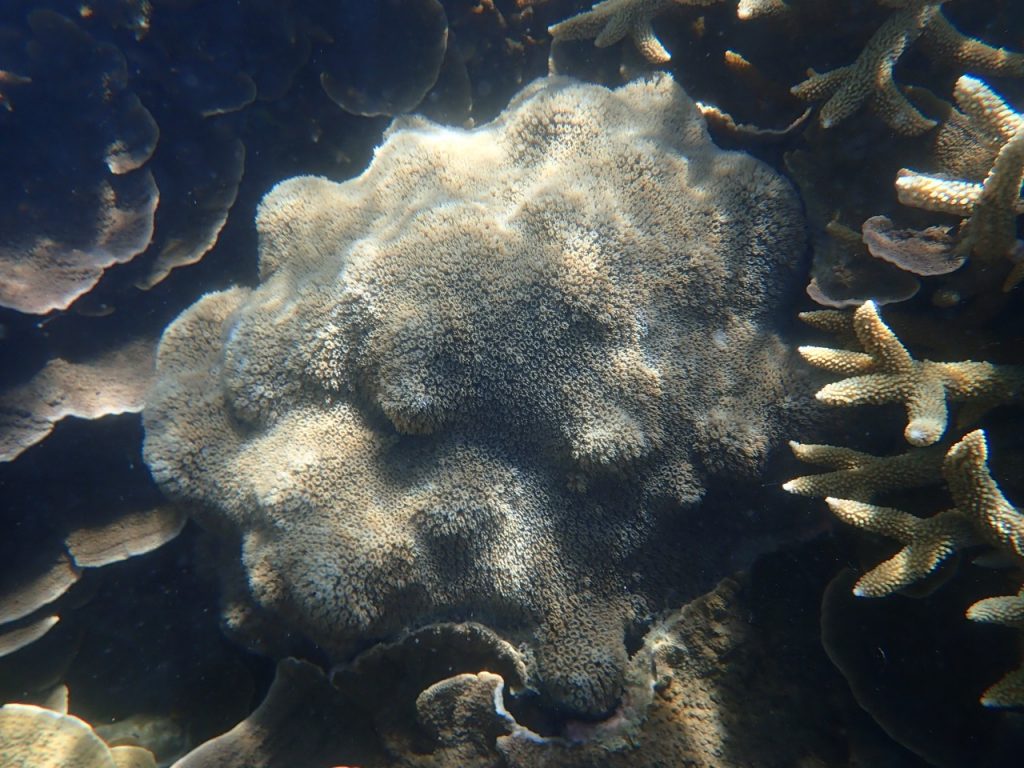
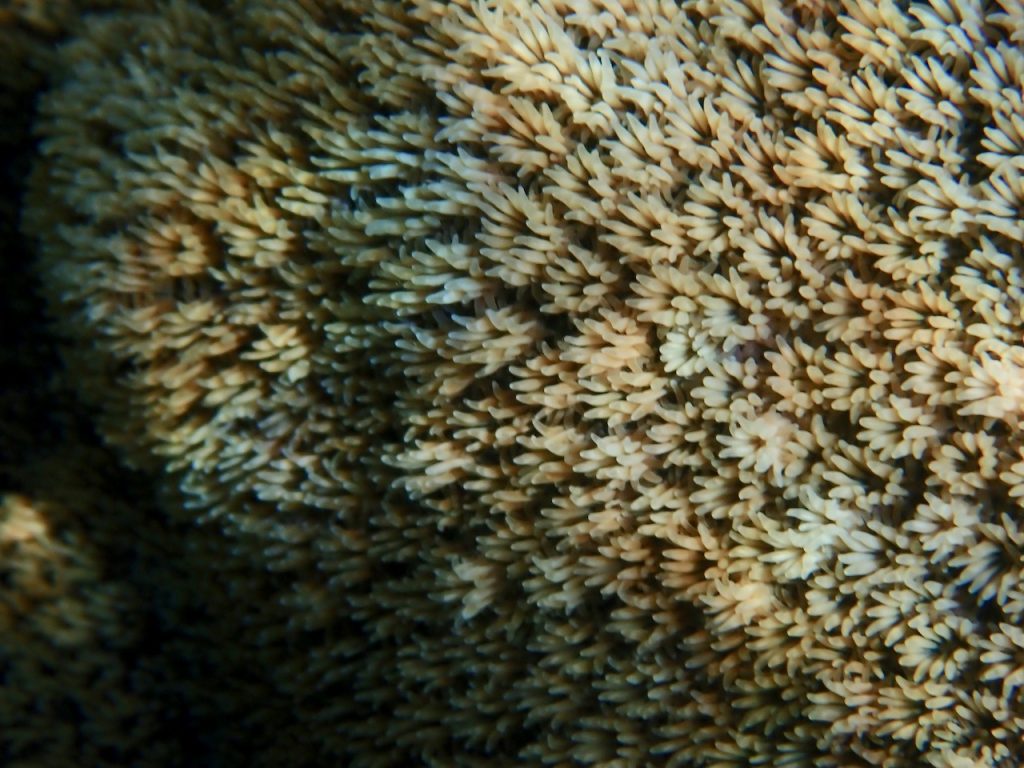
The white corals were large; they are commonly known as bolder corals, and the species at Beige Reef was Galaxea fascicularis. I made this identification based on information in J.E.N. Vernon’s three-part encyclopedia ‘Corals of the Worlds’ using my close-up photographs of the extended tentacles. These were taken on the same day that I took the drone footage showing these same corals as white in the film Beige Reef.

A boulder coral, Galaxea fascicularis, photographed at Beige Reef on 27th August 2019 by Jen while snorkelling.
A close-up of the tentacles of the same bolder coral, Galaxea fascicularis, photographed on 27th August 2019.

If we go back eight years, to July 2012, it is a fact that Terry Hughes stood in front of 2,500 marine scientists at an international conference in Cairns and claimed the corals off-Bowen are dead. That claim, made while showing a picture of the mudflat at Bramston Reef just to the south of Bowen, was a front-page story the next day in The Cairns Post.

Peter Ridd had some photographs taken in 2015 showing healthy corals off-Bowen, he got sacked for this effort. To back-up Terry Hughes, Tara Clark from the University of Queensland and colleagues (including David Wachenfeld from the Great Barrier Reef Marine Park Authority), had a paper published by the prestigious journal Nature claiming that there are no-longer any Acropora spp. corals at Stone Island. In the film Beige Reef, I show 25 hectares of this coral type. I made Beige Reef to back-up Peter Ridd.

I don’t know of a single journalist prepared to visit Bowen, Bramston Reef, Beige Reef or Stone Island to check the veracity of the claims by me and Peter Ridd versus Terry Hughes or Tara Clark. Yet it is not complicated, though it will be political. The saga has been on-going since at least 2015.

Jennifer Marohasy: come visit the reef with me, Misha Ketchell

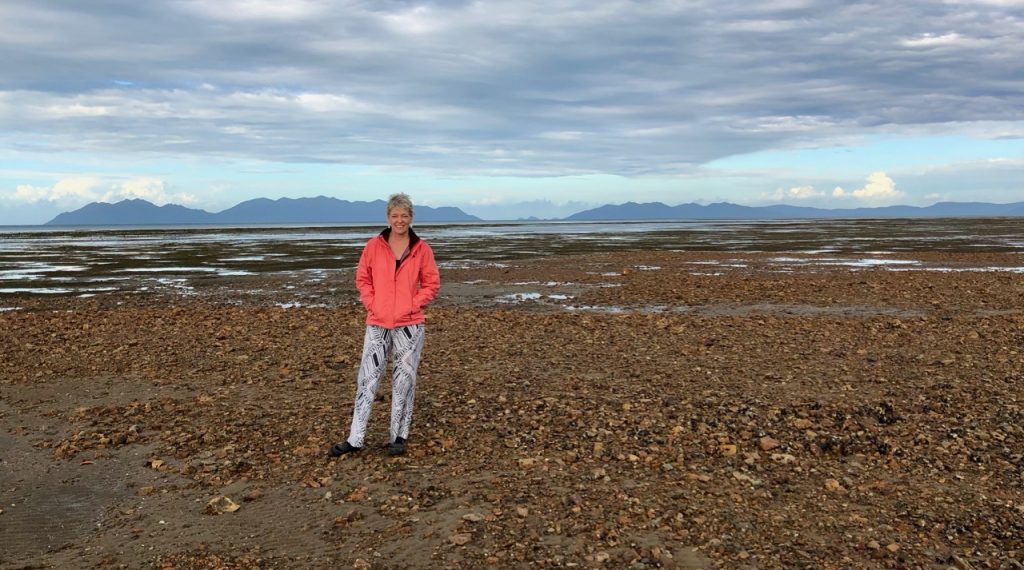
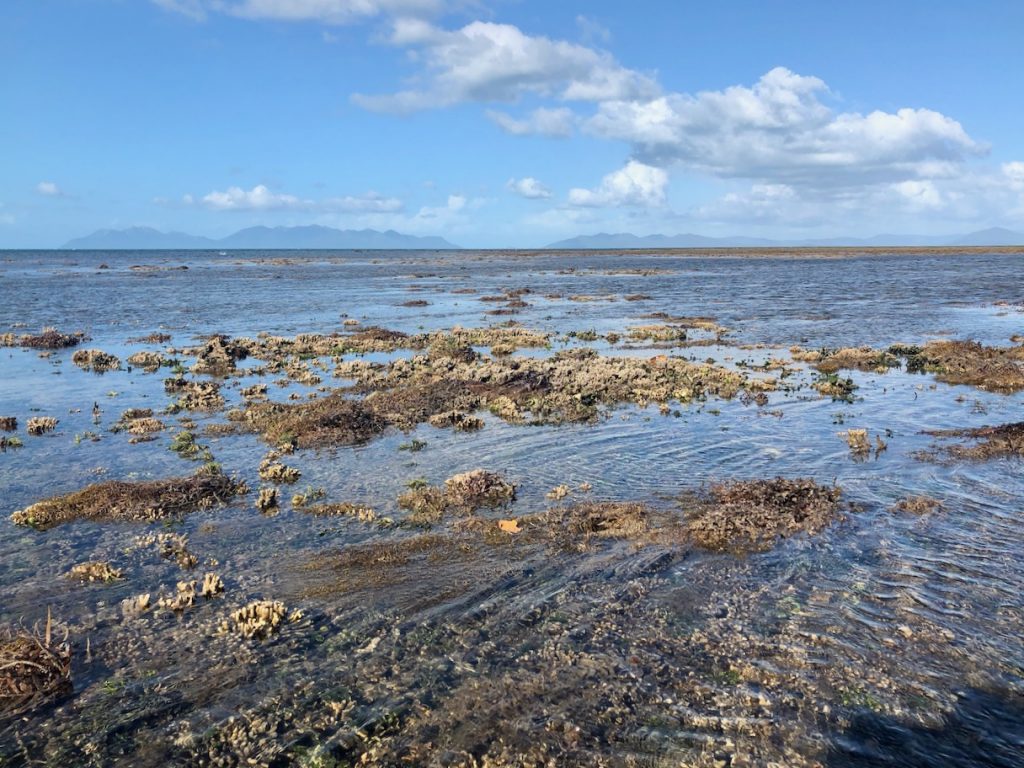
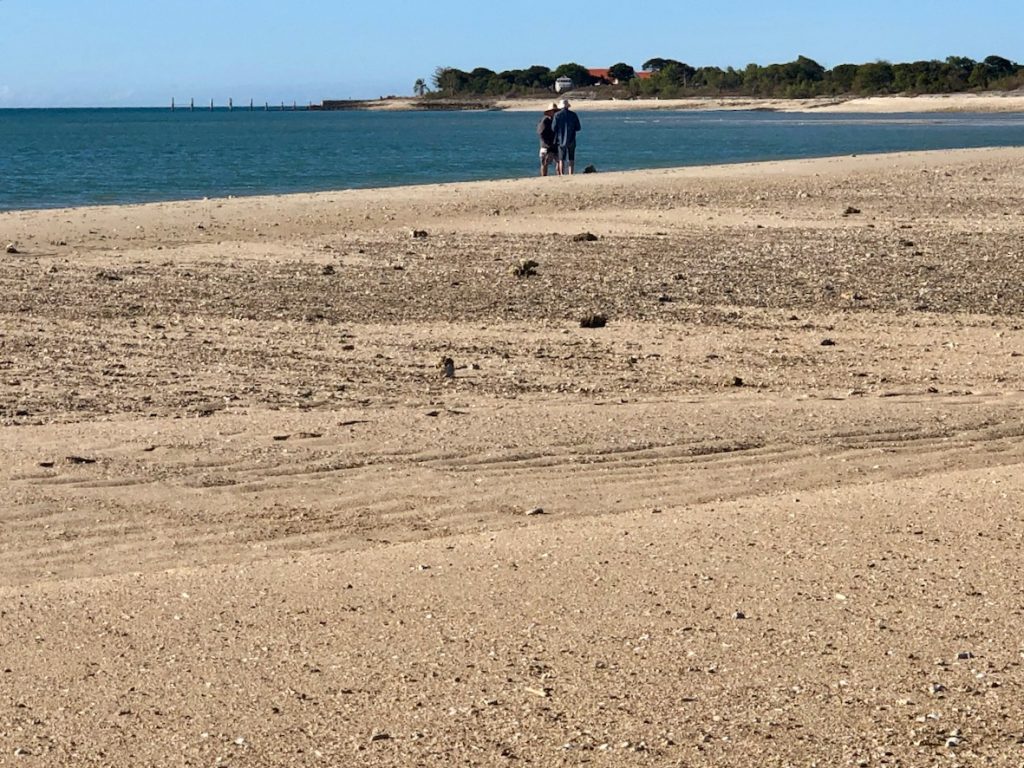
Exactly one year ago, keen to see for myself I walked across that mudflat at low tide, after catching the train to Proserpine and then driving up to Bowen. I walked across the mudflat on the afternoon of Easter Friday in April 2019, and kept going for about 1 kilometre. I found so much live coral, the other side of that mudflat.

I returned to Bowen four months later in August 2019 with skipper Rob McCulloch, marine biologist Walter Starck, and an underwater photographer.

Having the boat that McCulloch towed down from Cairns made it possible for us to get all around Stone Island. As it turned-out we found several coral reefs fringing Stone Island, including Beige Reef with all the Acropora spp.. To be clear, there is not just coral the other side of the mudflat at Bramston reef, but all-around Stone Island that is just across the channel from Bramston Reef.

Surely it’s time journalists and their editors took some responsibility for the information that they republish? It seems they take anything provided by particular academics that fit a narrative, and give it a free run.

So far, Hughes has not published this most recent aerial survey in any peer-reviewed journal, or even made available a list of the locations with bleached corals. No doubt he will in due course. Then we will probably see a second wave of uncritical reporting by the mainstream media, again claiming the imminent demise of the Great Barrier Reef. The bottom-line seems to be that we live at a time when the dominant narrative demands an ecological disaster. It is as though almost anything that can be imagined, and told as a story by academics, can become a news headline. There is no checking.

I can only ask that ordinary folk be ever sceptical of such stories. Scepticism should be worn as a badge of honour, particularly in these times when it can be so hard to know whether there really is a coral catastrophe, or not. How can we find the truth, when even Nature publishes incorrect reports: claiming there are no Acropora spp. corals at Stone Island where I found and filmed 25 hectares on 27 August 2019.

Filming corals just below the surface at Beige Reef, which fringes the north facing bay at Stone Island. This photograph was taken on 27th August 2019.
Stone Island has sand, as well as stone, and corals as well as mudflat. This photograph was taken at the entrance to Bowen Harbour from Stone Island in August 2019 with Rob McCulloch and Walter Starck in the distance.

***

Postscript:

Quoting from an ABC News story:
Great Barrier Reef found to be coral bleached from north to south for first time
By national science and technology reporter Michael Slezak and the specialist reporting team’s Penny Timms
Updated Tue at 9:52am

“The Great Barrier Reef is currently experiencing the most widespread bleaching ever recorded, with 60 per cent of reefs across all three regions affected, according to a detailed survey of the system.

Key points:

1. Warmer sea temperatures have led to coral bleaching along the length of the Great Barrier Reef

2. More coral reefs were bleached in 2016, although the damage was concentrated in the north

3. Marine biologist Terry Hughes says the reef is rapidly adapting to climate change

It is the third mass bleaching event on the reef in five years — a phenomenon primarily caused by greenhouse gas emissions, and one that had never been recorded before 1997.

“We were hoping that this year would be a relatively mild bleaching event, but unfortunately that’s not the case,” said Professor Terry Hughes, head of the ARC Centre of Excellence in Coral Reef Studies.

https://www.abc.net.au/news/2020-04-07/great-barrier-reef-most-widespread-coral-bleaching-on-record/12107054
______

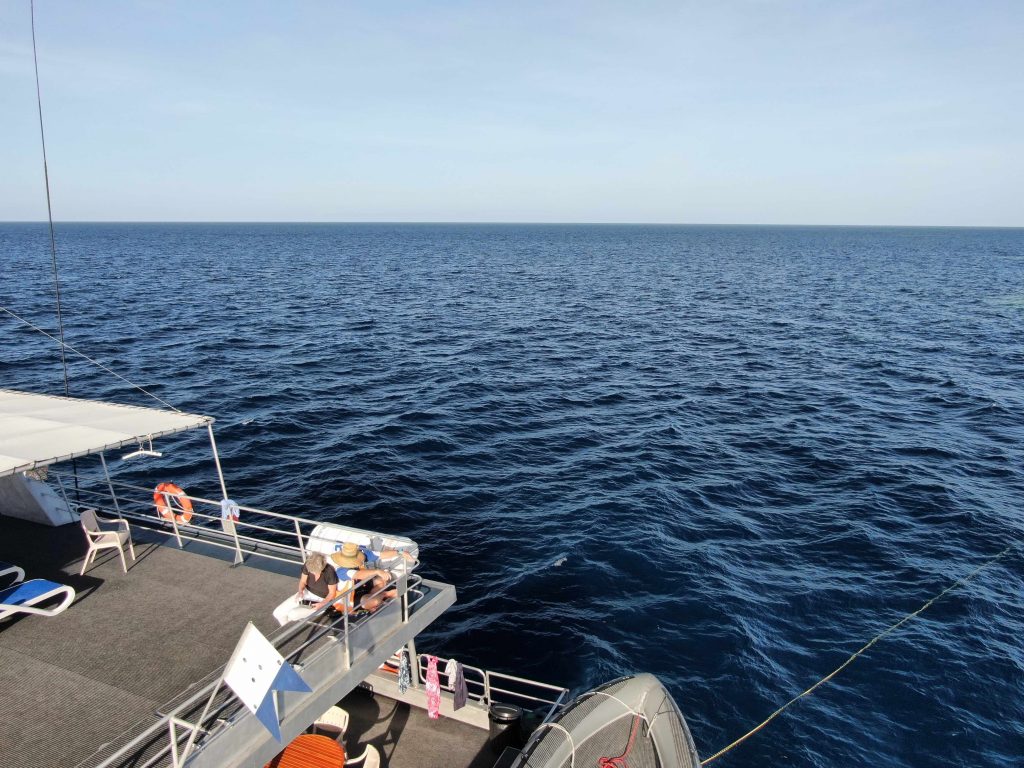
The image at the very top of this blog post is of Matt and me on Easter Monday 2019, heading out to Middle Island from Bowen Marina. Much thanks to John Barnes for organising this adventure, and for taking the photograph.

Filed Under: Information Tagged With: Great Barrier Reef

Falling Sea Levels, a Rainbow and a Full Moon

April 8, 2020 By jennifer

I was there again on the wave cut platform to see how high the waves broke on the very highest tide for this month, and also to exercise. (During this Corona virus pandemic we are allowed outside to exercise.)

The photograph was taken by Caroline Forsyth yesterday at 7.23 am on 7th April 2020.

I’m standing on the wave cut platform at the time of the highest tide, yet the waves don’t reach anywhere near the cliff face.

Once upon a time when sea levels were higher, I would have been waist-deep in surf. I am referring to a period just a few thousand years ago, known as the Holocene High Stand.

The waves would have pounded that cliff face, occasionally bringing down great lumps of rock from above.

As the cliff-face retreated landward, the platform became wider. That is why this type of formation is called a Wave Cut Platform.

There are similar geological formations all around the world.

The peer-reviewed geological literature explains that they are evidence sea levels have been falling, not rising, over the last few thousand years. (Some relevant technical references are listed in the postscript.)

Of course, the height of the sea tide varies with the 18.6 year lunar declination cycle, and most obviously varies with the moon’s monthly cycle about the Earth. Yesterday was the highest tide and it occurred on the morning the day before the Full Moon.

Of the three Super Moons this year, tonight’s will come closest to Earth and thus appear the largest.

I am going to be out exercising again tonight, and watching the Full Moon come up.

For the Pagan, the Full Moon represents a time to be grateful. I am grateful that today my daughter is released from two weeks of mandatory quarantine having returned exactly two weeks ago from New York. I am grateful.

**** Postscript

If it is the case that failed scientific paradigms are not disproven, but rather they are replaced. We need a new theory of climate, and it could begin with understanding the sea tides and how they vary with the weather during each calendar year, and also the climate over millennia.

Howard Brady wrote to me a year or so ago:

“There is evidence of a gradual fall (not rise) from a high sea level stand between 8000 and 2000 BP. Such evidence comes from an increasing number of peer-reviewed articles describing evidence of this high sea level stand and its decline along the coasts of Australia, South Africa, South America, South Korea, and Vietnam.

There is increasing evidence that such a wide occurrence of a high sea level stand, especially in the Southern Hemisphere, cannot be interpreted as due to crustal movements (Glacial Isostatic Adjustments -GIAs) in different continents at the same time as these areas did not experience any significant glacial or ice crustal loading during the last ice age advances.

Basically, there is now so much data on this fall in sea level from a high-level stand that the GIAs quoted by Dutton and Lambeck 2012 should be abandoned. A few references to peer reviewed articles describing a high sea level stand in the HTM and the fall in sea-level from 8000 -2000 BP are listed below. There is no justification for any glacio-eustatic uplift since 8000 BP that stopped (for some unknown reason about 2000 BP) in regions that did not experience any ice loading during the last glaciation.

Accordi.A, Carbone, F 2016. Evolution of the siliciclastic-carbonate shelf system of the northern Kenyan coastal belt in response to Late Pleistocene-Holocene relative sea level changes. Journal of African Earth Sciences. Volume 123, November 2016, Pages 234-257

Baker,R.G.V., Haworth,R.J; 2000. Smooth or oscillating late Holocene sea-level curve? Evidence from the palaeo-zoology of fixed biological indicators in east Australia and beyond. Marine Geology 163, 367-386.

Baker,R.G.V., Haworth,R.J., Flood,P.G; 2001. Warmer or Cooler late Holocene palaeoenvironments? Interpreting south-east Australian and Brazilian sea level changes using fixed biological indicators and their d18 Oxygen composition. Palaeogeography, Palaeoclimatology, Palaeoecology 168. 249-272.

Baker,R.G.V., Haworth,R.J., Flood,P.G; 2001. Inter-tidal fixed indicators of former Holocene sea levels in Australia; a summary of sites and a review of methods and models. Quaternary International 83-85. 257-273.

Baker,R.G.V., Haworth,R.J., Flood,P.G; 2005.An Oscillating Holocene Sea-level? Revisiting Rottnest Island, Western Australia, and the Fairbridge Eustatic Hypothesis. Journal of Coastal Research, Special Issue no.42.
Bracco,B. et al; 2014. A reply to “Relative sea level during the Holocene in Uruguay. Palaeogeography, Palaeoclimatology, Palaeoecology.Volume 401.

Bradley, S, Milne,G, Horton,B, Zong,Y 2016. Modelling sea level data from China and Malay-Thailand to estimate Holocene ice-volume equivalent sea level change. Quaternary Science Reviews 137:54-68

Chiba,T et al;, 2016. Reconstruction of Holocene relative sea-level change and residual uplift in the Lake Inba area, Japan. Palaeogeography, Palaeoclimatology, PalaeoecologyVolume 441, Part 4,Pages 982-996

Clement, A, Whitehouse,P, Sloss,S 2015. An examination of spatial variability in the timing and magnitude of Holocene relative sea-level changes in the New Zealand archipelago. Quaternary Science Reviews. Volume 131, Part A. January 2016, Pages 73-101

Haworth,R.J., Baker,R.G.V., Flood,P.G; 2001. Predicted and observed Holocene sea-levels on the Australian coast: what do they indicate about hydrostatic models in far field sites? Journal of Quaternary Research 17. 5-6.

Lee, S., Currell. M, Cendon, D. 2015. Marine water from mid-Holocene sea level highstand trapped in a coastal aquifer: Evidence from groundwater isotopes, and environmental significance. Science of The Total Environment. Volume 544. February 2016, Pages 995-1007

Lunning,S, Vahrenholt, F. Im südlichen Afrika lag der Meeresspiegel vor 5000 Jahren um 3 m höher als heute- Kategorien: Allgemein, News/Termine.25. Juni 2018 | 07:30

Oliver and Terry, 2019. Relative sea-level highstands in Thailand since theMid-Holocene based on 14C rock oyster chronology. Palaeogeography, Palaeoclimatology, Palaeoecology,Volume 517. Pages 30-38

Prieto,A. Peltier, W. 2016. Relative sea-level changes in the Rio de la Plata, Argentina and Uruguay: A review. Quaternary International.
Sloss, Craig R,: 2005. Holocene sea-level change and the amino-stratigraphy of wave-dominated barrier estuaries on the southeast coast of Australia, PhD thesis, School of Earth and Environmental Sciences, University of Wollongong, 20. http://ro.uow.edu.au/theses/447.

Sloss, C.R, Murray-Wallace,C.V, Jones.B.G; (2007). Holocene sea-level change on the southeast coast of Australia: a review. The Holocene 17, 7. 999-1014.

Strachan K, et al;, 2014. A late Holocene sea-level curve for the east coast of South Africa. S. Afr. j. sci. vol.110 n.1-2

Filed Under: Information Tagged With: sea level change

Running out of Rice, While Wasting Water

March 29, 2020 By jennifer

Australia was once self-sufficient in rice. We now grow less than 25 percent of domestic rice consumption. The SunRice Group has been importing rice from Vietnam and repackaging it to make-up the shortfall. Since the Corona Virus pandemic, the Vietnamese government has banned the export of rice, while the Australian Bureau of Meteorology has feigned an unprecedented drought. There is a need to not only prioritise health needs, but also to ensure we can feed ourselves. This could go together with the restoration of the Murray River’s estuary.

Spring rainfall in the Murray Darling Basin, 1900 to 2019.

I have been fortunate to live most of my life through the good times, and in a society so rich and well serviced that we flush our porcelain toilet bowls with water good enough to drink. At the same time, many have complained endlessly about a coming environmental apocalypse, unless all the travel stops, and we allocate ever more water to the environment. Now the travel has stopped, and also the rice growing, but not because of climate change or a shortage of freshwater.

We have a pandemic, and across the world communities have shown that they can do the right thing. Across the world, governments have put saving lives before capitalism and populations have mostly complied. We have been told to stay at home, and we mostly have. In Australia, department store giant Myer will closed from today. Around 10,000 staff will be stood down. Early last week, Qantas announced it was cancelling 90 percent of international flights. A couple of days later the borders were closed to everyone except Australians and Australian residents. My daughter was on the second last Qantas flight from the United States to Sydney, before the entire international Qantas fleet was grounded. She arrived the same day my home state of Queensland began turning back anyone who was not a resident, anyone who didn’t already live here.

She has spent the last few years overseas, most recently working in New York. She has told me that what was most disturbing about her last week there, in South Harlem Manhattan, was the surge in frequency of the sound of ambulance sirens.

New York has quickly become the global epicentre for Corona virus. A virus with its origins apparently in a seafood market in China that also sold wild animals kept alive in cages. Environmentalist Jane Goodall recently said that if anything good has already come from this virus, it is the closing down of that cruel trade. The market was in Wuhan which is a city on the Yangtzee River, where just a few years ago the Baiji went extinct. The Baiji was a grey dolphin endemic to the Yangtze River with tiny eyes and a long narrow beak. The last confirmed sighting was in September 2004.

The Baiji, Lipotes vexillifer, may be the first species of cetacean (whale, dolphin and porpoise) to go extinct in modern times. The extinction will have taken place at a time of unprecedented interest and concern for their large relative the Minke whale. It is perhaps a sad reflection of humanity’s sometimes inability to prioritise effectively on the basis of need, that so many resources and so much publicity has been devoted to ‘saving’ these whales whose populations are relatively abundant, while their endangered cousin was left to die out. In the same way we have been wasting water in the Murray Darling Basin on propping-up a crippled estuary when we could have been growing rice while restoring that estuary by bringing back the sea tides.

NO RICE IN THE SUPERMARKETS

Friday I was food shopping for my daughter now in a mandatory 14-day period of quarantine. I was surprised that there were no bags of standard rice on the shelves in my local Woolworths supermarket. Yesterday I went to Aldi specifically to buy some brown rice, but the line was so long – the line of people waiting just to enter that shop – that I will instead take her rice from my own pantry. Hopefully, the hoarding of food, as the Prime Minister, has described it, will stop. But is anyone in government a reliable source of information when it comes to claims there is enough rice to go around?

I phoned my friend Debbie Buller, who is a rice farmer on the Murrumbidgee River.
“There is no rice here, either,” she said. “Normally at this time of year we would be harvesting. But we have not been given a timely or adequate water allocation to grow rice for some years now.”

There have been claims that the recent drought was ‘unprecedented’, when in reality it was a very wet spring just a few years ago in 2016, in the Murray Darling Basin. Australia-wide the incident of drought has been decreasing since the 1970s and rainfall has generally been increasing. Yet since the summer of 2016-2017, rice growers have been denied a timely water allocation. The reservoirs and the rivers had enough water, but the government institutions responsible for water allocation have given Debbie very little. The mood has been against farming, and particularly against farming rice.

NO WATER FOR RICE GROWING

The Basin Plan has prioritised water for South Australia, and in particular the lower lakes that have been designated a wetland of international importance, even though they are only freshwater by artificial means since construction of the 7.6 kms of sea dyke back in the 1930s that stopped the tide.

The sea dykes and barrages prevent inflows from the Southern Ocean, they have stopped the tides making Lake Alexandrina totally dependent on upstream reservoirs even during periods of drought.

The taxpayer-funded Basin Plan is meant to be about restoring the environment, but it ignores the first thing that should be considered when fixing a river system — that is the need to restore the estuary to its natural dynamic state, as I explained to a Senate Committee in December 2015.

The bottom-line is that successive governments have denied upstream irrigators water in an attempt to keep forcing what was once the Murray River’s estuary to remain as an artificial freshwater lake. The water from upstream storages is sent to South Australia and much of it lost to evaporation, including in transmission. The Lower Lakes, that were once a functioning estuary but now barraged in as entirely freshwater, lose in excess of 800,000 megalitres of fresh water each year in evaporation, water that could be used to grow rice and other important staple food crops.

If my good friend Debbie had just 2,000 megalitres (0.25%) of that water that is evaporated, she could grow 2.16 million kilos of rice on just 174 hectares (430 acres). This would go some way to returning us to self-sufficiency. Once upon a time, over the ten years to 2004, Australian rice farmers grew 1 million tonnes of rice in an average year; we were self-sufficient. In Australia we could easily grow enough rice to feed about 20 million people a meal of rice every day of the year. Instead, again this last summer there has been very little rice planted, and not nearly enough available in the Murrumbidgee or Murray River irrigation areas to restock the supermarket shelves.

Another rice grower, my friend John Lolicato back in March 2011 when I visited him at Wakool, on an anabranch of the Murray River.

NO WATER, NO RICE, MILL CLOSED

A consequence was the virtual closure of the Deniliquin rice mill just last year, and the loss of 250 jobs.

To overcome the declining reliability of Australian grown rice because of changing government policy and public sentiment, the SunRice Group decided to instead invest in a mill where there was a reliable supply of rice.

They bought a rice mill in Vietnam with the intention of shipping the Vietnamese rice to Deniliquin for packing and distribution around Australia. Except, we live in unprecedented times, and the Vietnamese government has just banned the export of rice. So, the SunRice Group can no longer bring the Vietnamese rice back to Australia. There is not enough rice right now in Australia to restock the supermarket shelves, and none has been planted.

NEED FOR POLICY CHANGE, REMOVE THE SEA DYKES

Debbie and so many other rice growers would like to grow rice this next summer. But they have no idea whether they will be allocated any water. This situation needs to change. There is already more than enough water in the reservoirs for farming and the environment, if only the Murray River’s estuary were restored. The sea dykes need to be removed and the estuary restored. Then the 800,000 megalitres of water that is evaporated each year could be supplemented with saltwater, depending on the tides.

Once upon a time each spring, after good rains and snow melt, the Murray would tumble down from the Mountains spread over the vast Riverina and wind its way through the limestone canyons of the Riverland before flooding into Lake Alexandrina. By New Year, the river exhausted, and a breeze picking up from the southwest, the Southern Ocean would pour in through the Mouth of the river, and with the seawater came vast schools of Mulloway fish.

The fish came each autumn to spawn. The sea would work its way up across the lake and sometimes into the river proper. And so, the lakes would be sometimes fresh and sometimes salty, but always full of water and each autumn full of Mulloway.

Then the massive steel and concrete barrages were built across the Goolwa channel, that was after the dykes were already built sealing the Mundoo, Boundary Creek, Ewe Island channels and also the Tauwichere fishing area. In the autumn of 1940, the year the Goolwa barrages were completed and sealed, the Mulloway entered the Mouth, passed along the Goolwa channel and died in their hundreds of millions entrapped between the barrier and the falling tide.

The sea dykes killed the Mulloway fishery and crippled the estuary.

In 1939, the annual mulloway catch by commercial fishermen in the Murray River’s estuary was 595 tonnes. There is no longer an estuary; the Mulloway are stopped by the sea dykes. The catch in the adjacent Coorong has been no more than 30 tonnes in recent years.

The technical literature explains the sea dykes and Goolwa barrage reduced the size of the estuary by 89 per cent, and flows to the Murray mouth by 75 per cent. They stopped the tides. We are left with a freshwater lake full of carp instead of an estuary with Mulloway, crabs, waders and the biodiversity that comes when there is natural mixing of fresh and salt waters.

CONSEQUENCES OF HOLE DIGGING AND INFILLING

Some of us have been warning that as a civilization, it is best we not squander our wealth because bad things do happen. They are happening now. ‘Mr FOIA’, the sceptic and the good hacker who brought us Climategate, he warned back in 2009 that:

“[The] Wealth of the surrounding society tends to draw the major brushstrokes of a newborn’s future life. It makes a huge difference whether humanity uses its assets to achieve progress, or whether it strives to stop and reverse it.”

In the same email he described the misguided obsession with human-caused catastrophic global warming as “a massive hole-digging-and-filling-up endeavour”. The obsession has extended beyond climate change to so many aspects of natural resource management. It is the case that during the 1980 there were salinity issues in the Murray Darling Basin, caused in large part by rice farming. But the problems were solved through clever drainage management thirty years ago.

It is difficult to understand why this good news about environmental restoration is so rarely reported. Instead the Australian Broadcasting Corporation (ABC) continues to vilify those who defy agreed narratives when it comes to Australia’s longest river system, the Murray. Both sides of politics court the South Australian vote, and South Australians always want more freshwater including for the golf courses, wineries and the Goolwa sailing club that is just upstream of the barrage.

The Goolwa barrage that was sealed in early 1940, there are no longer any Mulloway fish in the Lower Lakes.

TIME TO SORT PRIORITIES

Now is the time to be honest to the evidence, to stop the waste, stop the politics and assure Debbie Buller some water for this summer, so she can grow rice for the thousands of people queuing for hours across Australia, trying to access staple food.

Denying Australian rice-growers water will not make it rain during drought, nor will it bring back the Yangtzee River dolphin or stop the spread of Corona virus. Restoring the Murray River’s estuary could though bring back the Mulloway fish. We are seeing for example in the many reports already of dolphins returning to Venice canals and clear skies over long-polluted cities, how resilient nature can be when we get out of the way.

On 11 March 2020, the World Health Organisation (WHO) declared a global pandemic, and the world community has responded closing whole industries including the travel industry. This health emergency could develop into a food emergency if we continue to hoard food, and if government policies continue to deny farmers access to water.

The SunRice Group have commenced discussions with the Australian government around the potential for an allocation of water to be made available to Australian rice growers who are upstream, this must be ahead of the planting window later in 2020 to ensure continued supply of Australian-grown rice for domestic consumption. Now is the time for sanity, for water to be allocated for farming so Australia can once again be self-sufficient in rice. But this is not enough, now is also the time to restore the once mighty Murray River its estuary.

The Chinese have banned the trade in exotic wildlife at that market in Wuhan. Now the Australian government can dismantle the 7.6 kilometres of sea dyke that deny the wild Mulloway their estuary. That would be a good start in getting out of the way, bringing back the sea tide, and filling our supermarket shelves with rice.

Debbie Buller standing neck-deep in a seed oat crop. It was planted directly after harvesting a rice crop, with the residual moisture producing high quality seed for oat farmers.

****
The feature photograph at the very top of this post is of Debbie Buller on her tractor in the Murrumbidgee Irrigation Area (MIA). This next spring she would so like to be planting rice.

Filed Under: Information Tagged With: Murray River

Warming Marble Bar

March 1, 2020 By jennifer

MY friend Craig Kelly – the Federal member for Hughes – attempted to raise the issue of the world’s longest heat wave record in the Australian parliament last Wednesday. He was shut down by Tony Burke, the manager of opposition business.

Specifically, Mr Kelly was attempting to draw attention to how the historical observations have been changed, and how the values as originally recorded at Marble Bar between 31 October 1923 and 7 April 1924 have been adjusted down. This was first brought to our attention by Chris Gilham, and reposted by Joanne Nova.

When the Australian Bureau of Meteorology cools the past – as it does with most of the 112 temperature series used to construct the official statistics – current temperatures appear hotter. The remodelling of Marble Bar has, to quote Mr Kelly, also robbed Australia of the world’s longest heatwave record. This now goes to Death Valley in California.

The Bureau has made many more changes to the Marble Bar record, than just dropping down the temperatures back in 1923 and 1924. With the first iteration of ACORN-SAT back in 2011, maximum temperatures as recorded at Marble Bar from 1967 back to 1910 were cooled on average by -0.41 °C, and from 1944 back to 1910 by an additional -0.52°C.

The Bureau claimed these changes were necessary because the weather station at Marble Bar has been moved, the moves created discontinuities in the temperature series, and these discontinuities can only be ‘corrected’ with reference to neighbouring sites.

In fact, the weather station at Marble Bar has always been just to the southeast of the town centre, on vacant public land on the edge of the Great Sandy Desert, which covers an area of about 284,993 km². There is no documentation for any move in 1944. In 1967 the weather station was apparently moved some metres. The distance is recorded as ‘small’ in the relevant catalogue.

The Bureau nevertheless identified weather stations at Mundiwindi (about 300 kms south), Wiluna (about 700 km south) and Roebourne (about 300 km east) as neighbouring stations suitable for comparison, specifically for fixing the perceived ‘discontinuity’ in 1944 created by the apparent station move.

The annual average maximum temperatures from the comparison sites move up and down in unison with the Marble Bar data including for the period from 1930 to 1940, as shown in Figure 1. This suggests that there is nothing wrong with the historical temperature observations for Marble Bar. And that feeding these stations together into the percentile matching algorithm would result in only minimal changes.

Figure 1. Maximum Temperatures Recorded at Marble Bar and Comparison Stations

The Bureau has listed Mundiwindi, Roebourne and Wiluna as comparison stations for Marble Bar.

Yet, the cumulative changes made to the original observations from Marble Bar in the creation of the new ACORN-SAT series (using the ‘nearby’ stations) make the new ACORN-SAT series less like the data from the nearby comparison stations.

The consequence of the changes to the maximum temperature series is that what was a cooling trend for Marble Bar of -0.6 °C per century from 1910 to 2005 in the original historical observations, becomes a warming trend of +0.396 °C per century from 1910 to 1918 in ACORN-SAT version 1, as shown in Figure 2. When ACORN-SAT version 1 was updated late 2018 to ACORN-SAT version 2, an even more significant +0.7 °C warming trend was generated for Marble Bar. ACORN-SAT version 2 is now the official temperature data base for Australia.

Figure 2. Historical Observations (blue) and Remodelled (red and orange)

The historical observations for Marble Bar (the raw data) from 1910 to 2005 indicate a cooling trend, this has been changed to a warming trend of 0.7 degrees Celsius per century in ACORN-SAT Version 2.

CHANGES TO INDIVIDUAL DAYS VERSUS CUMULATIVE

While the cumulative consequence of all the changes is a warming trend +0.7 °C Celsius per century in ACORN-SAT version 2, the changes are actually made to the daily values, as shown in Table 1.

Table 1. Temperatures for Six Days in November 1923

The daily values as recorded in the different databases for Marble Bar.

So while the actual temperature recorded at Marble Bar on 18th November 1923 was 44.7 °C, this has been changed to 43.7 in ACORN-SAT version 2. This is a difference of one whole degree, as shown in Table 1.

The difference is only 0.2 degrees on 21st November. This lack of consistency in the fiddling is because the Bureau applies what is called a percentile matching algorithm to generate the new temperature series. To quote from the relevant peer-reviewed paper as published by the Royal Meterological Society (International Journal of Climatology, Volume 33):

For the purposes of merging station series and correcting inhomogeneities, the data set has been developed using a technique, the percentile-matching (PM) algorithm, which applies differing adjustments to daily data depending on their position in the frequency distribution. This method is intended to produce data sets that are homogeneous for higher-order statistical properties, such as variance and the frequency of extremes, as well as for mean values. The PM algorithm is evaluated and found to have clear advantages over adjustments based on monthly means, particularly in the homogenization of temperature extremes.

TWO TEMPERATURE DATA BASES

Not many people are aware that the Bureau actually holds two very different temperature databases. Mostly, it uses what is called ACORN-SAT version 2 (Australian Climate Observations Reference Network – Surface Air Temperature) for generating trends and announcing record hot years. This database also contains all the values that are sent to the United Nation’s International Panel for Climate Change (IPCC).

The other database includes the historical values more or less as originally recorded. This is called the Australian Data Archive for Meteorology (ADAM), also known as the Climate Data Online (CDO). This database has a reasonable amount of integrity and generally reflects values actually recorded across Australia. There are nevertheless some issues with ADAM. The mix of stations is changing, with stations that have recorded colder temperatures closed down. For example, Charlotte Pass on the slopes of Mount Kosciuszko holds the record for the coldest temperature ever recorded on mainland Australia at −23 °C on 19 June 1994. Inexplicably, this station was closed down in March 2015. Also of concern is that there was a period when lower limits were set on how cold temperatures could be recorded, for example the limit that was set at Goulburn of −10 °C between the years 2007 and 2017 and at Thredbo between 2002 and 2017.

Also, some ‘inconvenient’ early hot records have been deleted, for example 51.7 °C recorded at Bourke in western New South Wales on 3 January 1909. This record needs to be reinstated as it is the hottest day ever recorded in Australia using standard equipment, properly calibrated and in a Stevenson Screen. The Bureau’s only excuse for deleting it is that it was recorded on a Sunday, and the weather observer was not meant to come in on that day.

The existence of these two date bases is not denied by the Bureau, but interestingly key Australian Broadcasting Corporation journalists cannot bring themselves to acknowledge this fact. This is perhaps because of all the complications it raises.

LET US GET IT CHANGED BACK

The Bureau has a long history of making nonsense changes to important historical temperature data series. I’ve previously documented the situation at Rutherglen (Victoria), Bourke (New South Wales), Darwin (Northern Territory) and Amberley (Queensland).

I’ve been trying to get something done about this since at least 2014. Ministers within the current cabinet who are across this issue include Greg Hunt and Josh Frydenberg. So far, they have refused to do anything about it, because they apparently do not want the Australian public to lose confidence in the Bureau.

I suggest we begin a campaign, in the first instance to have the correct temperatures for Marble Bar for the period of the heatwave, which was from 31 October 1923 to 7 April 1924, included in the official temperature record. This will require the Bureau to notify the relevant IPCC working group that is currently incorporating the incorrect values into their Sixth Assessment report, which is being used for the first global stocktake under the Paris Agreement.

Filed Under: Information Tagged With: Temperatures

Cooling the Past: Made Easy for Paul Barry

February 6, 2020 By jennifer

It is not disputed that Blair Trewin under the supervision of David Jones (both working at the Australian Bureau of Meteorology) remodel all the historical temperature data generating trends and statistics that look quite different from the actual measurements.

The remodelled series are then passed on to university and CSIRO climate scientists who base much of their climate research on these ‘second-hand’ statistics.

So, when Michael Mann and David Karoly tell you it’s getting hotter and hotter, this is their interpretation of Blair Trewin’s statistics, not their interpretation of the actual data.

When I say there needs to be more scrutiny of what Blair does to the actual measurements, I’m simply making a request.

As Andrew Bolt explains in his column yesterday harshly entitled ‘On the deceit of Paul Barry’:

Marohasy does not say the Bureau is “part of a huge conspiracy”. What she does say is undeniably true: the Bureau has repeatedly adjusted its data, with the result that the past looks cooler and therefore the warming greater.

The only dispute is over whether the Bureau has done this correctly, to make the data more accurate. It says yes, Marohasy says no.

What evidence does Barry offer that she’s wrong? None. No interest. All he has is mockery and an appeal to his mob.

Thanks Andrew, for explaining the situation so succinctly.

It is the case that none of the adjusting is denied by Blair at the Bureau.

To help Paul Barry and others explore what Blair has actually done, my colleague Jaco Vlok has created a table with an interactive drop-down menu for each of the 112 weather stations with remodelled data.

The adjusting is laid-out, and explained here:

https://jennifermarohasy.com.dev.internet-thinking.com.au/acorn-sat-v1-vs-v2/

Go and have a play!

For example, if you click on the link, and scroll down (the 112 stations are listed alphabetically) all the way to Wagga, and then across to TMax you will find a chart that shows the raw data, and then the Blair Trewin reconstructions for this weather station that is used to calculate national averages and global warming.

One of the charts from the drop-down table created for Paul Barry by my friend and colleague Jaco Vlok.

First Blair created ACORN V1, that was back in 2011.

ACORN V2 is the data reworked to further increase the rate of warming.

Thanks Jaco. Thanks Andrew.

Now, Paul … go and have a look, and play. It is not a conspiracy, nor is it rocket science. But understanding can take time, especially when it is not what you might expect Bureau employees to be doing to the historical temperature data.

****
The feature image shows Jaco Vlok (far left) backing me up in a dispute about the value of remodelling historical temperature data.

Filed Under: Information Tagged With: temperates

Leaning on the Lookouts, at the Great Barrier Reef

January 25, 2020 By jennifer

Being able to sink below the waves at the edge of Australia’s continental shelf with the reef sharks and the colourful corals, is a rare privilege that I enjoyed just last week. It is possible because Jacques Cousteau invented the aqualung in 1942 providing a system for breathing and swimming safely at depth.

Ribbon Reef No. 10 is the longest of these most northern outer barriers with an inside (westerly-facing) edge that drops to 40 metres and an outside (easterly-facing) edge that drops vertically to 2,000 metres. This Ribbon also has what are called ‘Patches’, as shown in the screen shot from drone footage.

At the southern tip of this ribbon is an opening that was once where the Starke River entered the sea; that was more than 16,000 years ago when sea levels were up to 120 metres lower than they are today. This opening is between Ribbon No. 10 and Ribbon No. 10, Patches No. 3.

Goggle Gardens is a dive site on the sheltered side of Ribbon No. 10, Patches No. 3 (GBRMPA Number 14-153).

That river canyon is now underwater with strong currents, that wash in nutrient rich upwelling from the Pacific Ocean twice a day. The water rushes in, and then out. So I was pleased that there was a lookout on the top deck of our boat the entire time I was diving, with a tender handy, should I come up in a current that I couldn’t kick against and needed to be picked up. In fact, I always surfaced at the stairs to the boat, thanks to the great navigation skills of my underwater buddy.

Leaning on the Lookout while flying my drone Skido from the top deck.

On the sheltered side of Ribbon No. 10, Patches No. 3, is the dive site known as Goggle Gardens. The corals here are at 15 metres and were totally bleached white from March to October 2016.

What I learnt from a diver and her photographs is that white and bleached coral is not necessarily dead coral. The zooxanthellae — unicellular algae that give coral its colours and normally feeds it with energy from the sun via photosynthesis — were expelled, as the corals were stressed by the exceptionally warm waters during the summer of 2015 – 2016.

But the corals at this dive site did not die.

Coral polyps also have tentacles, and these tentacles were used to feed on small animals and plankton and also to clean away bad algae that would otherwise settle and smother it.

So, corals are not necessarily totally dependent on zooxanthellae, they can be omnivorous.

In fact, bleached coral can take-back zooxanthellae, become colourful again, and reshoot after months of being stark white and bleached.

I hope to show how this happened at this dive site in my next mini-documentary.

I’ve even been told, and may be able to get footage, of bleached corals spawning!

My buddy and underwater photographer dived this site three times last week, and we have so much footage. If you want to know exactly when this film will be released, then consider subscribing for my irregular e-newsletters.

Corals at a dive site knowns as Twin Towers, photographed in January 2020.

*********
The feature image at the very top of this post is me with a large and friendly Potato cod, taken at one of the Ribbon reefs in January 2020.

UPDATE 10TH FEBRUARY 2020:
The map has been replaced from the original posting, I had incorrectly referred to Patches No. 3 as Ribbon No. 11. There is no Ribbon No. 11.

Filed Under: Information, Uncategorized Tagged With: Great Barrier Reef

  • « Go to Previous Page
  • Go to page 1
  • Interim pages omitted …
  • Go to page 9
  • Go to page 10
  • Go to page 11
  • Go to page 12
  • Go to page 13
  • Interim pages omitted …
  • Go to page 445
  • Go to Next Page »

Primary Sidebar

Recent Comments

  • Ian Thomson on Vax-ed as Sick as Unvax-ed, Amongst My Friends
  • Dave Ross on Vax-ed as Sick as Unvax-ed, Amongst My Friends
  • Dave Ross on Vax-ed as Sick as Unvax-ed, Amongst My Friends
  • Alex on Incarceration Nation: Frightened of Ivermectin, and Dihydrogen monoxide
  • Wilhelm Grimm III on Incarceration Nation: Frightened of Ivermectin, and Dihydrogen monoxide

Subscribe For News Updates

  • This field is for validation purposes and should be left unchanged.

November 2025
M T W T F S S
 12
3456789
10111213141516
17181920212223
24252627282930
« Jan    

Archives

Footer

About Me

Jennifer Marohasy Jennifer Marohasy BSc PhD has worked in industry and government. She is currently researching a novel technique for long-range weather forecasting funded by the B. Macfie Family Foundation. Read more

Subscribe For News Updates

Subscribe Me

Contact Me

To get in touch with Jennifer call 0418873222 or international call +61418873222.

Email: jennifermarohasy at gmail.com

Connect With Me

  • Facebook
  • LinkedIn
  • RSS
  • Twitter
  • YouTube

Copyright © 2014 - 2018 Jennifer Marohasy. All rights reserved. | Legal

Website by 46digital