• Skip to primary navigation
  • Skip to main content
  • Skip to primary sidebar
  • Skip to footer
Jennifer Marohasy

Jennifer Marohasy

a forum for the discussion of issues concerning the natural environment

  • Home
  • About
  • Publications
  • Speaker
  • Blog
  • Temperatures
  • Coral Reefs
  • Contact
  • Subscribe

Cohenite

Temperature Trends and Carbon Dioxide: A Note from Cohenite

October 5, 2008 By Cohenite

Hi Jennifer,


Looking at the temperature trends from 1900-2008, it is not clear that there is a carbon dioxide signal.


In a recent post I looked at how base periods can create an artificial upwards temperature trend;


https://jennifermarohasy.com.dev.internet-thinking.com.au/blog/archives/003303.html#comments


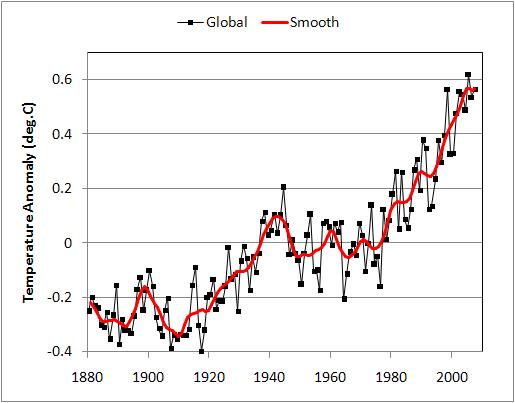
The 20thC featured 2 El Nino dominated climate patterns (+ve PDO), and one La Nina phase (-ve PDO) from 1940-1976. The temperature trend in the first +ve PDO is almost identical to the temperature trend in the second +ve PDO;


http://tamino.files.wordpress.com/2008/01/smooth.jpg


The similar slopes at the beginning and end of the 20thC represent warming WITHIN the +ve PDO’s, while the lower starting point for the first +ve PDO is an artifact of the 1951-1980 GISS base period. The GISS graph also shows post 1998 temperatures as increasing. This is contradicted by the other temperature data collectors, which show a decreasing trend consistent with the emergence of another –ve PDO post 2001 (discussed below). The issue is, what would be the temperature trend be with ENSO removed and what part would CO2 play in causing that residual trend?


In a recent paper, David Douglass and John Christy isolate a temperature trend due to CO2 forcing, independent of feedback (ie: the enhanced greenhouse) and natural factors such as ENSO and volcanic effect;


http://arxiv.org/ftp/arxiv/papers/0809/0809.0581.pdf


Douglass and Christy’s (DC) study is based on 1979-2008 UAH non-surface data. After extracting ENSO, volcanoes and allowing for latitude band effects, they isolate a CO2 signal of+0.070g/decade; where g is the gain due to any feedback. In respect of ‘g’ DC note “there is general agreement among climate scientists for the case of no feedback”. (p3).


DC estimate there is an undeducted solar irradiance forcing (SF) of 20% (p10), or +0.014C per decade. This generally agrees with AR4’s figure for SF of +0.12Wm-2, which translates to a temperature of +0.16C per century (see Chp 2 pp 187-193). AR4 has reduced this SF figure from TAR’s estimate of +0.3Wm-2, or a temperature increase of approximately 0.4C PC (see 6.11.1.2; FIG 6). The AR4 amount for SF is based on the period from 1750-present, but, according to FIG 2.17, the bulk of the SF has occurred in the 20thC. DC’s SF estimate seems about right then.


So, deducting DC’s SF from +0.07 – +0.014 = +0.056C PD for a CO2 signal in the period 1979-2008.


However, DC note that “the global atmospheric temperature anomalies of Earth reached a maximum in 1998 which has not been exceeded during the subsequent 10 years”. (Abstract). As noted above, GISS is showing increasing post 1998 temperature, so what is happening in the 21stC?


In an analysis based on the period 2001-2008 Lucia also removed ENSO from 5 of the temperature indices;


http://rankexploits.com/musings/wp-content/uploads/2008/07/ipcc-falsifies-gavin.gif


For a full discussion of Lucia’s analysis see;


http://rankexploits.com/musings/2008/gavin-schmidt-corrects-for-enso-ipcc-projections-still-falsify/


Lucia has applied 2 statistical approaches to all post 2000 data, GISS, HadCrut, NOAA, UAH and RSS, and obtained a combined result for OLS of -0.3C(+-1.6) PC, and for Cochrane-Orcutt, -0.6C(+-1.5) PC.


Averaging the 2 methodologies gives an ENSO free temperature trend for 2001-2008 of-0.45C or a decadal trend of -0.045C. Lucia has not adjusted for volcanoes as there were no proximate eruptions, or for SF. If an offset for SF of +0.014C is made, this would produce an underlying cooling trend of -0.059C PD, presumably due to CO2.


So, in summary:


1.     AR4 notes that “Most of the observed increase in global average temperatures since the mid-20thC is very likely due to the observed increase in anthropogenic gas concentrations” (Executive Summary, CHP 2)

2.     AR4 allocates a Radiative Forcing to the combined GHG’s of 2.63Wm-2; CO2 is allocated a RF of 1.66Wm-2, or 2/3’s of the total RF.

3.     The RF for CO2 is estimated by AR4 to lead to an increase in temperature from a doubling of CO2 of ~ 3C. CO2 has increased ~ 40% since 1900. This should have produced a temperature increase of 1.2C or 0.12C PD.

4.     Applying AR4’s quotient for CO2 RF of 2/3 to the findings of DC and Lucia we obtain the following CO2 signals; DC = +0.056  3 x 2 = + 0.037C PD for the period 1979-2000; for Lucia = -0.059  3 x 2 = -0.039C PD for the period 2001-2008.

5.     A further complication applies to the first ½ of the 20thC temperature trends. There was less CO2 and GHG’s prior to 1976, yet the temperature trends at the beginning of the 20thC, as shown by GISS above and HadCrut are very similar; http://i32.tinypic.com/2s01m5y.jpg

6.     Then, of course, there is the 30 year decline in temperatures from 1940-1976 when CO2 was increasing.

7.     DC and Lucia have found a CO2 signal. It is inconsistent, I draw 3 conclusions;

a) The inconsistency found by DC and Lucia reflects the contrary movements of CO2 and temperature apparent during the rest of the 20thC and history generally.

b) IPCC forcing estimates for CO2 are grossly over-inflated. Even more so when enhanced greenhouse, “g”, is quantified with +ve feedback.

c) In respect of “g”; if the CO2 signal is larger than that found by DC and Lucia, then –ve feedbacks would have to be much greater. These –ve feedbacks cannot be aerosols (see DC p 12), or ENSO as suggested by Keenlyside et al. Perhaps climate sensitivity to SF is greater than AR4 assumes.


Cheers, Cohenite

Newcastle, Australia

Filed Under: Community, Opinion Tagged With: Climate & Climate Change

Ten of the Worst Climate Research Papers: A Note from Cohenite

September 18, 2008 By Cohenite

As a layman reading the literature and arguments in support of Anthropogenic Global Warming (AGW) three defining characteristics of those arguments have become apparent.


The first is the idea that the science is settled and that there is a consensus in favor of this science. This is wrong and the Oreskes thesis has been repudiated.  


Secondly, the pro-AGW literature uses terms of apocalyptic consequence; we read about tipping points, rapid sea rises and extreme weather. Because of this, pro-AGW statements often take on a ghoulish, vulture-like quality with every bad climate event being hailed as proof of AGW. But again, there is no compelling evidence that the climate is becoming more extreme or worse than it has been.


The third and most striking characteristic are the computers, the General Circulation Models (GCMs), which are the basis of AGW science. They have informed the msm to the extent that nearly every report confirming AGW (are there any other kind?) begins with ‘computer modeling has shown’…etc.


The result of the dominance of GCM’s has seen a growth in what Aynsley Kellow, Professor and Head, School of Government, University of Tasmania, calls climate virtual reality where there is a persistent conflict between GCM evidence and empirical data.


What stands out for me in this debate is the clash between real data and AGW data and the repeated examples where data has been manipulated, adjusted, discarded or subject to arcane statistical methodology so it conforms with the GCM simulations.


All of the 10 papers, statements and articles I have selected as the worst of the pro-AGW support literature exhibit the above 3 qualities. Some of them have iconic status and others, while more obscure, present such glaring examples of this matrix science, or climate virtual reality, that they cannot be ignored.


1.Dr James Hansen’s 1988 Statement to the US Senate.

http://image.guardian.co.uk/sys-files/Environment/documents/2008/06/23/ClimateChangeHearing1988.pdf

Hansen is the public face of AGW science. This statement establishes all 3 of the defining characteristics. He says “the earth is warmer in 1988 than at any time in the history of instrumental measurements.” Why then does GISS adjust their US data to stop the ‘30’s being the warmest decade? He says the greenhouse effect is proven; why then does IPCC have to invent the enhanced greenhouse? He takes pride in his “computer climate simulations”. Money for jam for Koutsoyiannis.


2. Dr James Hansen’s 2008 Anniversary speech before the US Congress.

http://www.worldwatch.org/node/5798

After 20 years of climate zilch Hansen ups the apocalypse ante; tipping points are now “ominous”, AGW is a “time bomb”, and there is a need to “preserve our planet, and creation.” The public face of AGW is now Moses. Amidst the blatant untruths there is a resonant irony; “The fossil fuel industry maintains its stranglehold…via demagoguery.” Is Hansen the copper or the kettle?


3. Michael Mann et al (MBH): Northern Hemisphere Temperatures During the Past Millennium: Inferences, Uncertainties and Limitations. AGU GRL 1999

http://www.ncdc.noaa.gov/paleo/pubs/mann_99.html

The Hockey stick is the figurehead of the good ship AGW. If anyone says that it is not essential for AGW to prove that 20thC temperatures are higher than any other time in recent history they are dreaming. MBH do so using tree-rings and esoteric statistical analysis (Principle Component Analysis); they ignore discrepancies with instrument data and obfuscate about their sources. McIntyre eats them for breakfast.


4. Eugene R. Wahl and Caspar M. Ammann: Robustness of Mann, Bradley, Hughes; Reconstruction of Northern hemisphere surface temperatures: Examination of criticisms based on the nature and processing of proxy climate evidence.

http://www.cgd.vcar.edu/ccr/ammann/millennium/refs/Wahl_ClimChange.2007.pdf

Before the Hockey stick could be used in AR4 it needed to be rehabilitated after McIntyre’s, and others’, demolition. Wahl et al said they had a new standard for Reduction of Error verification, i.e. zero=skill. McIntyre wanted proof. Wahl procrastinated until AR4 was published and then said the proof was that the new verification had been referred to in their paper. Fidus Achates writ large.


5. Mann et al (part 2): Proxy-based reconstructions of hemispheric and global surface temperature variations over the past two millennia.

http://www.pnas.org/content/early/2008/09/02/0805721105.full.pdf

Rehabilitated, Mann threw out the tree-rings and used an even more esoteric form of statistical analysis (PCA) to produce data so robust it could withstand minimal correlation with instrument records and 2 confirming dates over a millennium in some of the proxy series. McIntyre couldn’t believe it, but Tamino, in praising Mann’s use of whatever form of PCA he used, is taken to task by Ian Jolliffe, the world’s leading expert on the method, whatever it is. Jolliffe is nonplussed and declares, “This is just plain wrong.”


6. Spencer Weart: A Saturated Gassy Argument.

http://www.realclimate.org/index.php/archives/2007/06/a-saturated-gassy-argument/

This is the user friendly version of AGW’s semi-infinite atmospheric model; this model ‘shows’ that vertical layers of CO2 trap and delay the rise of surface emitted IR. If it was right there would be a troposphere hotspot/fingerprint as unequivocally predicted in AR4 by FIG 9.1(c). The satellite and other data collectors show there is none.


7. Robert J. Allen, Steven C. Sherwood: Warming maximum in the tropical upper atmosphere deduced from thermal winds. Nature Geoscience 25 May 2008

http://lubos.mtol.gogglepages.com/sherwood-allen-ngeo-2008.pdf

Concerned that the instruments showed no troposphere hotspot, Allen & Sherwood repudiated the instrument data and developed a windshear model which showed if there was windshear there would be warming. Matrix science. Resonant irony; the instruments which were not good enough for temperature were used to establish windshear and model predicted temperature.


8. Rolf Philipona et al: Radiative forcing-measured at Earth’s surface- corroborate the increasing greenhouse effect. Geophysical Research Letters, Vol 31 2004

Anthropogenic greenhouse forcing and strong water vapor feedback increase in Europe. Geophysical Research Letters, Vol 32 2005

http://www.agu.org/pubs/crossref/2004/2003GL018765.shtml

http://www.agu.org/pubs/crossref/2005/2005GL023624.shtml

2 papers from Philipona who deals with increasing downward longwave (DLR). If the semi-infinite model is correct, as well as a troposphere hotspot, there will be increased clear-sky LDR. This is a crucial point but Philipona’s studies are flawed by statistical method, inadequate study period, selective use of insolation and temperature data and extrapolation from regionalized Stefan-Boltzman.


9. AR4, Chapter 2; Changes in Atmospheric Constituents and Radiative Forcing; Executive Summary; pp131-132.

http://ipcc-wg1.ucar.edu/wg1/Report?Ar4WG1_Print_Ch02.pdf

The science is settled. The standard of scientific understanding in the Executive Summary ranges from “very high” to “very low”; the great majority of climate indices have “medium-low” to “very low” levels of scientific understanding; yet the Summary concludes that “humans have exerted a substantial warming influence on climate.” Diagnosis: scientific schizophrenia.


10. Keenlyside N S, Latif M, Jungclaus J, Kornblueh L, Roeckner E: Advancing decadal-scale climate prediction in the North Atlantic sector. Nature 453, 84-88 May 2008

http://www.nature.com/nature/journal/v453/n7191/full/nature06921.html

Both sides of the debate claimed this paper as proving/disproving AGW. The paper asserts that natural, contrary climate patterns can “temporarily offset the projected anthropogenic warming.” To this layman that has a Claytons feel about it, but the kicker is Lucia’s 2001 and onwards temperature analysis; Lucia removed the ENSO and found a decline in post-2001 temperature trend. If there was an underlying warming it would have shown. How can anthropogenic warming be “temporarily offset” when it isn’t there?


These papers and articles and statements are the worst because they exhibit all three defining characteristics of AGW science. Some are indefensible, others don’t make sense.


*******

To read the ten best climate research papers according to Cohenite, click here .

how to overcome the fear of public speaking

Filed Under: Opinion Tagged With: Climate & Climate Change

Ten of the Best Climate Research Papers (Nine Peer-Reviewed): A Note from Cohenite

September 10, 2008 By Cohenite


The accusation of a lack of peer review (PR) by those who mount arguments against anthropogenic global warming (AGW) is at the heart of the elitism, consensus and ad hominem approach used by many supporters of AGW.  

It is a red herring.  Science should be like the Law; transparent and universally accessible. 


It should not be used by specialists to dominate the general populace, or to promulgate ideological based alterations to the social and economic structure. Nor should it be used to stifle debate because, apart from anything else, the importance of science is diminished by such oppression. Because the AGW advocates have used such tactics, and been supported by a sizeable proportion of the mainstream media, the importance of blogs has grown. Their importance has also been highlighted by the degree of vitriol leveled at anti-AGW sites.


Most of all the PR argument is simply wrong.


As a layman my AGW education curve has been steep. But it has been informed by a number of peer reviewed papers which have provided substantial critiques of AGW. In the interest of providing a rebuttal to the insidious PR stigma I present my ‘top 10’ papers which mount arguments against AGW, nine of them peer-reviewed.


I have had to exclude a number of valuable articles; the McLean and Quirk paper on the Great Pacific Climate Change was my first exposure to the misrepresentation of temperature base periods; the first Beck paper is a notable exclusion; the castigation against Beck was particularly condescending and elitist, no doubt because he does not have a PhD; likewise none of the valuable contributions made by Monckton, Watts, Castles, Hughes, Lucia, Bob Tisdale or Steve Short are eligible.


But I am going to list 10 papers, and start with a non peer-reviewed paper as an exception because of his sustained and exemplary efforts, any one of which is worthy of a Doctorate.


1. Steve McIntyre’s Ohio State University Address;

How do we “know” that 1998 was the warmest year of the millennium? (May 16, 2008)

http://www.climateaudit.org/pdf/ohio.pdf

This is a seminal paper which synthesizes all the errors and obfuscations to do with the Hockey Stick. It also demonstrates McIntyre’s methodical, scientific and unadorned approach to the issue.


2. Craig Loehle’s paper;

A 2000-year global temperature reconstruction based on non-tree ring proxies, Energy & Environment 18(7-8): 1049-1058. 2007

http://www.ncasi.org/publications/Detail.aspx?id=3025

This paper was important because it was a counterpoise to Mann’s tree-ring data and provided good support for the Medieval Warming Period, a major obstacle to AGW.


3.Douglass, Christy et al; this is the first of the GCM critiques;

A comparison of tropical temperature trends with model predictions. International Journal of Climatology, 2007

http://www.scribd.com/doc/904914/A-comparison-of-tropical-temperature-trends-with-model-predictions?page=6

http://www.climateaudit.org/?p=3058

This paper really touched a nerve and the level of hostility leveled at it was astounding; it mostly boiled down to nit-picking about Raobcore data and whether a falsification was distinct from a bias. The second link is to an addendum to the paper; comments 69-74 are entertaining.


4.Koutsoyiannis et al;

http://www.itia.ntua.gr/en/docinfo/850

Assessment of the reliability of climate predictions based on comparisons with historical time series.  Geophysical Research Abstracts, 2008

This link is to the first presentation. This was a crucial paper; it covered the 18 year predictive history of the GCM’s on a regional basis; regionalism is the Achilles Heel of AGW.


5.Stockwell;

http://landshape.org/stats/wp-content/uploads/2008/08/article.pdf

Tests of Regional Climate Model Validity in the Drought Exceptional Circumstances Report. 2008

This paper did the job on CSIRO and demonstrated the political imput into the AGW science.


6. Misckolczi;

Greenhouse effect in semi-transparent planetary Atmospheres.  Quarterly Journal of the Hungarian Meteorological Service, Vol. 111, No. 1, January–March 2007, pp. 1–40.

http://met.hu/doc/idojaras/vol111001_01.pdf

This is my favourite. It has everything; the dead hand of AGW censorship, and the demolition of the AGW’s semi-infinite opaque layered atmosphere. People have quibbled about the Kirchhoff equations but Miskolczian –ve feedbacks have been established.


7. Essex, McKitrick, Andresen;

Does a Global Temperature Exist? Journal of Non-EquilibriumThermodynamics, 32 (1) 1-27.   2007

http://www.reference-global.com/doi/abs/10.1515/JNETDY.2007.001?cookieSet=1

The fallacy of a global average temperature was taken to task in this paper, and, again, the reaction was hostile. This paper wittily compared averaging temperature to averaging the phone book; an important addition to the regionalism lexicon.


8. Spencer and Braswell;

Potential Biases in Feedback Diagnosis from Observational Data: A simple Model Demonstration, Journal of Climate.

 http://ams.allenpress.com/perlserv/?request=get-abstract&doi=10.1175%2F2008JCLI2253.1

No list would be complete without Mr Cloud and –ve feedback. As well, Spencer has been a bastion of reliable temperature data. This was still a close call. Minschwaner and Dessler’s paper on RH decline as a response to increasing CO2 is a crucial paper, conforming to Miskolczi’s feedbacks.


9.Chilingar;

Cooling of Atmosphere Due to CO2 Emission, Energy Sources, Part A: Recovery, Utilization, and Environmental Effects.  Volume 30, Issue  1, January 2008 , pages 1 – 9

http://dx.doi.org/10.1080/15567030701568727

An important paper about convective heat transfer which relegates CO2 radiative heating to its proper subordinate position; and incorporates atmospheric pressure as a heating factor. Thanks to Louis for alerting me to the paper. An honourable mention to the Gerlich and Tscheuschner paper on the fallacy of the greenhouse concept and a host of other errors AGW science makes.


10. Pielke Sr et al;

Unresolved issues with the assessment of multidecadal global land surface temperature trends. Journal of Geophysical Research, Vol 112. 2007.

http://climatesci.colorado.edu/publications/pdf/R-321.pdf

An elegant paper which uses Stefan-Boltzman to support regionalism and show that the notion of a radiative imbalance is defeated by regional temperature based energy differentials. Somewhat superfluous since AR4, FIG 1 shows no global radiative imbalance.


Given the above, what 10 papers can AGW supporters produce to vindicate AGW?


Cohenite,

Newcastle, Australia

Filed Under: Opinion Tagged With: Climate & Climate Change

  • « Go to Previous Page
  • Go to page 1
  • Go to page 2
  • Go to page 3

Primary Sidebar

Recent Comments

  • Ian Thomson on Vax-ed as Sick as Unvax-ed, Amongst My Friends
  • Dave Ross on Vax-ed as Sick as Unvax-ed, Amongst My Friends
  • Dave Ross on Vax-ed as Sick as Unvax-ed, Amongst My Friends
  • Alex on Incarceration Nation: Frightened of Ivermectin, and Dihydrogen monoxide
  • Wilhelm Grimm III on Incarceration Nation: Frightened of Ivermectin, and Dihydrogen monoxide

Subscribe For News Updates

  • This field is for validation purposes and should be left unchanged.

November 2025
M T W T F S S
 12
3456789
10111213141516
17181920212223
24252627282930
« Jan    

Archives

Footer

About Me

Jennifer Marohasy Jennifer Marohasy BSc PhD has worked in industry and government. She is currently researching a novel technique for long-range weather forecasting funded by the B. Macfie Family Foundation. Read more

Subscribe For News Updates

Subscribe Me

Contact Me

To get in touch with Jennifer call 0418873222 or international call +61418873222.

Email: jennifermarohasy at gmail.com

Connect With Me

  • Facebook
  • LinkedIn
  • RSS
  • Twitter
  • YouTube

Copyright © 2014 - 2018 Jennifer Marohasy. All rights reserved. | Legal

Website by 46digital