• Skip to primary navigation
  • Skip to main content
  • Skip to primary sidebar
  • Skip to footer
Jennifer Marohasy

Jennifer Marohasy

a forum for the discussion of issues concerning the natural environment

  • Home
  • About
  • Publications
  • Speaker
  • Blog
  • Temperatures
  • Coral Reefs
  • Contact
  • Subscribe

Archives for December 2019

What Can You See, Indicating Sea Levels are Rising?

December 28, 2019 By jennifer

Many Australians are fearful of catastrophic human-caused climate change because this is what the state-sponsored propaganda on the Australian Broadcasting Corporation (the ABC) tells us.

In Australia, we mostly live near the sea. All along our coastline there is evidence of sea level fall, yes fall.*

Where is the evidence for rising sea levels?

Will you see how much sea levels have risen when you watch the fireworks over the Opera House in Sydney Harbour this New Year’s Eve — or will you see evidence of sea level fall?

It is that time of year when family and friends visit me at the beach. My niece told me just before Christmas that she had read so many of the comments at the YouTube thread following my first short film ‘Beige Reef’. She was surprised at how many comments there were — an awful lot she commented.

When I asked her what she thought of the film, she told me that she had not actually watched the film.

At that morning tea, under a shelter at Coolum Beach, none of my nieces or nephews or older brother could admit to having watched the film.

It is all of 12 minutes long.

This first film involved me wading into, and diving below, waters that my sister-in-law some weeks earlier had indicated put me at risk of a shark attack. But still she has not actually watched the film.

I know that there is fear within the varies communities within which I exist, of at least three things: sharks, catastrophic human-caused global warming — and that I could lead some of them down the path of global warming scepticism and from this they could end-up pariahs.

I diverge.

The best evidence is that global sea level has fallen by at least 2 metres since the the Holocene high stand about 4,000 BC; that is about 6,0000 years ago, a time known as the Minoan warm period.

The evidence in rocks and cliff faces all along the Australian east coast is that sea level was about 1m higher in the Roman warm period (year 0), and about 0.5m higher in the Medieval warm period (1,000 AD).

Conversely, it is believed the sea level was lower in the cold periods of 500 AD (Dark Ages) and the Little Ice Age (1,650 AD), maybe both 0.2 — 0.5 metres below today’s level. This last low sea level is particularly important, because it from this base sea levels are perhaps still rising back to average Holocene levels. But are they really?

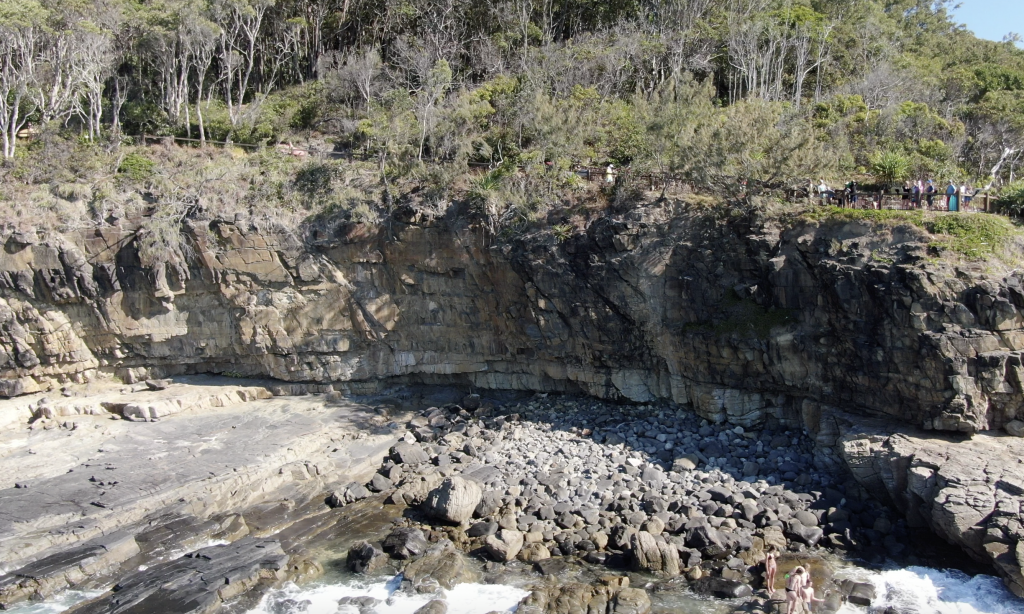
When I go kayaking, and walk along the sea shore, and send my drone Skido up into the sky and look down and take pictures of things like marine potholes that feature at the top of this blog post: I see evidence for a sea shore that is receding.

The sea begins at the land’s edge. Where the sea begins is the ‘sea level’.

When I stand beside the circular pothole that you can see in the centre of the picture accompanying this blog post (… scroll to the very top).

I’m standing on a wave-cut platform of sandstone bedrock with rectangular fractures, and red iron oxide colouring.

Potholes are formed by the relentless grinding of harder rocks — perhaps granite— caught in a depression in this softer sandstone. Pounding surf causes the harder rocks to swirl — round and round — grinding down.

The grinding that created these potholes could only have happened when sea levels were higher, when this platform was between the high and low tide marks.

I took the picture on a highest tide this last year, in 2019. A year that is nearly over.

Sea levels must have been higher in the past. Because even on the highest tides this last year, the waves never reached this far?

The ABC may be concerned about rising sea levels, but where is your evidence for it? Are you brave enough, do you care enough, can you find the time enough, to think through some of these issues this next year: in 2020?

We are all entitled to our own opinions, but not our own facts.

I photographed this cliff face just to the north-west of the pot holes, which is just to the north-west of my favourite beach in Noosa National Park, so near where I live. What can you see in this landscape? Is there a wave cut platform, and what might have created it? Have you seen similar along other sections of sea shore?

______________________

* This is intended as the first of a series of blog posts on sea level change.

Filed Under: Information Tagged With: sea level change

New Record Temperatures Need Justification

December 20, 2019 By jennifer

IN September 2017, the Bureau declared the hottest ever September on record for the state of Victoria based on temperature data from Mildura.

I’ve since shown that this was helped along by the Bureau replacing a mercury thermometer with an electronic probe that can record a good 0.4 degrees hotter for the same weather.

There is not only the issue of the Bureau not providing any information on how the electronic probe was calibrated, but as I’ve explained to the Chief Scientist, there is also the issue of averaging:

There is a lot of natural variability in air temperature (particularly on hot sunny days at inland locations), which was smoothed to some extent by the inertia of mercury thermometers. In order to ensure some equivalence between measurements from mercury thermometers and electronic probes it is standard practice for the one-second readings from electronic probes to be averaged over a one-minute period, or in the case of the US National Weather Service the averaging of the one-second readings is over 5 minutes.

The Australian Bureau began the change-over to electronic probes as the primary instrument for the measurement of air temperatures in November 1996. The original IT system for averaging the one-second readings from the electronic probes was put in place by Almos Pty Ltd, who had done similar work for the Indian, Kuwaiti, Swiss and other meteorological offices. The software in the Almos setup (running on the computer within the on-site shelter) computed the one-minute average (together with other statistics).

This data was then sent to what was known as a MetConsole (the computer server software), which then displayed the data, and further processed the data into ‘Synop’, ‘Metar’, ‘Climat’formats. This system was compliant with World Meteorological Organisation (WMO) and the International Civil Aviation Organisation (ICAO) standards. The maximum daily temperature for each location was recorded as the highest one-minute average for that day. This was the situation until at least 2011.

I have this on good advice from a previous Bureau employee.

It is likely to have been the situation through until perhaps February 2013 when Sue Barrell from the Bureau wrote to a colleague of mine, Peter Cornish, explaining that the one-second readings from the automatic weather station at SydneyBotanical Gardens were numerically-averaged. At some point over the last five years, however,this system has been disbanded. All, or most, of the automatic weather stations now stream data from the electronic probes directly to the Bureau’s own software. This could be an acceptable situation, except that theBureau no-longer averages the one-second readings over a one-minute period.

Indeed, it could be concluded that the current system is likely to generate new record hot days for the same weather, because of the increased sensitivity of the measuring equipment and the absence of any averaging/smoothing. To be clear, the highest one-second spot reading is now recorded as the maximum temperature for that day at the 563 automatic weather stations across Australia that are measuring surface air temperatures.

Just yesterday, the Bureau fed that “hottest ever” meme with a claim that analysis of data from about 700 weather stations across the country showed Wednesday was the hottest day recorded in Australia, with the nationally averaged maximum daytime temperature reaching 41.9C.

That was apparently a full degree higher than the previous record of 40.9C set on Tuesday, which itself broke the mark of 40.3C from January 2013.

But how exactly are the temperatures being measured, and which stations are being combined?

The Bureau has deleted the hottest day ever recorded with a mercury thermometer in a Stevenson screen, which was 51.6 degrees Celsius at Bourke in 1909.

Then there is the issue of the Bureau cooling the past. 


For example, it is a full 1.4 degrees cooler in Darwin on 1st January 1910 in the official ACORN-SAT version 2, temperature data base, relative to the actual temperature recorded back then in a Stevenson Screen with a mercury thermometer.

I have also documented how the Bureau put a limit on how cold a temperature can be recorded.

Not to mention closing stations in high altitude regions that may record colder temperatures. So the 700 weather stations used to calculate the hottest day on Wednesday may be skewered warmer since the closure of stations in the coldest places:

During June and July 2017, blizzard conditions were experienced across the Australian Alps, but we will never know how cold it actually got. Because a MSI1 card reader prevented the equipment – able to record down to minus 60 – from recording below minus 10 at Thredbo and probably also at many other locations.

It is also impossible to know how cold this last winter was relative to 1994 because the weather station at Charlotte Pass was closed in March 2015 – it is no longer in operation.

I’ve written to the National Audit Office about only some of these issues and that was some years ago now.

I could go on …

Filed Under: Information Tagged With: temperates

Exquisite

December 8, 2019 By jennifer

Exquisite: that is my word for an important book published this year, entitled ‘A Stray Liana’.

It is replete with the most beautiful photographs all by Neil Hewett, and all taken amongst the Daintree Rainforest where he has lived for perhaps two decades now.

Before that Neil lived for seven years within a remote Northern Territory Indigenous homeland.

The book is not just exquisite photographs, but Neil’s story about reconnecting with nature: how we are a part of nature with an obligation to manage our landscapes wisely.

Neil has long argued that it is only through the sustainable harvest of our natural wealth that wild places and wild creatures can truly flourish.

‘A Stray Liana’ is a large and heavy book replete with wildlife and also wise words.

On pages 248 and 249 there is a Chameleon Checko (Carphodactylus laevis) drinking from a leaf. The image fills the entire two pages and yet we only get to see the eyes and snout of the creature! This is enough to discern a personality.

Another favourite for me is the Northern Barred Frog (Mixophyes schevilli) sitting so quietly in that stream. Then there is the bright yellow moth caterpillar (Dysphania numana) like something from outer space daring a bird to not eat it.

If you are looking for the ultimate Christmas present, this book is it:

https://www.astrayliana.com.au/product/a-stray-liana-book/

Neil with his children some many years ago.

****
Neil shared the image of the lichen spider that features at the top of this blog post with me many years ago. I have a whole collection of them, different lichen spiders … from the Daintree, from Neil.

Filed Under: Information

Primary Sidebar

Recent Comments

  • Ian Thomson on Vax-ed as Sick as Unvax-ed, Amongst My Friends
  • Dave Ross on Vax-ed as Sick as Unvax-ed, Amongst My Friends
  • Dave Ross on Vax-ed as Sick as Unvax-ed, Amongst My Friends
  • Alex on Incarceration Nation: Frightened of Ivermectin, and Dihydrogen monoxide
  • Wilhelm Grimm III on Incarceration Nation: Frightened of Ivermectin, and Dihydrogen monoxide

Subscribe For News Updates

  • This field is for validation purposes and should be left unchanged.

December 2019
M T W T F S S
 1
2345678
9101112131415
16171819202122
23242526272829
3031  
« Nov   Jan »

Archives

Footer

About Me

Jennifer Marohasy Jennifer Marohasy BSc PhD has worked in industry and government. She is currently researching a novel technique for long-range weather forecasting funded by the B. Macfie Family Foundation. Read more

Subscribe For News Updates

Subscribe Me

Contact Me

To get in touch with Jennifer call 0418873222 or international call +61418873222.

Email: jennifermarohasy at gmail.com

Connect With Me

  • Facebook
  • LinkedIn
  • RSS
  • Twitter
  • YouTube

Copyright © 2014 - 2018 Jennifer Marohasy. All rights reserved. | Legal

Website by 46digital