• Skip to primary navigation
  • Skip to main content
  • Skip to primary sidebar
  • Skip to footer
Jennifer Marohasy

Jennifer Marohasy

a forum for the discussion of issues concerning the natural environment

  • Home
  • About
  • Publications
  • Speaker
  • Blog
  • Temperatures
  • Coral Reefs
  • Contact
  • Subscribe

Archives for August 2019

10 Days at the Magnificent Great Barrier Reef (Part 1, Whitsundays)

August 31, 2019 By jennifer

I’VE spent the last 10 days snorkelling, paddle boarding, and droning over the coral reefs of the northern and southern Whitsundays. I’ve been with a great crew including Clint Hempsall who has an underwater camera and he has taken so much footage … been filming underwater all of this time.

We started at Horseshoe bay that is right in Bowen township … in fact there is a coffee shop within perhaps 250 metres of the southern headland where there are a great diversity of colourful corals growing on the granite, and there is a lifeguard.

I was surprised to see such colourful, healthy corals straight-off the beach and so accessible from the mainland/a north Queensland town. A family can train/bus/drive to this local beach at Bowen and go snorkelling and find many of the corals found throughout the Great Barrier Reef. Indeed, the bays and headlands around Bowen offer an opportunity for anyone to see corals, without spending a lot of money.

Bramston Reef is also off-Bowen, just to the south from the end of Ocean View Drive. It is possible to park a car here and walk out across the mudflat that is teeming with life, then across the reef flat with Halimides and red starfish … then there is so much coral. This coral reef looks very different to Horseshoe Bay. The corals are mostly brown, but there are also pinks and greens and they are large and spread over perhaps 40 hectares, it would be great to map this area but much of it falls under a no-fly zone which is the approach to Bowen airport and so I haven’t been able to fly my drone there … but I have gone out over it on my paddle boat. That was so much fun.

I have also snorkelled over Butterfly reef on the Southern Whitsundays … a uniquely different reef with lots of very yellow soft corals. That day I also jumped-in at Luncheon reef and saw an old Porites (dead) now with a layer of a brilliant blue encrusting coral growing over it. And there were so many fish, and also seagulls. You look back to the islands and they are covered in Hoop pine. It is so pretty: above and below the water.

I didn’t see any coral bleaching, but there was some damage from crown-of-thorn at Luncheon reef.

Most of the last 10 days has been at Stone Island, which is just off Bowen and has so many unique and different reefs around it.

I know that at its narrowest it is 1.3 km between the mainland and Stone Island because I had originally intended to do all of this on my paddle board and was measuring distances … as it turned out my friend Rob McCulloch bought a boat down from Cairns for this part of our project.

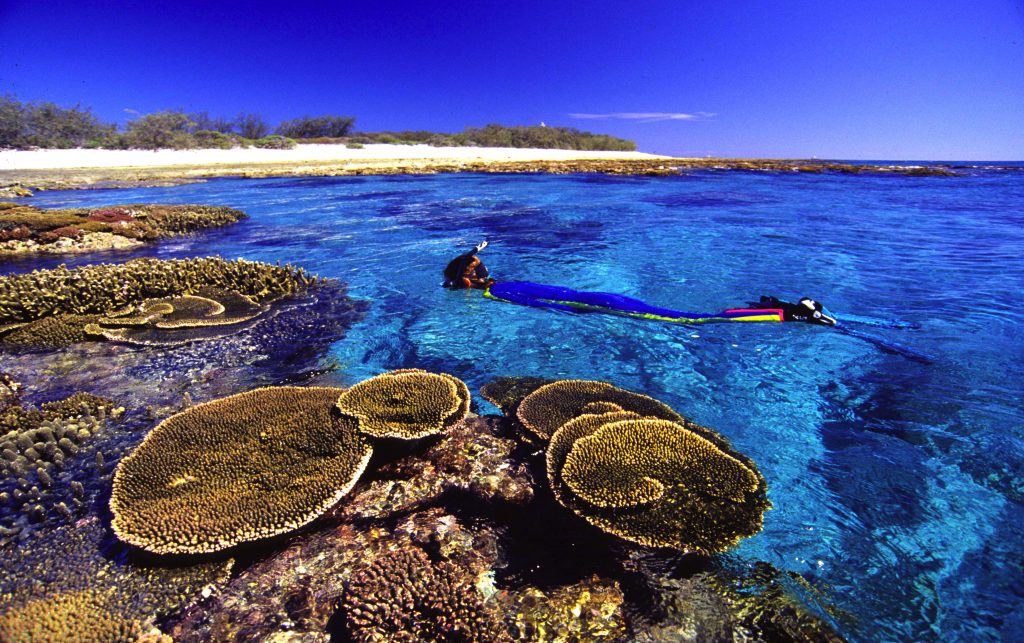
Attached is an aerial view from my drone (Skido) looking down on Clint Hempsall with his underwater camera and oxygen tank at what I’ve named Clint’s reef, off the south western edge of Stone Island. This reef has some beautiful pink plate corals, and a lot of stoney corals (what look like Porites). There are also various soft corals. On the mud flat we saw so many sea cucumbers, and there was a whale breaching off shore that day, not to mention all the green turtles (perhaps 8 along a stretch travelling/boating slowly for perhaps 10 minutes).

Just around the corner to the north east from Clint’s reef is the eastern facing bay at Stone Island. There are large bombies covered in different corals to the north, but my very favourite reef is in the south western corner of this bay … I’m calling it Beige Reef. There is nearly 100 percent coral cover over at least 20 hectares here … and so much foliose corals that are a delicate light beige colour with a white trim: image lettuce leaves in a hard limestone in these colours. Scattered amongst these corals are off-white Acropora (staghorn corals) with fluorescent purple tips and so many little Damsel fish, mostly black in colour. This coral garden is truly a sight to behold. Not particularly colourful, but rather subtle, beautiful, textured and with the light dappled through as I swam over.

At Beige reef there were also large Wrasse fish, and also Parrot fish and also Cheatadon (Butterfly fish).

So, I’ve had a wonderful 10 days so far … and I’m still to visit Middle Island today (Saturday) and Bait Reef on Sunday.

I will be in Mackay Monday night (2nd September) to give a talk about all of this at the Ocean International Resort, 1 Bridge Road, Illawong Beach, Mackay from 7pm.

Clint Hempsall will put together a few minutes of underwater footage with a focus on Beige reef … and this will also feature the the rest of the team on the boat and also some of us snorkelling and diving.

I hope to see you there!

****
The feature image shows Clint Hempsall filming underwater off the southern end of Stone Island (off Bowen) this year on my birthday, which was 26th August. I took the picture from my drone, called Skido.

I also have many minutes of aerial drone footage of this scene with the water washing against the edge of reef. I’m hoping the scene will make it into our film documenting the 2 weeks (in total) that we will have spent exploring the Whitsundays this August/September 2019.

This adventure has been funded by the B. Macfie Family Foundation through the Institute of Public Affairs.

Filed Under: Nature Photographs Tagged With: Great Barrier Reef

Heron Island Corals: Still Constrained by Sea Level Fall

August 20, 2019 By jennifer

MY mother lived and worked on Heron Island at the Great Barrier Reef in 1955. That was the same year the young Bob Endean established the University of Queensland Heron Island Research Station. He went on to become a famous marine biologist, and instrumental in the formation of the Great Barrier Reef Marine Park Authority (GBRMPA) in 1975.

There are photographs of my mother, then Joan Edith Pearce, standing knee deep surrounded by Porites coral micro atolls that are stunted and bleached. I showed one of these at my talk entitled ‘Climate Change Concern’ at the Maroochydore Surf Life Saving Club on 14th July. This has now been made into a YouTube:

The growth of corals back in 1955 at Heron Island was constrained by their inability to continue to grow-up, because sea levels were not rising. This continues to be the situation today — despite what you might to be told on the nightly news.

In fact, a peer-reviewed technical paper by L. Scopelitis et al. published in the journal ‘Coral Reef’ (2011) and rather curiously entitled ‘Coral colonisation of a shallow reef flat in response to rising sea level: quantification from 35 years of remote sensing data at Heron Island, Australia’ explains that the period 2002 to 2007 has been the most constrained for Heron Island corals since at least 1940. This is apparently because they have reached their vertical limit for growth, and there has been no sea level rise.

The single biggest threat to the Great Barrier Reef is sea level fall. Sea levels did fall some 30 centimetres during the recent super El Nino event of 2015/2016 as I explain in the YouTube presentation.

This is not a large amount considering that the tidal range at Heron Island on any one day can be anything from 1 to 3 metres.

But 30 centimetres is enough to result in bleaching of the top 30 centimetres of a coral that may be subject to sunshine on the exposed reef flat for perhaps an hour.

Heron Island is a coral cay that formed perhaps 6,000 years ago, perhaps following a violent storm when a large pile of coral rubble and broken shells was left above the high tide mark. It has grown since then.

The incident of bleaching due to low sea levels associated with El Nino events has been documented at other Great Barrier Reef islands back 3,000 years by Helen McGregor at Wollongong University.

I’m specifically thinking of her paper entitled ‘Coral micro atoll reconstructions of El Nino-Southern Oscillation: New windows on seasonal and inter annual processes’, which was published in the journal ‘Past Global Changes’ (volume 21) in 2013. By dissecting micro-atolls — the type shown in the picture of my mother at Heron Island back in 1955 — it is possible to understand that sea level has been a constraint to coral growth at the Great Barrier reef for at least this long: at least 3,000 years.

The distinctive micro-atoll form is a result of continual exposure to heat and sunlight at extremely low tides, which result, of course, in low sea levels.

****

I’m leaving Noosa tomorrow for the Great Barrier Reef. If you would like to be updated on my work there — with a drone pilot and underwater photographer — considering subscribing for my irregular email updates:https://jennifermarohasy.com.dev.internet-thinking.com.au/subscribe/

Filed Under: Information, News Tagged With: Great Barrier Reef, sea level change

Lady Elliot, Temperature Trends

August 3, 2019 By jennifer

THERE is concern that if global warming exceeds 2°C per 100 years, there will be catastrophe. There are various ways of anticipating this… I tend to favour the empirical. Indeed, running a ruler over a temperature series can be useful, if we want perspective.

Considering the maximum temperature record available for Lady Elliot Island — an isolated coral cay off the Australian east coast — and after running a trend line through the numbers, we find that we are almost at this tipping point of 2°C, as shown in Figure 1.

Figure 1. Maximum annual mean temperatures as measured at Lady Elliot Island charted for the period 1940 to 2018.

There has been a consistent annual temperature rise of 0.0195°C since 1940, which would translate into a rise 1.95°C per hundred years.

The situation appears even worse if we just consider temperatures from 1960. Then the temperature trend for Lady Elliot is more than 2°C per hundred years, as shown in Figure 2.

The mean annual maximum temperature series from the nearby Sandy Cape lighthouse has a very similar pattern for this period from 1960. There is more inter-annual variation in the temperature series from nearby Gayndah, which is typical of land series that will be more affected by droughts and floods.

Figure 2. Temperature change as measured by the annual mean maximum since 1960 at Lady Elliot and also nearby Gayndah and Sandy Cape Lighthouse

I’ve spent many years poring over temperature data from a diversity of locations across Australia, and what I’ve found is that when such records are extended back in time — even just a few decades — the overall temperature trend is quite different and ‘the catastrophe’ disappears.

The record for Lady Elliot Island only starts on 1 July 1939. To understand what temperatures were like in this region before then, we need to consider temperature measurements from neighbouring stations that begin in the late 1800s.

There are several weather stations within a 300 km radius of Lady Elliot Island that have long temperature records.

Locations within a 300 km radius of Lady Elliot with long and continuous series. Drawn by Jaco Vlok.

The temperature record as measured at the Gayndah Post Office (number 39039) actually begins in June 1893, and the record for Bundaberg (number 39015) in 1892, as shown in Figure 3. There is a single breakpoint in the early record for each of these two locations, marked by a circle when a Stevenson screen was installed.

Figure 3. Annual mean maximum temperatures for the 14 stations with long and continuous records within a 300 km radius of Lady Elliot. Drawn by Jaco Vlok.

Considering the longer records within the 300 km radius, maximum temperatures have sometimes fluctuated by more than 2°C within a few years. This is evident from the detail in the individual series in Figure 3. The more than 2°C variation in temperatures as measured at Gayndah between 1900 and 1904, for example, is more than the overall warming trend at Lady Elliot of 1.95°C per hundred years since 1940.

Maximum temperatures for Gayndah and Bundaberg spiked in 1915, as they did for all the other stations recording within a 300 km radius of Lady Elliot Island at that time.

So, we can perhaps assume it was also a relatively hot year at Lady Elliot Island … back in 1915. Perhaps it was as hot back then as it is now, which is quite hot considering the longer records. Then again the spike may have been a consequence of the land drought, and places like Sandy Cape Lighthouse and Lady Elliott less affected. There is no mean annual maximum value for Sandy Cape Light House (number 39085) for 1915 because of missing values … but these could be infilled (using regression and/or an artificial neural network), to better estimate the likely temperature history for this region over land and also sea.

It can be difficult separating out the individual series in Figure 3. The squiggly lines are a representation of individual annual mean maximum temperatures. In Figure 4, I plot these individual values for just the Gayndah Post Office (number 39039) from 1900 (after the breakpoint, only after the Stevenson screen was installed) and for Lady Elliot (number 39059) from the beginning. Both series are plotted with trend lines.

The overall temperature trend for Gayndah Post Office, considering this longer record, is just 0.38°C per hundred years, as shown in Figure 4. This contrasts significantly with the value of 2.58°C per hundred years when we plot the same values for Gayndah but only for the interval from 1960 to 2009, as shown in Figure 2.

Figure 4. Annual mean maximum temperatures as recorded at Gayndah (after installation of Stevenson Screen) and the entire record at Lady Elliot

Whenever I take the time to run a ruler over temperature series for any particular region and considering a long enough time period not artificially warmed by a combination of Urban Heat Islands (UHI) and homogenisation, I have trouble finding catastrophe. Rather I’m inspired by the extent of the available data and the degree of synchrony between the series that tend, if anything, to be simply moving sideways.

Lady Elliot Island. Photo credit Clint Hempsall.

____

This is the third post in my ‘GAT in the Hat’ series, which began when Huck suggesting we get on and develop a simple temperature index based on a good sample of well-sited stations. Jaco Vlok and I are working our way around Australia with such an index in mind … we are working anti-clockwise from Brisbane.

Thanks to the Australian Bureau of Meteorology for making all this data available at http://www.bom.gov.au/climate/data/

The feature image (very top of this blog post) is a plot of all the available maximum temperature data (from 59 weather stations) within a 300 km radius of Lady Elliot as 12-month moving averages, with the data compiled and plotted by Jaco Vlok.

This post was updated at midnight on 3rd August, with figures added, the picture changed, and the title modified …

Filed Under: Information Tagged With: temperates

Primary Sidebar

Recent Comments

  • Ian Thomson on Vax-ed as Sick as Unvax-ed, Amongst My Friends
  • Dave Ross on Vax-ed as Sick as Unvax-ed, Amongst My Friends
  • Dave Ross on Vax-ed as Sick as Unvax-ed, Amongst My Friends
  • Alex on Incarceration Nation: Frightened of Ivermectin, and Dihydrogen monoxide
  • Wilhelm Grimm III on Incarceration Nation: Frightened of Ivermectin, and Dihydrogen monoxide

Subscribe For News Updates

  • This field is for validation purposes and should be left unchanged.

August 2019
M T W T F S S
 1234
567891011
12131415161718
19202122232425
262728293031  
« Jul   Sep »

Archives

Footer

About Me

Jennifer Marohasy Jennifer Marohasy BSc PhD has worked in industry and government. She is currently researching a novel technique for long-range weather forecasting funded by the B. Macfie Family Foundation. Read more

Subscribe For News Updates

Subscribe Me

Contact Me

To get in touch with Jennifer call 0418873222 or international call +61418873222.

Email: jennifermarohasy at gmail.com

Connect With Me

  • Facebook
  • LinkedIn
  • RSS
  • Twitter
  • YouTube

Copyright © 2014 - 2018 Jennifer Marohasy. All rights reserved. | Legal

Website by 46digital