DECONSTRUCTION can be affirmation rather than questioning. Jaco Vlok and I have been deconstructing various temperature series from the Brisbane region with a view to developing an index that is an accurate, and affirming, representation of Brisbane’s temperature history.
To progress this work, we are making the following two recommendations, that concern the Australian National Archive:
RECOMMENDATIONS
1. The Australian National Archive needs to digitise the long temperature series from the mercury thermometer that was recording temperatures at the Brisbane airport (station number 40842) from 9 June 2004 until 3 September 2014, as shown in the Gantt chart. Only when this data is available will it be possible to begin to know if measurements from electronic probes now recording official temperatures, have any equivalence with temperature measurements from 100 years ago.
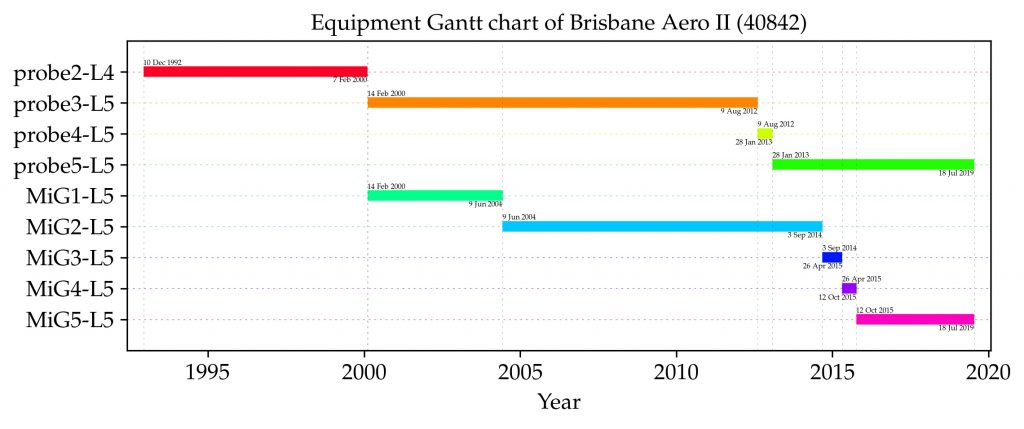
2. The first government weather station at Brisbane (station number 40214) opened in 1840, which is 179 years ago. The daily recordings from this mercury thermometer should be There may be daily temperature readings and they may be archived in the Australian National Archive. This needs to be confirmed, and the daily maximum values digitised to enable the current record for Brisbane to be extended back in time.
For the period from 1840 to 1896 the mercury thermometer was housed in a Glaisher stand rather than a Stevenson screen.* It is unknown how the thermometers where housed before the installation of the Stevenson screen in 1896.
There will potentially need to be an adjustment when joining the series. Adjustments are currently made by the Australian Bureau of Meteorology to all the Brisbane series for the period from 1950, through the process of homogenisation.
BACKGROUND
There is intense interest in climate change as a cause, but perhaps not enough interest in the quality of the data underpinning all the rhetoric. If we really care about this issue of global warming then we will want to know exactly how much temperatures have really warmed over recent decades. So, we will need to know the equivalence of temperatures now measured using electronic probes with temperatures previously measured using mercury thermometers.
The Australian Bureau of Meteorology measures temperatures from electronic probes that have not been calibrated relative to the mercury thermometers that were once used. Further, the Bureau makes adjustments to temperatures after they have been measured, recorded and archived in the creation of the new official temperature series, known as ACORN-SAT. These homogenised series are then used to calculate national and global averages.
Mark Huxley Akin (Huck) has suggested that we just get on and start constructing regional climate indices based on real and unadjusted/unhomogenised temperature series.
Specifically, he has suggested we use “a good sample of well-sited stations with long histories”, using the analogy of the Dow Jones Average. He writes:
No one ever tries to establish an impossible-to-define ‘average stock price’— including many stocks of doubtful provenance — and nobody cares. These pre-selected indexes of certain representative stocks, that are then followed over a long time-span, tell investors what they really want to know: how the market moves over time, relative to itself.
It is the case that for some Australian locations there are long consistent records through much of the twentieth century. For example, temperature data recorded at Brisbane (station number 40214) are currently publicly available from January 1887 to March 1986. This is one of the longest continuous high quality temperature records for anywhere in the Southern Hemisphere with measurements taken using the same mercury thermometer at the same place every day (although the Glaisher stand was replaced with a Stevenson screen in 1896).
Problems begin, however, around the late 1980s, when there are site moves and equipment changes. In the case of Brisbane, in order to continue any index beyond 1986, it is going to be necessary to join different temperature series and yet there is no data to quantify the equivalence of the measurements from electronic probes, mercury thermometers and also thermohygrographs — that were also used at Brisbane.
The first ever detailed list of the equipment used to measure temperatures at Brisbane has just been compiled by Jaco Vlok, as shown in master_table4 which is a work-in-progress.
BRISBANE MAXIMA IN THE RAW
According to the available metadata, maximum temperatures were measured at Brisbane (40214) from January 1840 until July 1994. There is only data available online, however, to construct an annual mean series from 1887 to 1985, as shown in Figure 1. For most of this record, from 1896, temperatures were recorded using the same mercury thermometer in a Stevenson screen. This very long continuous record does NOT show a pattern of warming consistent with human-caused global warming theory, Figure 1.
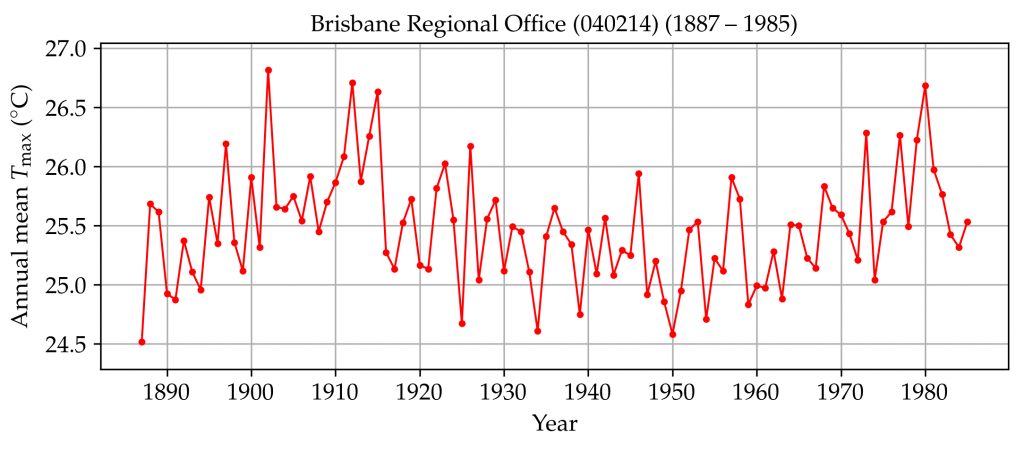
Consistent with many other such high-quality and long continuous records from Australia, this maximum temperature series shows cooling to about 1960 and then warming.
THE OFFICIAL BRISBANE RECORD
The official temperature record for Brisbane is from a combination of two official Bureau series both recorded at the airport (Series 40223 and 40842), and subsequently homogenised. The homogenisation method is outlined in general terms in a peer-reviewed article by Blair Trewin published in 2013.
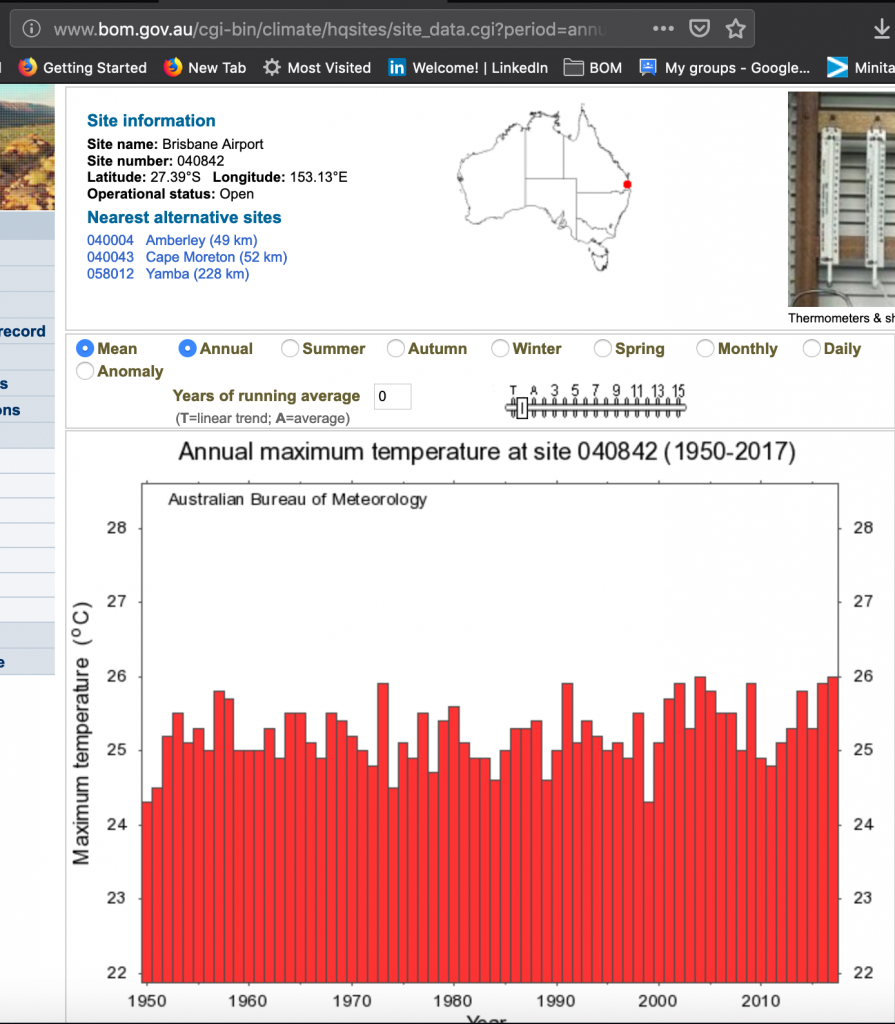
In the case of Brisbane, Blair Trewin has decided to begin the official record in 1950, which is presented as a bar chart at the Bureau of Meteorology website, as shown in Figure 2.
The temperature series used to construct this bar chart are shown in Figure 3, as well as the resulting ACORN-SAT versions 1 and 2.
ACORN-SAT version 2, as shown in Figure 3, represents the official record for Brisbane and data from this series is incorporated into international datasets.
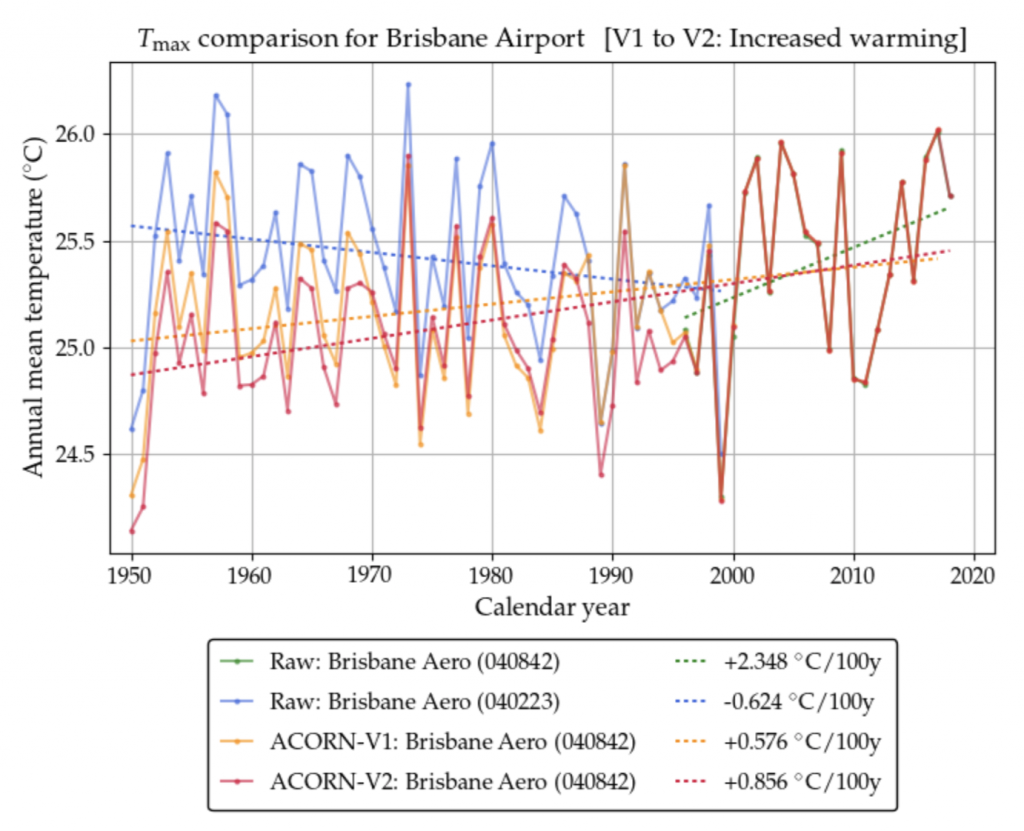
The latest official ACORN-SAT maximum temperature series for Brisbane (version 2 in Figure 3) suggests warming of 0.9 degrees Celsius per century.
To be clear, this temperature series does not show the early measurements for Brisbane, so it does not show how hot temperatures were in 1902 and then again in 1912 and 1915. The official record also does not show the period of overall cooling, to about 1960.
CHANGING SITES AND CHANGING EQUIPMENT
It is a fact that understanding the true temperature history of a place can be difficult because of: site moves, changes in equipment, changes in the method of recording for the same equipment, and homogenisation of the raw data.
A true representation of temperatures over the last 100 years for Brisbane would not ignore the long series beginning in 1840. Nor would a true representation gloss over the many equipment changes particularly since 1995, as shown in the first Gantt chart, and that Jaco Vlok has began to document in Table 1.
Since 1996 the Australian Bureau of Meteorology has been transitioning away from the use of traditional mercury thermometers to electronic probes in automatic weather stations for the measurement of maximum temperatures. This is a major change in equipment — a major change in how temperatures are measured — yet when this change occurs the Bureau keeps the same station number and just continues to add to the previous record.
This is in contravention of its own policies that clearly state that a new station number should be assigned, and that there should be at least three years (preferably five) of overlapping/parallel temperature recordings at the same location.
This parallel data exists for a limited number of stations, but the Bureau has so far not made the data accessible. Much of it is currently held by the Australian National Archive as manual recordings into observation books. The numbers need to be digitised so that we can see whether or not the measurements from the electronic probes are comparable to the measurements from the mercury thermometers.
After much effort, I obtained parallel data for Mildura – as thousands of photographed records. Manual transcribing of some of the data has established that the current electronic probe at Mildura often records 0.4 degrees Celsius hotter — for the same weather. The first electronic probe at Mildura actually recorded cooler. So, the custom-built probes installed sequentially at Mildura have different time constants. It was only possible to establish this after the parallel data was provided to me, and I began an analysis of some of the manually transcribed data.
We know that since 1996 the temperature record for the Brisbane airport (station number 040842) actually represents measurements from an electronic probe, not a mercury thermometer. We don’t know what the time constant is for this probe. We do know that there is parallel data available from 14 February 2000; that is temperature measurements taken from a mercury thermometer in the same shelter (Stevenson screen).
We know that there have been four different probes used at the Brisbane airport site, as shown in Table 1.
The Bureau has not published the time constants for these probes. Depending on the time-constant, a probe may be much more sensitive to temperature change than a mercury thermometer and thus record warmer temperatures for the same weather.
APPROPRIATE QUALITY ASSURANCE
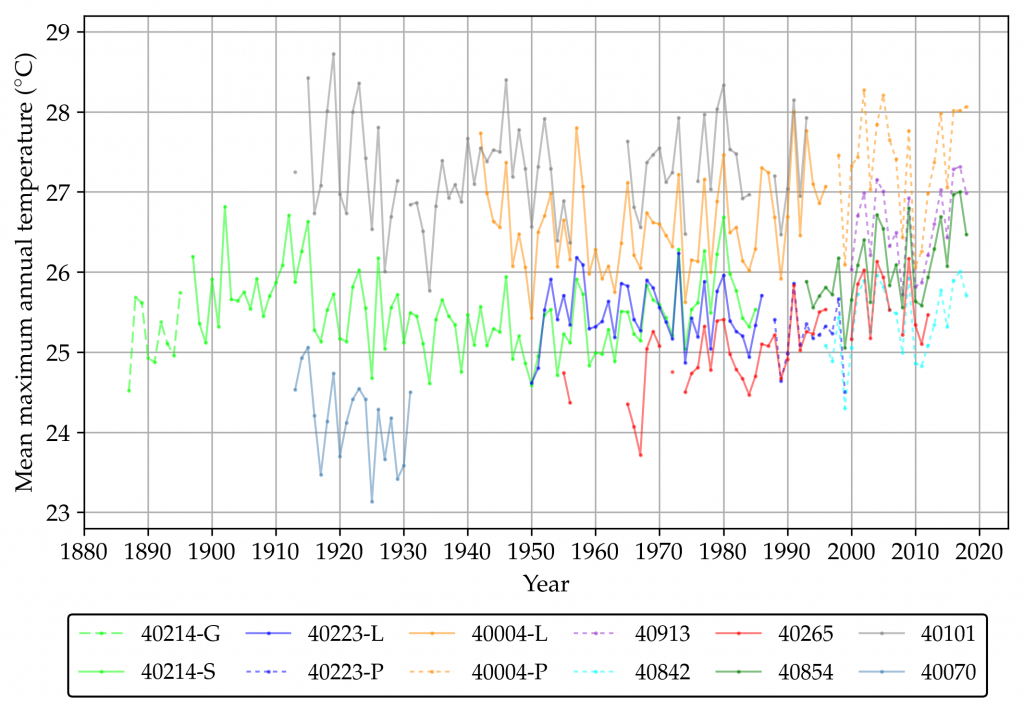
Breaking down the Bureau’s series into their component parts and then plotting the available data on one chart, can give an indication of temperature change since 1897.
The extent to which the many different Brisbane series move in synchrony suggests they are an accurate representation of climate variability and change for this region, as shown in Figure 4. Consider, for example, the first three records in the table for the period from 1950 to 1986; including the Brisbane Regional Office (40214), Brisbane airport (40223) and Amberley (40004) series: they generally move in unison but do not show a consistent warming trend.
At the moment this is all a work in progress, with the labels for the series charted in Figure 4 not yet corresponding to the new codes/numbers in Table 1.
MOVING FORWARD
Brisbane’s temperature record could form the basis of a new index of temperature change. The construction of such an index would be aided by the provision of parallel data, that is data from both a mercury thermometer and electronic probe recorded at the same time and place.
Specifically, the most useful data right now would be the mercury thermometer recordings from the Brisbane airport (station number 40842) from 9 June 2004 until 3 September 2014, as shown in the Gantt chart. This information is held by the Australian National Archive and needs to be made publicly available, and digitised.
*****
The image featured at the top of this blog post is from https://www.slq.qld.gov.au/blogs/jol/inclement-wragge-pioneer-weather-forecaster. It shows Clement Wragge, Government Meteorologist for Queensland, with temperature recording equipment, and the Brisbane Tabernacle Baptist Church in the background.
I would like to acknowledge all the advice from Lance Pidgeon regarding ‘Brisbane’ over the years. He will also be acknowleged in the more detailed report that Jaco and I are working-up.
Also, the final recommendations in this report, and the nature of our index may be informed/improved by your comments (and Lance’s comments/input) in the following thread.

 Jennifer Marohasy BSc PhD has worked in industry and government. She is currently researching a novel technique for long-range weather forecasting funded by the B. Macfie Family Foundation.