• Skip to primary navigation
  • Skip to main content
  • Skip to primary sidebar
  • Skip to footer
Jennifer Marohasy

Jennifer Marohasy

a forum for the discussion of issues concerning the natural environment

  • Home
  • About
  • Publications
  • Speaker
  • Blog
  • Temperatures
  • Coral Reefs
  • Contact
  • Subscribe

Archives for July 2019

Understanding Brisbane’s Temperature History (Part 1)

July 19, 2019 By jennifer

DECONSTRUCTION can be affirmation rather than questioning. Jaco Vlok and I have been deconstructing various temperature series from the Brisbane region with a view to developing an index that is an accurate, and affirming, representation of Brisbane’s temperature history.

To progress this work, we are making the following two recommendations, that concern the Australian National Archive:

RECOMMENDATIONS

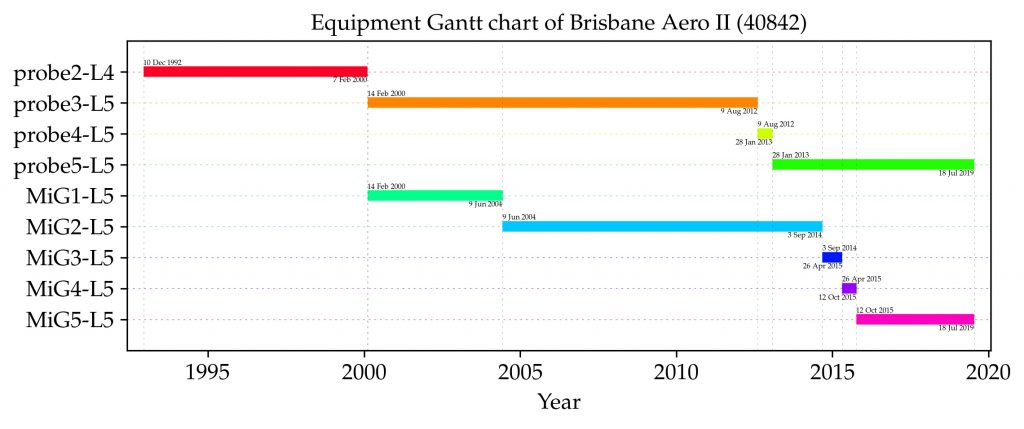
1. The Australian National Archive needs to digitise the long temperature series from the mercury thermometer that was recording temperatures at the Brisbane airport (station number 40842) from 9 June 2004 until 3 September 2014, as shown in the Gantt chart. Only when this data is available will it be possible to begin to know if measurements from electronic probes now recording official temperatures, have any equivalence with temperature measurements from 100 years ago.

When there is an equipment change, there should be some overlapping data to enable comparisons … and also a new number. In contravention of its own policies the Bureau has made major equipment changes and yet kept the same station number.

2. The first government weather station at Brisbane (station number 40214) opened in 1840, which is 179 years ago. The daily recordings from this mercury thermometer should be There may be daily temperature readings and they may be archived in the Australian National Archive. This needs to be confirmed, and the daily maximum values digitised to enable the current record for Brisbane to be extended back in time.

For the period from 1840 to 1896 the mercury thermometer was housed in a Glaisher stand rather than a Stevenson screen.* It is unknown how the thermometers where housed before the installation of the Stevenson screen in 1896.

There will potentially need to be an adjustment when joining the series. Adjustments are currently made by the Australian Bureau of Meteorology to all the Brisbane series for the period from 1950, through the process of homogenisation.

BACKGROUND

There is intense interest in climate change as a cause, but perhaps not enough interest in the quality of the data underpinning all the rhetoric. If we really care about this issue of global warming then we will want to know exactly how much temperatures have really warmed over recent decades. So, we will need to know the equivalence of temperatures now measured using electronic probes with temperatures previously measured using mercury thermometers.

The Australian Bureau of Meteorology measures temperatures from electronic probes that have not been calibrated relative to the mercury thermometers that were once used. Further, the Bureau makes adjustments to temperatures after they have been measured, recorded and archived in the creation of the new official temperature series, known as ACORN-SAT. These homogenised series are then used to calculate national and global averages.

Mark Huxley Akin (Huck) has suggested that we just get on and start constructing regional climate indices based on real and unadjusted/unhomogenised temperature series.

Specifically, he has suggested we use “a good sample of well-sited stations with long histories”, using the analogy of the Dow Jones Average. He writes:

No one ever tries to establish an impossible-to-define ‘average stock price’— including many stocks of doubtful provenance — and nobody cares. These pre-selected indexes of certain representative stocks, that are then followed over a long time-span, tell investors what they really want to know: how the market moves over time, relative to itself.

It is the case that for some Australian locations there are long consistent records through much of the twentieth century. For example, temperature data recorded at Brisbane (station number 40214) are currently publicly available from January 1887 to March 1986. This is one of the longest continuous high quality temperature records for anywhere in the Southern Hemisphere with measurements taken using the same mercury thermometer at the same place every day (although the Glaisher stand was replaced with a Stevenson screen in 1896).

Problems begin, however, around the late 1980s, when there are site moves and equipment changes. In the case of Brisbane, in order to continue any index beyond 1986, it is going to be necessary to join different temperature series and yet there is no data to quantify the equivalence of the measurements from electronic probes, mercury thermometers and also thermohygrographs — that were also used at Brisbane.

The first ever detailed list of the equipment used to measure temperatures at Brisbane has just been compiled by Jaco Vlok, as shown in master_table4 which is a work-in-progress.

BRISBANE MAXIMA IN THE RAW

According to the available metadata, maximum temperatures were measured at Brisbane (40214) from January 1840 until July 1994. There is only data available online, however, to construct an annual mean series from 1887 to 1985, as shown in Figure 1. For most of this record, from 1896, temperatures were recorded using the same mercury thermometer in a Stevenson screen. This very long continuous record does NOT show a pattern of warming consistent with human-caused global warming theory, Figure 1.

Figure 1.Maximum temperatures recorded at station number 040214, in a Stevenson screen with a mercury thermometer as downloaded from the Bureau’s ADAM database.

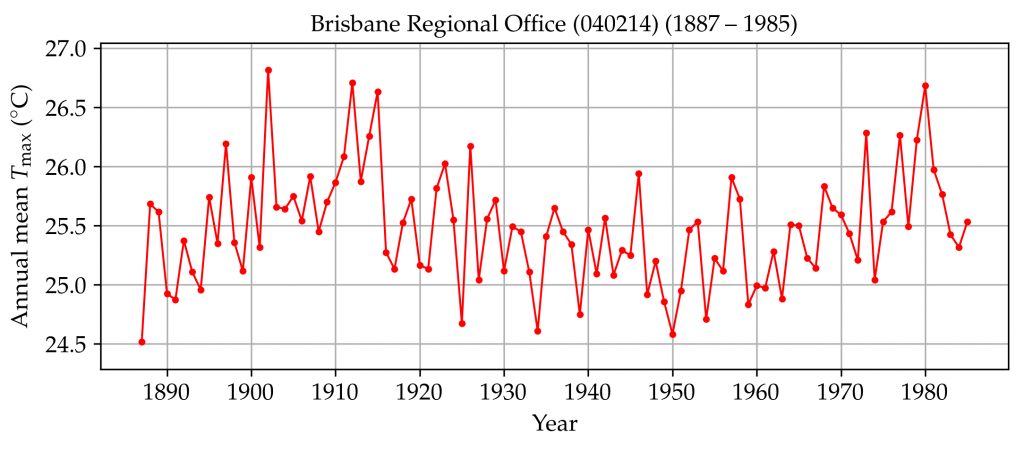
Consistent with many other such high-quality and long continuous records from Australia, this maximum temperature series shows cooling to about 1960 and then warming.

THE OFFICIAL BRISBANE RECORD

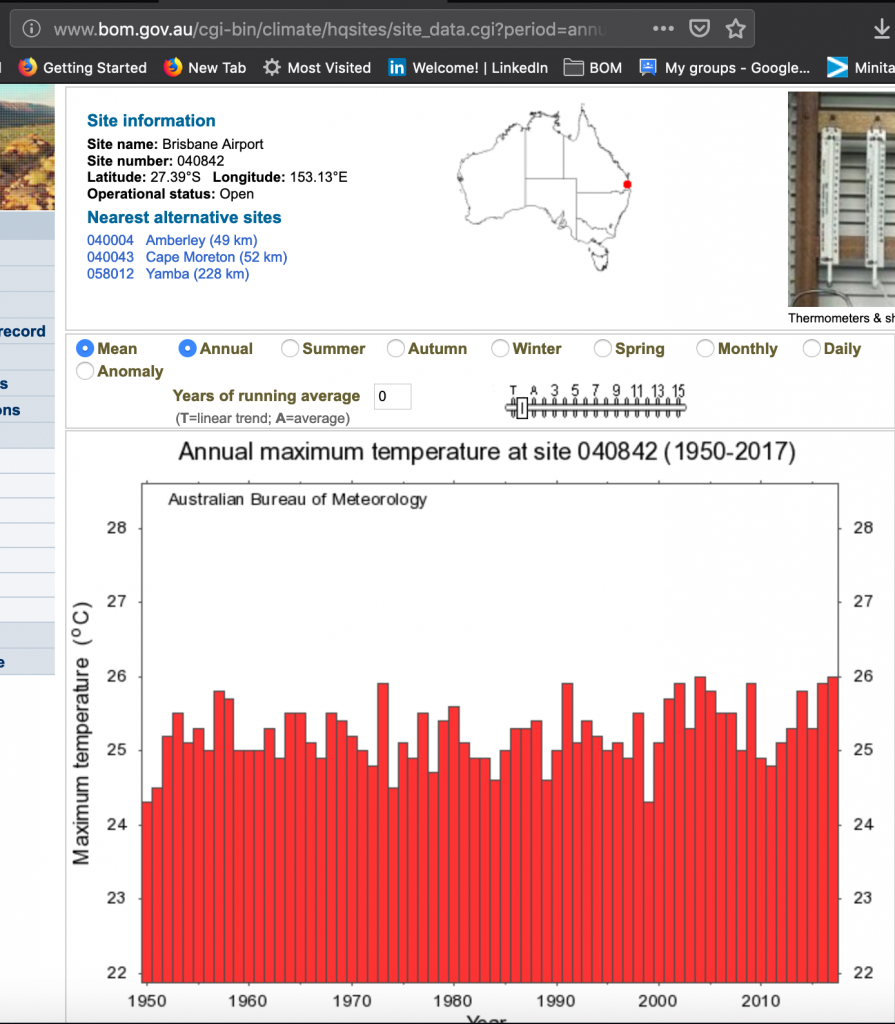
The official temperature record for Brisbane is from a combination of two official Bureau series both recorded at the airport (Series 40223 and 40842), and subsequently homogenised. The homogenisation method is outlined in general terms in a peer-reviewed article by Blair Trewin published in 2013.

In the case of Brisbane, Blair Trewin has decided to begin the official record in 1950, which is presented as a bar chart at the Bureau of Meteorology website, as shown in Figure 2.

Figure 2. The official annual mean maximum temperature record for Brisbane, as displayed at the Bureau of Meteorology website.

The temperature series used to construct this bar chart are shown in Figure 3, as well as the resulting ACORN-SAT versions 1 and 2.

ACORN-SAT version 2, as shown in Figure 3, represents the official record for Brisbane and data from this series is incorporated into international datasets.

Figure 3. The temperature series that are homogenised by Blair Trewin and then used to create the ACORN-SAT series, also shown.

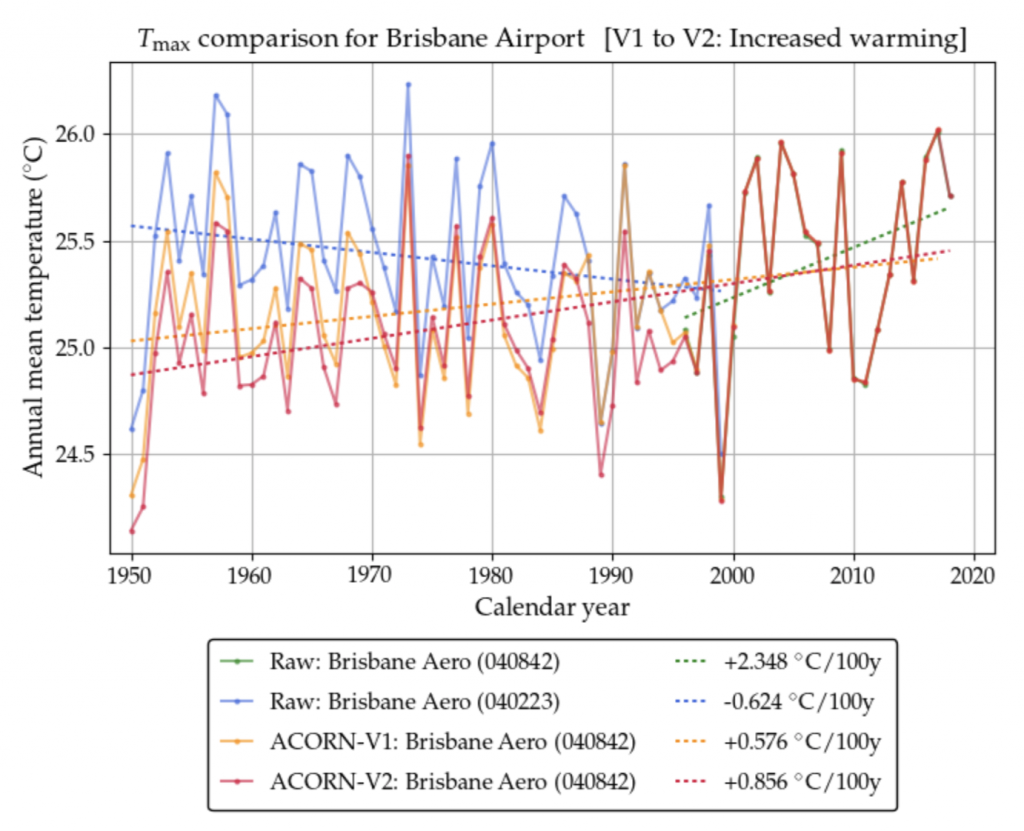
The latest official ACORN-SAT maximum temperature series for Brisbane (version 2 in Figure 3) suggests warming of 0.9 degrees Celsius per century.

To be clear, this temperature series does not show the early measurements for Brisbane, so it does not show how hot temperatures were in 1902 and then again in 1912 and 1915. The official record also does not show the period of overall cooling, to about 1960.

CHANGING SITES AND CHANGING EQUIPMENT

It is a fact that understanding the true temperature history of a place can be difficult because of: site moves, changes in equipment, changes in the method of recording for the same equipment, and homogenisation of the raw data.
A true representation of temperatures over the last 100 years for Brisbane would not ignore the long series beginning in 1840. Nor would a true representation gloss over the many equipment changes particularly since 1995, as shown in the first Gantt chart, and that Jaco Vlok has began to document in Table 1.

Since 1996 the Australian Bureau of Meteorology has been transitioning away from the use of traditional mercury thermometers to electronic probes in automatic weather stations for the measurement of maximum temperatures. This is a major change in equipment — a major change in how temperatures are measured — yet when this change occurs the Bureau keeps the same station number and just continues to add to the previous record.

This is in contravention of its own policies that clearly state that a new station number should be assigned, and that there should be at least three years (preferably five) of overlapping/parallel temperature recordings at the same location.

This parallel data exists for a limited number of stations, but the Bureau has so far not made the data accessible. Much of it is currently held by the Australian National Archive as manual recordings into observation books. The numbers need to be digitised so that we can see whether or not the measurements from the electronic probes are comparable to the measurements from the mercury thermometers.

After much effort, I obtained parallel data for Mildura – as thousands of photographed records. Manual transcribing of some of the data has established that the current electronic probe at Mildura often records 0.4 degrees Celsius hotter — for the same weather. The first electronic probe at Mildura actually recorded cooler. So, the custom-built probes installed sequentially at Mildura have different time constants. It was only possible to establish this after the parallel data was provided to me, and I began an analysis of some of the manually transcribed data.

We know that since 1996 the temperature record for the Brisbane airport (station number 040842) actually represents measurements from an electronic probe, not a mercury thermometer. We don’t know what the time constant is for this probe. We do know that there is parallel data available from 14 February 2000; that is temperature measurements taken from a mercury thermometer in the same shelter (Stevenson screen).

We know that there have been four different probes used at the Brisbane airport site, as shown in Table 1.
The Bureau has not published the time constants for these probes. Depending on the time-constant, a probe may be much more sensitive to temperature change than a mercury thermometer and thus record warmer temperatures for the same weather.

APPROPRIATE QUALITY ASSURANCE

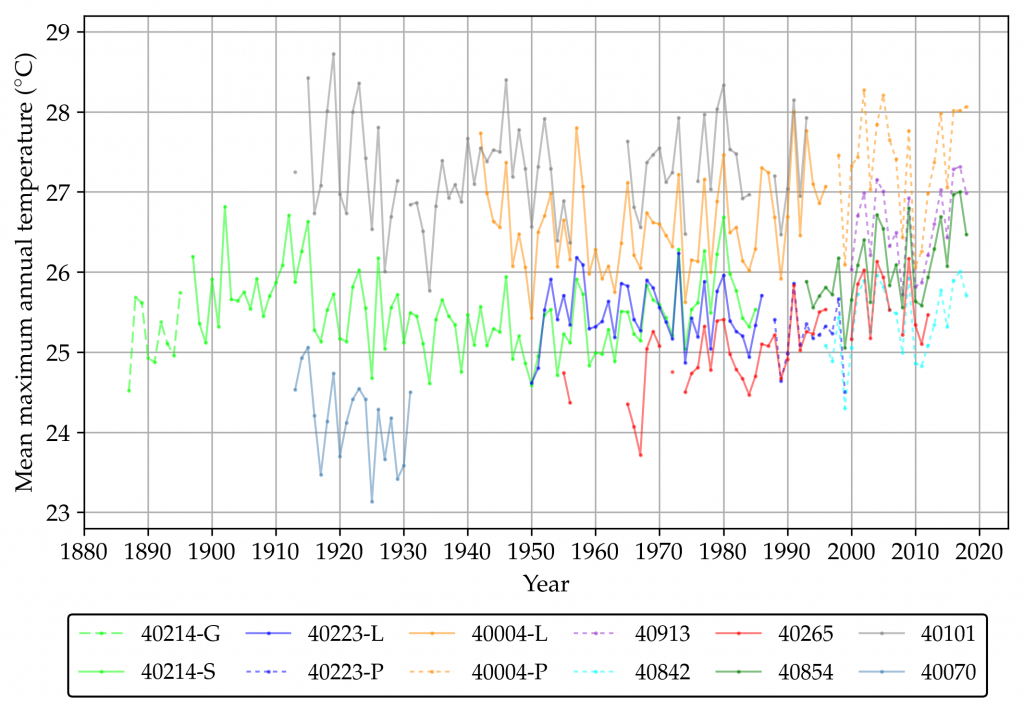
Breaking down the Bureau’s series into their component parts and then plotting the available data on one chart, can give an indication of temperature change since 1897.

The extent to which the many different Brisbane series move in synchrony suggests they are an accurate representation of climate variability and change for this region, as shown in Figure 4. Consider, for example, the first three records in the table for the period from 1950 to 1986; including the Brisbane Regional Office (40214), Brisbane airport (40223) and Amberley (40004) series: they generally move in unison but do not show a consistent warming trend.

At the moment this is all a work in progress, with the labels for the series charted in Figure 4 not yet corresponding to the new codes/numbers in Table 1.

Figure 4. The longest continuous temperature series from the Brisbane regions, segmented by equipment and also when there was a site move.

MOVING FORWARD

Brisbane’s temperature record could form the basis of a new index of temperature change. The construction of such an index would be aided by the provision of parallel data, that is data from both a mercury thermometer and electronic probe recorded at the same time and place.

Specifically, the most useful data right now would be the mercury thermometer recordings from the Brisbane airport (station number 40842) from 9 June 2004 until 3 September 2014, as shown in the Gantt chart. This information is held by the Australian National Archive and needs to be made publicly available, and digitised.

*****
The image featured at the top of this blog post is from https://www.slq.qld.gov.au/blogs/jol/inclement-wragge-pioneer-weather-forecaster. It shows Clement Wragge, Government Meteorologist for Queensland, with temperature recording equipment, and the Brisbane Tabernacle Baptist Church in the background.

I would like to acknowledge all the advice from Lance Pidgeon regarding ‘Brisbane’ over the years. He will also be acknowleged in the more detailed report that Jaco and I are working-up.

Also, the final recommendations in this report, and the nature of our index may be informed/improved by your comments (and Lance’s comments/input) in the following thread.

Filed Under: Information Tagged With: temperates

More Government Regulation Won’t Save the Great Barrier Reef from Scientists — or Politicians. Oink.

July 16, 2019 By jennifer

THE idea that the Great Barrier Reef is in need of saving from catastrophe is popular, especially among academics and politicians. In 2003, I published an article in the IPA Review entitled ‘Deceit in the Name of Conservation’ concerning the then Queensland Premier and Chief Scientist. In an earlier article entitled ‘WWF says Jump, Governments ask How High’ I explained the extent to which there was collusion within members of a Reef Protection Taskforce, that including activists and the CSIRO, to the extent that they felt a need to invent evidence of damage to the reef — least none existed.

Former Prime Minister Malcolm Turnbull approved a $443 million grant to the tiny Great Barrier Reef Foundation. That grant includes an allowance of up to $86 million for ‘administration’.

Those with a belief in the general competence of government and academics might assume that there are some big questions reef scientists have prioritized and are in the process of answering through their reef research. But. It is perhaps more a case of individual researchers confirming the end is nigh in accordance with the consensus, while denying Nemo, his corals and the crystal-clear blue waters that is the reality at 319 percent of this deep nature … that is for those who still put their heads under the water without drowning from a ladder while entangled in a fishing net.

The Queensland Liberal National Party (LNP) passed a resolution at its conference on the weekend to establish an ‘Office of Science Quality Assurance’ to check the science that is being used for policy decisions — with the push for the creation of this office coming from those now very concerned about yet more regulation that could mean the end of the sugar industry as a proposed solution to saving the reef from ruin.

The conference was attended by many politicians, and they all spend much more time on Twitter than ever visiting the Great Barrier Reef.

In bureaucratic speak such an ‘office’ could mean almost anything, but usually an ‘office’ is just a branch of a government department. Somewhat like a polp within a corallite that is anchored to the colony for better or worst as sea levels fall.

Here is my mother, then Joan Edith Pearce, standing knee deep at the Great Barrier Reef in 1955 before coral bleaching was an issue … this now almost 90 year old great grandmother was photographed in front of a bleached micro atoll almost certainly a colony of Porites cylindrica that could be described as already dead on top from exposure to falling sea levels back in the mid-twentieth century with the top of the Porites colony perhaps regularly pruned by heat, cold and rain.

This ‘Office of Science Quality Assurance’ may pride itself on its independent advice.  For example, Finance and Treasury sometimes give independent advice which may conflict with what the Cabinet and the Government wants to do.  Such advice is usually ignored.  This is the reason there are Cabinet-in-Confidence laws: to prevent publication of such internal discussions and possibly differing views. 

There have already been commissions set up by government specifically to investigate corruption within institutions and organisations — even universities that undertake reef research in Queensland.

In facts claims of the need for quality assurance, could be a euphemism for ‘the scientists are taking the money and just making-stuff-up’.

Presently each Australian state has an anti-corruption commission. In Queensland there is the Crime and Corruption Commission (QCCC). The core function of this office is to investigate such allegations.

Indeed this branch of the Queensland government — with the grand title ‘Commission’—has far reaching powers to compel testimony and examine evidence. The QCCC actually receives thousands of complaints each year concerning misconduct by politicians, government officers even scientists — but finds time to investigate less than 5 percent of what is lodged by the tax-payers who funds this office/commission, as well as all the reef research.

The other 95 percent of the complaints lodged annually at the QCCC are referred straight back to the organisation against which the complaint has been lodged!

So, if you as a citizen of Queensland lodge a complaint against the Great Barrier Reef Marine Park Authority, for example, chances are that you will have your complaint investigated by — the Great Barrier Reef Marine Park Authority.

I know of a complaint of corrupt conduct lodged against a Queensland university (not James Cook University) by a former staff member in about 2016 that was immediately referred back to that same Queensland university. Despite all the evidence meticulously complied by the well-qualified former staff member concerning their misconduct, that university’s management determined that it simply did not have a case to answer.

Concerned that his detailed allegations had ended-up back with her university management that wouldn’t let him back on the ladder, the former staff member made a ‘Right to Information Request’ to the QCCC. He wanted to know how often this was the course of action, and how effective such an approach might be — essentially asking the vixens to inspect the chickens, dead and alive.

The QCCC responded that there was no relevant documentation at all. To be clear the Queensland Crime and Corruption Commission has never undertaken an assessment of the effectiveness of their complaints referral process. Yet this is where 95 percent. of the complaints from Queensland citizens reside.

This same commission, set up by government to provide some oversight of government, including government science at universities, has an annual budget of more than $60 million.

The Royal Commission into misconduct in the Banking, Superannuation and Financial Services found these non-government organisations also had oversight committees, and the committees were often aware of serious misconduct and possible criminal behaviour impacting on customers. Yet they mostly failed to do anything about it: they failed to properly self regulate.

Previously, the Royal Commission into Institutional Responses to Child Sexual Abuse in Australia uncovered that senior church officials were aware of sometimes hundreds of individual cases of abuse, yet their response though internal investigation was denial extending over the decades as victims suicided.

So, why would the LNP — currently the opposition government in Queensland — think that an ‘Office of Science Quality Assurance’ within a government department or other, will be able to make a difference to research research – or the plight of sugarcane growers who happen to farm next to the Great Barrier Reef?

Investigation into the veracity and quality of Great Barrier Reef scientific findings, is going to be infinitely more difficult than an investigation into a transaction between the Commonwealth Bank and yet another customer looking for some help with their superannuation.

Research institutions across Australia, including the Great Barrier Reef Marine Park Authority, the ARC Centre for Excellence and the Australian Institute of Marine Science are now as conformist and corporatist as banks — while almost totally dependent on government funding but under no obligation to archive their data.

The idea that these government-institutions run by bureaucrats (each on a ladder) will do anything except ensure such an ‘Office of Science Quality Assurance’ endorses the research that they manage, while squashing dissent, is so naive as to be dangerous.

The term Fourth Estate is sometimes used with reference to the mainstream media, suggesting they are as important as the three branches of government: legislative, executive and judicial for the correct functioning of a democracy. But we know they are as wedded to the idea the Great Barrier Reef is ruin, as Barrack Obama who, also, has never visited it.

There is a need for a revolution: for individuals within governments to become accountable again, for individual scientists to interest themselves in matters of truth, and for individual journalists to take an interest in their evidence.

Instead we increasingly persist in a society where legitimacy resides only with those embedded in such institutions that are increasingly conformist and corporatist — intent on limiting the potential of the individual particularly the individual who dissents. Through constant negotiations — mostly behind closed doors — the special interests of reef research charities and renewable energy advocates, alike, are growing.

Regulation and oversight of government by government does not work anymore — if it ever did.

The best response to the current corruption so obviously now embedded in Great Barrier Reef research would be for the LNP to pass a motion to severely restrict tax payer funding to those so animated by the prospect of reef ruin.

This could potentially limit the waste, and deceit — and who really would miss them? Only politicians who must save things, and journalists too lazy to find real stories — and to check if there really is coral beyond that mud flat to the immediate south of Bowen.

The corporatist culture that increasingly rules Queensland means an ‘Office of Science Quality Assurance’ within any branch of this state government, as proposed by the LNP on the weekend, will only inevitably end-up another brick in the wall against creativity, innovation and independent thought … all so important for the progress of science.

Indeed, all our science is primitive and childlike when measured against the reality of the resilience of the Great Barrier Reef — that has existed for 10,000 years despite floods, droughts and climate change.

There are corals, including so much Porites cylindrica, the other side of this mud flat but for the sake of fake news so many reef researchers deny it.

***
The feature image is by The National Archives UK – Animal Farm artwork, No restrictions.

Filed Under: Information Tagged With: Great Barrier Reef

Recent Sea Level Fall – Since When?

July 9, 2019 By jennifer

ALWAYS in search of an ultimate truth, I’m rarely one to admit that everything is relative. When it comes to shorelines and the age of ‘wave cut platforms’, however, there is no escaping it … the relativism.

The sea and the climate are modelling our coastline as a sculptor might work a piece of clay … except over a longer time frame, and the shoreline is made of materials that are much tougher and much less consistent than clay. I’m specifically referring to the coastal sandstones, and also the granites, and even the igneous intrusions (from past volcanoes), along the coastal track from Main Beach at Noosa Heads to Hell’s Gates in Noosa National Park.

Geological time can be thought of in terms of the last few thousand years, the last few 100 thousand years, and also in terms of millions of years.

Over these periods sea levels along the east coast of Australia have risen, and fallen, and risen again. The factors causing the change in sea level over these time periods can be understood in terms of the varying orbits, tilts and wobbles of the Earth around the Sun, and also the varying levels of radiation emitted from the Sun. There are other factors. For example, varying declination of the moon may cause a 18.6 year pattern in sea levels. But this is unlikely to leave a mark on the shoreline … unless there are corals, as I will discuss at the Maroochydore Surf Lifesaving Club this Sunday*.

*****************************
If you are coming on Sunday, please book here: https://www.trybooking.com/book/event?eid=520591

******************************

Waves pound at cliff faces. Sometimes until they are cut back to sea level.

So, along the east coast of Australia – along the path I often walk from Hasting Street/Main beach to Hell’s Gates – and back, I find what are called by geologists ‘wave cut platforms’.

This photograph was taken looking north from Granite Bay, early one Sunday morning in June.

These ‘wave cut platforms’ exist where the sea has cut into the cliff face, creating a flat area that we would expect to be at sea level.

Well … we would expect the wave cut platform to be at sea level only if sea levels did not change.

If sea levels are rising then these platforms should be underwater.

The potholes in the rock platform to the north of Tea Tree Bay are above the high tide mark. These holes in the sandstone are thought to be formed from boulders working as grinding stones in the surf, as explained in the comments thread of a previous blog post.

These rock pools are known as potholes by geologists. This photographs was taken from my drone late in the afternoon, to the north of Tea Tree Bay, Noosa National Park. Can you see me in the photograph … I’m there, looking up?

Mostly, I see wave cut platforms above sea level. Yet, the east coast of Australia is often defined by geologists as a “relatively young sea-coast” — for example in W.J. Dakin’s book entitled ‘Australian Seashores’.

Where there are rock platforms that are well defined, yet a couple of metres or so above the highest tides, is this perhaps evidence that sea levels have fallen relatively recently. But exactly when?

This blog post is partly a shout-out to knowledgeable geologists …

Considering the coastline in these pictures taken from my new drone (called Skido):

1. When are the sandstone platforms likely to have been cut by the waves?

2. Would the rock platform with the pot holes have been cut during the last inter-glacial period from perhaps 140,000 to 120,000 years ago?

3. Is there any evidence of the more recent Holocene high-stand, which I understand to have been about 6,000 years?

I understand that sea levels were about 2 metres higher 120,000 years ago, and about 1.5 metres higher 6,000 years ago?

According to Warwick Willmott’s book entitled ‘Rocks and Landscapes of the Sunshine Coast’ the headlands of Noosa, Coolum and Point Cartwright were islands during the last inter-glacial.

In between this last-interglacial and the beginning of the Holocene (some 11,600 years ago) we had a fall in the sea level of about 150 metres along the Sunshine Coast – I’m quoting again from Warwick Willmott.

I should like to take some photographs of the underwater platforms that are evidence of the 150 metre fall in sea level. So, how far off the coast will I need to send my drone?

*****************
UPDATE 11 JUNE 2019

I’ve walked over these potholes at high tide, and was sure the surf didn’t get that far … but I had to check, and get some photographs to be sure. So, I went this afternoon for what was a relatively high tide of 2.0 metres at 4.30pm. The highest for this year was 2.32 metres on 22nd January. The second highest will be on 1st August at 2.27 metres.

Anyway, following are three photographs (from today on the highest tide) to provide additional perspective.

A screen shot from video of the pot holes, this time on a very high tide.

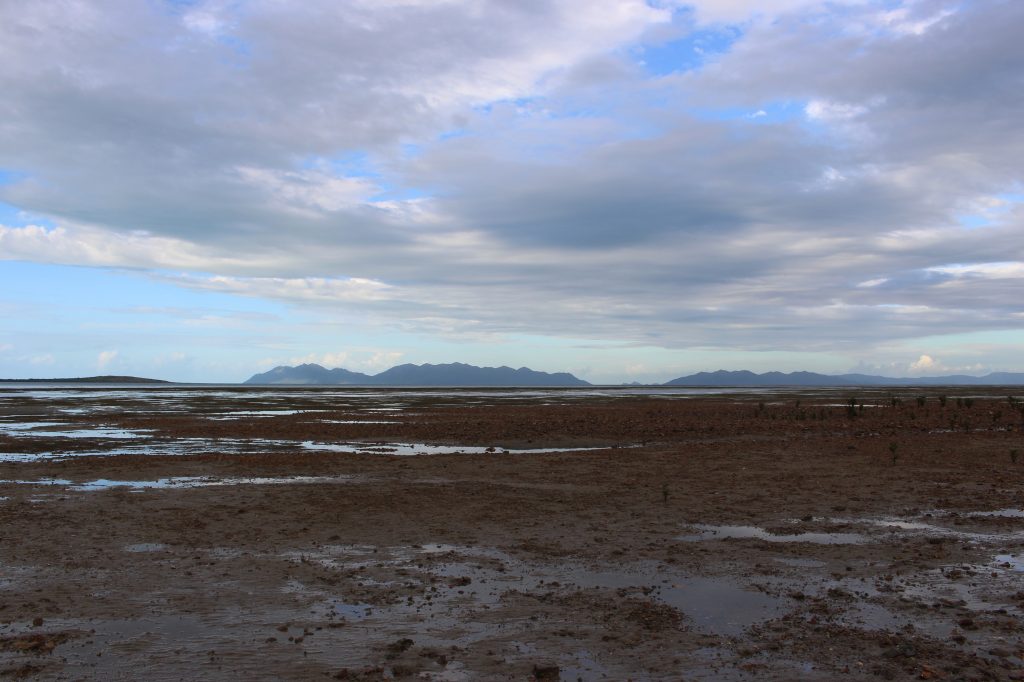
A photograph of the pot holes, on the very high tide today, 11th July 2019./caption]

****

*I shall be showing these photographs of rocky landscapes, and many more of corals, at the Maroochydore Surf Lifesaving Club this Sunday (14th July) at 2pm. Coral can give us an indication of sea level fall over much shorter time frames, for example, since 1950 as I will show on Sunday.

Everyone is welcome at the surf club, entry is $10, please register online here. The instructions are to go to Level 3, which is the Conference Room. The address is 36 Alexander Parade, Maroochydore. I’m told the $10 includes afternoon tea!

Filed Under: Information Tagged With: sea level change

Sea Level Fall at the Great Barrier Reef

July 7, 2019 By jennifer

I’VE been asked to speak this coming Sunday at the Maroochydore Surf Club (36 Alexander Parade, Sunshine Coast) about climate change at the Great Barrier Reef, and to provide both a local and global perspective.

It is sometimes said that “all politics is local”, but this is hardly the case with climate change: it has become such a political issue and usually the focus is global. This global focus, and particularly the focus on carbon dioxide as a driver of climate change, has confused understanding of some really basic phenomena — phenomena that are both predictable and natural.

It was entirely predictable that with the extreme El Niño of 2015/2016 there would be more coral bleaching than usual due to the falling sea levels, and perhaps also higher temperatures.

Yes, that is correct, falling sea levels.

If we consider mean monthly sea levels at Darwin (as recorded by the
Permanent Service for Mean Sea Level based in the UK) they were exceptionally low in 1997/1998 and then again in 2015/2016, as shown in Figure 1. There were falling sea levels across the western Pacific.

Indeed an El Niño is a climate cycle in the Pacific Ocean with a global impact on weather patterns that begins when warm water in the western tropical Pacific Ocean shifts eastward along the equator toward the coast of South America.

Monthly mean sea level (mm) Darwin, 1992 to 2018.

Corals usually grow-up to just below the lowest mean spring tide. Corals are particularly vulnerable to extremely low tides and in particular low tides in the middle of the day when there is also high solar radiation. The damage from such events may leave a characteristic tell-tale structure, for example, micro-atolls.

I have a picture of my mother (who migrated to Australia after WWII, see the picture featured at the top of this post) standing in front of a micro-atoll at Heron Island, where she worked as a waitress in the mid-1950s. I have another picture — I will show at the Maroochydore surf club on Sunday — showing the extent of the bleaching at Heron Island at that time.

This coral bleaching back in the 1950s, and much of the recent bleaching at the Great Barrier Reef, may have been due to falling sea levels, rather than extreme temperatures as I will explain on Sunday.

Of course, another determinant of sea level is the quantity of ice on Earth. This has varied significantly over geological time. Modern variations in ice and sea levels are negligible when compared with those from natural Ice Age cycles.

I will show some evidence of past cycles embedded in the local Sunshine Coast landscape, including when Maroochydore was underwater because of higher sea levels just 120,000 years ago.

Everyone is welcome at the Surf Club, but please book online. I will speak for about 1 hour … beginning at 2pm on Sunday 14th July on Level 3 which is the Conference Room, 36 Alexander Parade, Maroochydore. If you are coming please book online: https://www.trybooking.com/book/event?eid=520591

I hope to see you there.

Filed Under: Information Tagged With: Great Barrier Reef

My Atheism Denies Hell, But Applauds Mary McKillop

July 5, 2019 By jennifer

MY late father told me not to admit that I was an atheist … when I was preparing to appear on the ABC television program ‘Q&A’ back in October 2010.

It was likely that Tony Jones would ask me a question about Mary McKillop being made a saint, as this was a media headline back then.

Through history atheists have been vilified.

During the nineteenth century in Britain, for example, the poet Percy Bysshe Shelley was expelled from the University of Oxford for publishing a pamphlet explaining his atheism. At the time, those unwilling to swear Christian oaths during judicial proceedings were unable to give evidence in court.

Nowadays, atheism is tolerated in the West, but not in many Muslim countries where atheists are sentenced to death — presumably with the assumption he/she is going to hell. In these countries atheism is often confused with apostasy, which is defined as the abandonment or renunciation of a religious or political belief or principle.

I’ve never actually embraced a religion — though I was raised in the Presbyterian tradition — so I’m not sure how I could renounce it.

The idea that someone like myself simply does not believe is very difficult for many/most people to accept. But it is a fact. I’ve always looked to nature, not the Bible, for answers to the big questions. So, I’m fascinated by natural landscapes, which I feel always provide me with some solace, as well as understanding.

The coastline where I live at Noosa, for example, has a history that dates back perhaps 145 million years. I’m referring to the dolorite intrusion to the north of Granite Bay. Tea Tree Bay, just to the north again, has interesting wave cut platforms of sandstone, with abrasions called potholes – by geologists. I’m keen for a knowledgable geologist to explain how old these formations in this level bedrock are likely to be (see the feature image for this blog post) and what they might tell us about sea level change.

It is a fact the etching in a shoreline hold history, and meaning, for some people – myself included.

This does not mean I am in any way intolerant of those who believe in the presence of a God. When Tony Jones did ask me about miracles back in 2010, I replied:

JENNIFER MAROHASY: Like the Prime Minister [who back then was Julia Gillard], I don’t believe in miracles but I do think that it is important that we have heroes and Mary McKillop is a hero for a lot of people, particularly within the Catholic faith and I’m very pleased that for those Australians their hero is being recognised and being recognised in the Vatican and I understand that Mary McKillop stood up against paedophilia within the church and I think it’s wonderful that the Catholic Church is not only recognising a woman but an Australian and somebody who has stood up to issues that didn’t necessarily make her popular back then.

So, while I’m an atheist I respect the beliefs held by others, including Christians and Muslims.

There is a media preoccupation at the moment in Australia with the footballer Israel Folau who was sacked from the Australian team for claiming that all homosexuals, and also atheists, are going to hell.

I understand that such a claim is likely to be more offensive to a homosexual who may also be a Christian, than to an atheist who does not believe in the concept of hell. Nevertheless, I suggest that homosexuals as well as atheists be tolerant of his perspective. In fact, I thank him for having the fortitude to be so upfront in what I perceive as his ignorance. Surely, it is better that the ignorant man tell us what he is thinking so that we can have some discussion about this, least he keep the untruth to himself and let it fester.

****
The photograph is of me, and some potholes etched into Tea Tree Bay, Noosa National Park, and was taken with my new drone (Skido) in June 2019.

Filed Under: History, Opinion, Philosophy Tagged With: geology

Primary Sidebar

Recent Comments

  • Ian Thomson on Vax-ed as Sick as Unvax-ed, Amongst My Friends
  • Dave Ross on Vax-ed as Sick as Unvax-ed, Amongst My Friends
  • Dave Ross on Vax-ed as Sick as Unvax-ed, Amongst My Friends
  • Alex on Incarceration Nation: Frightened of Ivermectin, and Dihydrogen monoxide
  • Wilhelm Grimm III on Incarceration Nation: Frightened of Ivermectin, and Dihydrogen monoxide

Subscribe For News Updates

  • This field is for validation purposes and should be left unchanged.

July 2019
M T W T F S S
1234567
891011121314
15161718192021
22232425262728
293031  
« Jun   Aug »

Archives

Footer

About Me

Jennifer Marohasy Jennifer Marohasy BSc PhD has worked in industry and government. She is currently researching a novel technique for long-range weather forecasting funded by the B. Macfie Family Foundation. Read more

Subscribe For News Updates

Subscribe Me

Contact Me

To get in touch with Jennifer call 0418873222 or international call +61418873222.

Email: jennifermarohasy at gmail.com

Connect With Me

  • Facebook
  • LinkedIn
  • RSS
  • Twitter
  • YouTube

Copyright © 2014 - 2018 Jennifer Marohasy. All rights reserved. | Legal

Website by 46digital