• Skip to primary navigation
  • Skip to main content
  • Skip to primary sidebar
  • Skip to footer
Jennifer Marohasy

Jennifer Marohasy

a forum for the discussion of issues concerning the natural environment

  • Home
  • About
  • Publications
  • Speaker
  • Blog
  • Temperatures
  • Coral Reefs
  • Contact
  • Subscribe

Archives for February 2019

Changes to Darwin’s Climate History are Not Logical

February 23, 2019 By jennifer

THE hubris of the Australian Bureau of Meteorology is on full display with its most recent remodelling of the historic temperature record for Darwin. The Bureau has further dramatically increased the rate of global warming at Darwin by further artificially lowering historic temperatures.

This begins by shortening the historical temperature record so that it begins just after the very hot years of the Federation drought. Then by changing the daily values: that is changing the observed measured temperatures to something else.

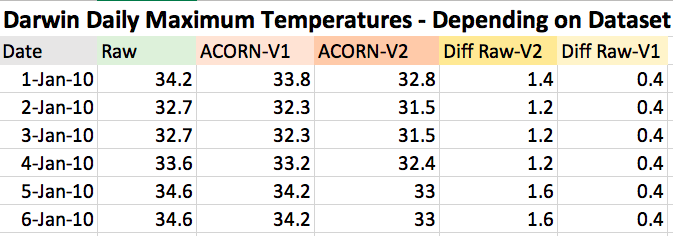
For example, on 1st January 1910 the maximum temperature recorded at the Darwin post office was 34.2 degrees Celsius.

A few years ago, the Bureau changed this to 33.8 degrees Celsius, cooling the recorded temperature by 0.4 degrees. In its most recent re-revision of Darwin’s climate history the temperature on this day has been further reduced, and is now just 32.8.

The daily maximum temperatures for early 1910 as shown in the three different datasets for Darwin

Environmental reporter for the Australian newspaper, Graham Lloyd, asked the Bureau why it had made such changes earlier in the week. A spokesperson is quoted in The Weekend Australian as follows:

“For the case of Darwin, a downward adjustment to older records is applied to account for differences between the older sites and the current site, and difference¬s between older thermometers and the current automated sensor.

“In other words, the adjustments estimate what historical temperatures would look like if they were recorded with today’s equipment at the current site.”

Yet this is a version of exactly the same reason given by the Bureau just six years ago for reducing the temperature on 1 January 1910 by ‘only’ 0.4 degrees.

Neither the equipment, nor the site has changed since ACORN-SAT Version 1 was published in 2012.

Yet another 1 degree has been shaven from the historical temperature record!

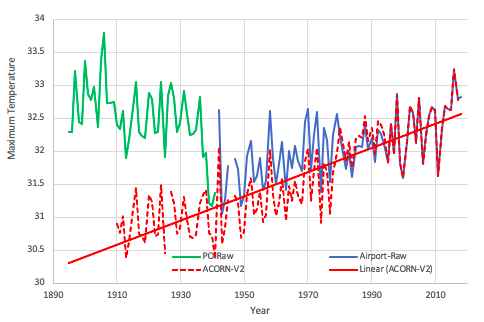
To be clear, the weather station has been at the airport since February 1941, and an automatic weather station was installed on 1 October 1990. A Stevenson screen was first installed at the post office site in 1894, and has always been used at the airport site.

So, why was the temperature dropped down by a further one degree for 1 January 1910 in the most recent revision – undertaken just a few months ago? There is no logical or reasonable explanation.

Apparently, at the Bureau, the future is certain and the past can be continually changed – history can be continually revised.

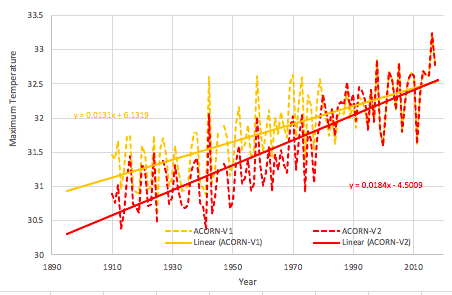
When the daily values are added-up, and compared between versions as annual mean maximum temperatures we see the magnitude of the change – and its effect on temperature trends.

The warming trend of 1.3 degrees C per 100 years in ACORN V1 has been changed to 1.8 degrees C per 100 years in Version 2. The annual average maximum temperature for 1942, as one example, has been reduced by 0.5 degrees.

The extent of global warming increases from 1.3 degrees Celsius per 100 years to 1.8 degrees Celsius in the latest revisions by the Bureau to Australia’s temperature history.

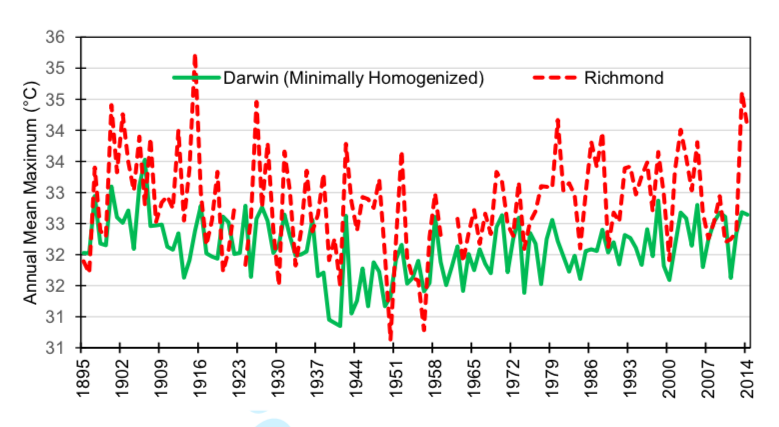
In the maximum temperature record as actually measured at Darwin from 1895 to the present — and taking into consideration the move from the airport to the post office –- there is no warming trend in the Darwin temperature record. This is consistent with other locations in northern Australia with long high-quality records, for example Richmond in north western Queensland.

Annual mean maximum temperatures as measured at Richmond, Qld, charted with a minimally homogenized series for Darwin that combines the post office and airport series into one continuous temperature series making adjustments only for the move to the airport.
Mean maximum annual temperatures as measured at the Darwin Post Office and airport shown with the new remodeled ACORN-SAT Version 2, which is the new official record for Australia.

What the Bureau has done to the historical temperature record for Darwin is indefensible. The Bureau has artificially shortened and cooled Darwin’s climate history to make it consistent with the theory of human-caused global warming.

Ends.

Filed Under: Information Tagged With: Temperatures

Bureau Rewrites History – Again, at Albany

February 16, 2019 By jennifer

THE Australian Bureau of Meteorology keeps remodelling the temperature record for Australia – and not just by a little bit. Temperatures are changed through a process known as homogenisation, and then changed again, sometimes by as much as 6.4 degrees Celsius for the one day.

The temperatures as actually measured at Albany, and other places, has been changed by the Bureau in the development of the official temperature record for Australia.

For example, on 8th February 1933 the maximum temperature as measured at Albany in Western Australia was 44.8 degrees Celsius. Then, six years ago it was changed to 51.2 degrees Celsius! Recently it was changed again, this time to 49.5.

Changing the temperature record like this is not unusual for institutions such as the Australian Bureau of Meteorology, though the extent of the change for Albany on this day in 1933, and also the direction of the change, is unusual.

Usually past temperatures are cooled relative to the present as part of remodelling, which is called ‘homogenisation’. Cooling the past relative to the present has the effect of exaggerating global warming.

Given the magnitude and direction of this change to the Albany temperatures, which was first made six years ago, several of us asked the Bureau: ‘Why’?

Why was the temperature at Albany on this day (February 8, 1933) adjusted-up by so much (6.4 degrees) in the official version 1 of the ACORN-SAT dataset that was published six years ago?

I never got an answer.

I have simply been told, mostly via the mainstream media, that homogenisation is world’s best practice, and that ACORN-SAT is scientific.

Of course, it is not scientific to make such changes to temperature measurements, though this type of change – this remodelling – is standard practice not only for our Bureau but also for the custodians of the global temperature datasets relied upon by the IPCC (United Nation’s Intergovernmental Panel on Climate Change).

While ACORN-SAT Version 1 contains remodelled temperature values that can vary from the actual recorded measurement by more than 6 degrees, the values in this same database are often referred to as ‘observations’ as though they represent real measurements. For example, when leading climate scientist Sophie Lewis and David Karoly published a paper in the American Meteorological Society journal about ‘extreme events’ they erroneous refer to ACORN-SAT Version 1 values as ‘observations’.

Indeed, ACORN-SAT Version 1 has underpinned almost all the climate change work at our universities and at CSIRO over the last 6 years.

Most climate scientists seem to want to believe that the temperature values that they are working with represent real measurements. But they don’t!

Just recently this ACORN-SAT database – used by Lewis, Karoly and thousands of other scientists here in Australia and also overseas – was updated. Dr Blair Trewin at the Bureau has re-adjusted temperature values yet again, creating ACORN-SAT Version 2.

In the case of Albany, the maximum temperature on 8th February 1933 is now shown as 49.5 degrees Celsius. In reality it the maximum temperature in Albany on that day back in 1933 was 44.8 degrees Celsius.

The integrity of the historical temperature record is of extraordinary importance. This record also underpins belief in catastrophic human-caused global warming.

Perhaps today’s front-page story in The Australian newspaper by Graham Lloyd will generate some interest in how and why our climate history can be so change, apparently at the whim of the Bureau and other such institutions around the world.

I wait, and I hope.

Filed Under: Information Tagged With: Temperatures

Primary Sidebar

Recent Comments

  • Ian Thomson on Vax-ed as Sick as Unvax-ed, Amongst My Friends
  • Dave Ross on Vax-ed as Sick as Unvax-ed, Amongst My Friends
  • Dave Ross on Vax-ed as Sick as Unvax-ed, Amongst My Friends
  • Alex on Incarceration Nation: Frightened of Ivermectin, and Dihydrogen monoxide
  • Wilhelm Grimm III on Incarceration Nation: Frightened of Ivermectin, and Dihydrogen monoxide

Subscribe For News Updates

  • This field is for validation purposes and should be left unchanged.

February 2019
M T W T F S S
 123
45678910
11121314151617
18192021222324
25262728  
« Dec   Mar »

Archives

Footer

About Me

Jennifer Marohasy Jennifer Marohasy BSc PhD has worked in industry and government. She is currently researching a novel technique for long-range weather forecasting funded by the B. Macfie Family Foundation. Read more

Subscribe For News Updates

Subscribe Me

Contact Me

To get in touch with Jennifer call 0418873222 or international call +61418873222.

Email: jennifermarohasy at gmail.com

Connect With Me

  • Facebook
  • LinkedIn
  • RSS
  • Twitter
  • YouTube

Copyright © 2014 - 2018 Jennifer Marohasy. All rights reserved. | Legal

Website by 46digital