
FOR some time, weather enthusiasts across Australia have been noticing rapid temperature fluctuations at the ‘latest observations’ page at the Australian Bureau of Meteorology’s website. For example, Peter Cornish, a retired hydrologist, wrote to the Bureau on 17 December 2012 asking whether the 1.5 degrees Celsius drop in temperature in the space of one minute at Sydney’s Observatory Hill could be a quirk of the new electronic temperature sensors. Ken Stewart, a retired school principal, requested temperature data for Hervey Bay after noticing a 2.1 degrees Celsius temperature change in the space of one minute on 22 February 2017.
So, begins my article to be published later today at The Spectator online, perhaps to be entitled ‘More Hot Days Caused by Purpose-Designed Temperature Sensors’. [That article was eventually published at both The Spectator and WUWT.]
But if you read a bit beyond the headline you will see that my issue is not so much with the temperature sensors as the way in which the Bureau is not averaging according to calibration. In particular, and to paraphrase some more from the article…
Beginning some twenty years ago, electronic sensors have progressively replaced mercury thermometers in weather stations across Australia. The sensors can respond much more quickly to changes in temperature, and on a hot day, the air is warmed by turbulent streams of ground-heated air that can fluctuate by more than 2 degrees on a scale of seconds. So, if the Bureau simply changed from mercury thermometers to electronic sensors, it could increase the daily range of temperatures, and potentially even generate record hot days simply because of the faster response time of the sensors.
Except to ensure consistency with measurements from mercury thermometers there is an international literature, and international standards, that specify how spot-readings from sensors need to be averaged – a literature and methodology being ignored by the Bureau.
To be clear, the UK Met office takes 60 x 1 second samples each minute from its sensors, and then averages these. In the US, they have decided this is too short a period, and the standard there is to average over a fixed 5-minute period. In Australia, however, the Bureau takes not five-minute averages, nor even one-minute averages, but just one second spot-readings.
Check temperatures at the ‘latest observations’ page at the Bureau’s website and you would assume the value had been averaged over perhaps 10 minutes. But it is dangerous to assume anything when it comes to our Bureau. The values listed at the ‘observations’ page actually represent the last second of the last minute. The daily maximum (which you can find at a different page) is the highest one-second reading for the previous 24-hour period: a spot one-second reading in contravention of every international standard. There is absolutely no averaging.
Then again, how many of you knew that the mean daily temperature as reported by meteorological offices around the world is not an average of temperatures recorded through the day but rather the highest and the lowest divided by two – as is the convention.
This convention developed because (surface) temperature measurements were originally instantaneous measurements from mercury thermometers recorded manually each morning (providing the minima) and afternoon (providing the maxima).
So, in the UK the daily maximum from a weather station with an electronic sensor will be the highest value derived from the averaging of 60 samples over that one minute interval, while in Australia, the daily maximum will be the highest one-second spot reading.
And, the method for averaging from the sensors does matter, as shown in the attached spreadsheet using synthetic values to illustrate this point, and summarized in Figure 1.
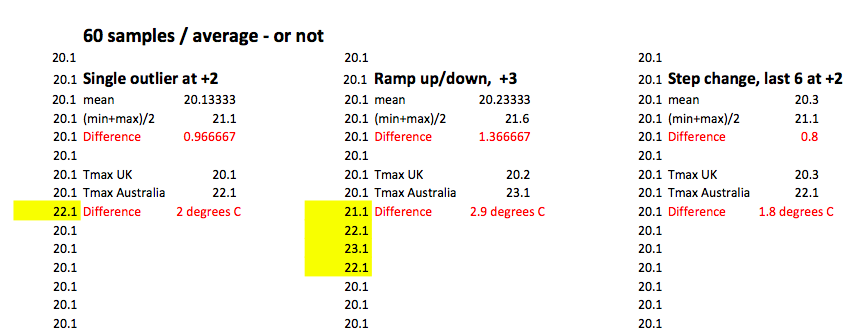
The values shown in the three-worked example fall well within the general range of variation possible within a one-minute interval considering highest, lowest and last second values as shown in some of the datasets purchased by Ken Stewart from the Bureau earlier this year.
In the first example, which could be symptomatic of ‘sensor noise’, there is a single outlier of 22.1 in the 60 one-second readings from the sensor. If these are averaged, as is done by the UK Met office, then the recorded temperature measurement for that minute is 20.1 degrees Celsius. If, however, the highest one-second value is recorded, which is the method applied in Australia, the recorded temperature would be 22.1 degrees Celsius. There is a whole 2 degrees of difference. If we apply the meteorological convention for generating mean daily values, then the difference is 1 degrees Celsius (0.9666 rounded).
In the second example, which could reflect a wind direction change, or jet plane exhaust, the difference between the UK Met office method of averaging over 1 minute versus the Australian method of taking a one second spot reading is the rather large 2.9 degrees Celsius.
In the third example, where there is a step change, the difference between the UK and Australian methods for treatment of sub-minute readings is 1.8 degrees Celsius.
More recently the Bureau have attempted to suggest yet another method of averaging, as detailed in their Fast Facts. But this is really just obfuscation, in more recent correspondence with me CEO Andrew Johnson has used the correct term when calculating how long it takes a sensor to adjust to a step change in temperature, which is ‘time constant’.
*****
The spreadsheet detailing the different averaging methods can be downloaded here: Averaging-NF-JM
I am blessed to be part of an Alt-Met network that includes Kneel (who sent me a first version of this spread sheet), Ken Stewart, Lance Pidgeon, Phill and others… thanks for the conversations.
 Jennifer Marohasy BSc PhD has worked in industry and government. She is currently researching a novel technique for long-range weather forecasting funded by the B. Macfie Family Foundation.