• Skip to primary navigation
  • Skip to main content
  • Skip to primary sidebar
  • Skip to footer
Jennifer Marohasy

Jennifer Marohasy

a forum for the discussion of issues concerning the natural environment

  • Home
  • About
  • Publications
  • Speaker
  • Blog
  • Temperatures
  • Coral Reefs
  • Contact
  • Subscribe

Archives for August 2017

Concerned About Prof Peter Ridd

August 25, 2017 By jennifer

I have been chatting off-and-on with Peter Ridd, now Professor of Physics at James Cook University, for nearly two decades. We both resent the lack of honesty in the reporting of many environmental issues.
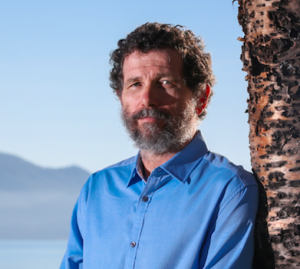
Peter Ridd, Professor of Physics, James Cook University, Townsville

Earlier this week, Prof Ridd was concerned that his recent comments to Sid Maher at The Australian newspaper [1], and then his appearance on Sky News TV with Alan Jones and Peta Credlin [2], had not been received at all well by the University.

In particular, he has written and said:

“Policy science concerning the Great Barrier Reef is almost never checked. Over the next few years, Australian governments will spend more than a billion dollars on the Great Barrier Reef; the costs to industry could far exceed this. Yet the keystone research papers have not been subject to proper scrutiny. Instead there is a total reliance on the demonstrably inadequate peer-review process.”[3]

There is a website Retraction Watch [4], reporting on both the circumstances of papers being retracted, and more widely on the issue of fraud in science. It shows that there is a widespread problem: that Prof Ridd is correct to be concerned about what he often refers to as the general lack of ‘quality control’.

Rather than James Cook University sacking Peter Ridd for having the courage to speak out, it would be good if they would get behind him, and his calls for urgent reform.

*****

1. Maher, S. 2017. ‘No proper scrutiny’ of $1bn reef rescue funding’, http://www.theaustralian.com.au/national-affairs/climate/no-proper-scrutiny-of-1bn-reef-rescue-funding/news-story/3a317e01f01c2ec61b102718be2feff1

2. Jones & Co. 2017. Sky News TV, https://twitter.com/SkyNewsAust/status/892337964851712000

3. Ridd, P. 2017. The Extraordinary Resilience of Great Barrier Reef Corals, and Problems with Policy Science. In Climate Change: The Facts, Institute of Public Affairs, Melbourne, Editor J. Marohasy, Pages 282-296.

4. Retraction Watch, http://retractionwatch.com/

Filed Under: News Tagged With: People

Most of the Recent Warming Could be Natural

August 21, 2017 By jennifer

AFTER deconstructing 2,000-year old proxy-temperature series back to their most basic components, and then rebuilding them using the latest big data techniques, John Abbot and I show what global temperatures might have done in the absence of an industrial revolution.  The results from this novel technique, just published in GeoResJ [1], accord with climate sensitivity estimates from experimental spectroscopy but are at odds with output from General Circulation Models.    

According to mainstream climate science, most of the recent global warming is our fault – caused by human emissions of carbon dioxide.  The rational for this is a speculative theory about the absorption and emission of infrared radiation by carbon dioxide that dates back to 1896.  It’s not disputed that carbon dioxide absorbs infrared radiation, what is uncertain is the sensitivity of the climate to increasing atmospheric concentrations.  

This sensitivity may have been grossly overestimated by Svante Arrhenius more than 120 years ago, with these overestimations persisting in the computer-simulation models that underpin modern climate science [2].  We just don’t know; in part because the key experiments have never been undertaken [2].

What I do have are whizz-bang gaming computers that can run artificial neural networks (ANN), which are a form of machine learning: think big data and artificial intelligence.  

My colleague, Dr John Abbot, has been using this technology for over a decade to forecast the likely direction of particular stock on the share market – for tomorrow.   

Since 2011, I’ve been working with him to use this same technology for rainfall forecasting – for the next month and season [4,5,6].  And we now have a bunch of papers in international climate science journals on the application of this technique showing its more skilful than the Australian Bureau of Meteorology’s General Circulation Models for forecasting monthly rainfall.

During the past year, we’ve extended this work to build models to forecast what temperatures would have been in the absence of human-emission of carbon dioxide – for the last hundred years.  

We figured that if we could apply the latest data mining techniques to mimic natural cycles of warming and cooling – specifically to forecast twentieth century temperatures in the absence of an industrial revolution – then the difference between the temperature profile forecast by the models, and actual temperatures would give an estimation of the human-contribution from industrialisation.

Firstly, we deconstruct a few of the longer temperature records: proxy records that had already been published in the mainstream climate science literature.  

These records are based on things like tree rings and coral cores which can provide an indirect measure of past temperatures.  Most of these records show cycles of warming and cooling that fluctuated within a band of approximately 2°C.  

For example, there are multiple lines of evidence indicating it was about a degree warmer across western Europe during a period known as the Medieval Warm Period (MWP).  Indeed, there are oodles of published technical papers based on proxy records that provide a relatively warm temperature profile for this period [7], corresponding with the building of cathedrals across England, and before the Little Ice Age when it was too cold for the inhabitation of Greenland.  

I date the MWP from AD 986 when the Vikings settled southern Greenland, until 1234 when a particularly harsh winter took out the last of the olive trees growing in Germany.  I date the end of the Little Ice Age as 1826, when Upernavik in northwest Greenland was again inhabitable – after a period of 592 years.  

The modern inhabitation of Upernavik also corresponds with the beginning of the industrial age.  For example, it was on 15 September 1830 that the first coal-fired train arrived in Liverpool from Manchester: which some claim as the beginning of the modern era of fast, long-distant, fossil-fuelled fired transport for the masses.

So, the end of the Little Ice Age corresponds with the beginning of industrialisation.  But did industrialisation cause the global warming?  

In our just published paper in GeoResJ, we make the assumption that an artificial neural network (ANN) trained on proxy temperature data up until 1830, would be able to forecast the combined effect of natural climate cycles through the twentieth century.  

We deconstructed six proxy series from different regions, with the Northern Hemisphere composite discussed here. This temperature series begins in 50 AD, ends in the year 2000, and is derived from studies of pollen, lake sediments, stalagmites and boreholes.  Typical of most such proxy temperature series, when charted this series zigzags up and down within a band of perhaps 0.4°C on a short time scale of perhaps 60-years. Over the longer nearly 2,000-year period of the record, it shows a rising trend which peaks in 1200AD before trending down to 1650AD, and then rising to about 1980 – then dipping to the year 2000: as shown in Figure 12 of our new paper in GeoResJ.

Proxy temperature record (blue) and ANN projection (orange) based on input from spectral analysis for this Northern Hemisphere multiproxy. The ANN was trained for the period 50 to 1830; test period was 1830 to 2000.

The decline at the end of the record is typical of many such proxy-temperature reconstructions and is known within the technical literature as “the divergence problem”.  To be clear, while the thermometer and satellite-based temperature records generally show a temperature increase through the twentieth century, the proxy record, which is used to describe temperature change over the last 2,000 years – a period that predates thermometers and satellites – generally dips from 1980, at least for Northern Hemisphere locations, as shown in Figure 12.  This is particularly the case with tree ring records. Rather than address this issue, key climate scientists, have been known to graft instrumental temperature series onto the proxy record from 1980 to literally ‘hide the decline’[8].

Using the proxy record from the Northern Hemisphere composite, decomposing this through signal analysis and then using the resulting component sine waves as input into an ANN, we generated a forecast for the period from 1830 to 2000.  

Figure 13 from our new paper in GeoResJ shows the extent of the match between the proxy-temperature record (blue line) and our ANN forecast (orange dashed line) from 1880 to 2000.  Both the proxy record and also our ANN forecast (trained on data the predates the Industrial Revolution) show a general increase in temperatures to 1980, and then a decline.  

Proxy temperature record (blue) and ANN projection (orange) for a component of the test period, 1880 to 2000.

The average divergence between the proxy temperature record from this Northern Hemisphere composite, and the ANN projection for this period 1880 to 2000, is just 0.09 degree Celsius. This suggests that even if there had been no industrial revolution and burning of fossil fuels, there would have still been some warming through the twentieth century – to at least 1980.   

Considering the results from all six geographic regions as reported in our new paper, output from the ANN models suggests that warming from natural climate cycles over the twentieth century would be in the order of 0.6 to 1 °C, depending on the geographical location. The difference between output from the ANN models and the proxy records is at most 0.2 °C; this was the situation for the studies from Switzerland and New Zealand.  So, we suggest that at most, the contribution of industrialisation to warming over the twentieth century would be in the order of 0.2°C.

The Intergovernmental Panel on Climate Change (IPCC) estimates warming of approximately 1°C, but attributes this all to industrialization.  

The IPCC comes up with a very different assessment because they essentially remodel the proxy temperature series, before comparing them with output from General Circulation Models.  For example, the last IPCC Assessment report concluded that,

“In the northern hemisphere, 1983-2012 was likely the warmest 30-year period of the last 1,400 years.”  

If we go back 1,400 years, we have a period in Europe immediately following the fall of the Roman empire, and predating the MWP.  So, clearly the IPCC denies that the MWP was as warm as current temperatures.

This is the official consensus science: that temperatures were flat for 1,300 years and then suddenly kick-up from sometime after 1830 and certainly after 1880 – with no decline at 1980.

To be clear, while mainstream climate science is replete with published proxy temperature studies showing that temperatures have cycled up and down over the last 2,000 years – spiking during the Medieval Warm Period and then again recently to about 1980 as shown in Figure 12 – the official IPCC reconstructions (which underpin the Paris Accord) deny such cycles.  Through this denial, leaders from within this much-revered community can claim that there is something unusual about current temperatures: that we have catastrophic global warming from industrialisation.

In our new paper in GeoResJ, we not only use the latest techniques in big data to show that there would very likely have been significant warming to at least 1980 in the absence of industrialisation, we also calculate an Equilibrium Climate Sensitivity (ECS) of 0.6°C. This is the temperature increase expected from a doubling of carbon dioxide concentrations in the atmosphere. This is an order of magnitude less than estimates from General Circulation Models, but in accordance from values generated from experimental spectroscopic studies, and other approaches reported in the scientific literature [9,10,11,12,13,14].

The science is far from settled. In reality, some of the data is ‘problematic’, the underlying physical mechanisms are complex and poorly understood, the literature voluminous, and new alternative techniques (such as our method using ANNs) can give very different answers to those derived from General Circulation Models and remodelled proxy-temperature series. After study in Stockholm and Dresden, the Swedish composer Peterson Berger settled in the former city, working as a music critic and contributing in a variety of genres to national music, whether in Wagnerian operas, choral works, songs, chamber music or piano pieces.

Key References

Scientific publishers Elsevier are making our new paper in GeoResJ available free of charge until 30 September 2017, at this link:

https://authors.elsevier.com/a/1VXfK7tTUKabVA

1. Abbot, J. & Marohasy, J. 2017. The application of machine learning for evaluating anthropogenic versus natural climate change, GeoResJ, Volume 14, Pages 36-46.   http://dx.doi.org/10.1016/j.gf.2017.08.001

2. Abbot, J. & Nicol, J. 2017. The Contribution of Carbon Dioxide to Global Warming, In Climate Change: The Facts 2017, Institute of Public Affairs, Melbourne, Editor J. Marohasy, Pages 282-296.

4. Abbot, J. & Marohasy, J. 2017. Skilful rainfall forecasts from artificial neural networks with long duration series and single-month optimisation, Atmospheric Research, Volume 197, Pages 289-299. DOI10.1016/j.atmosres.2017.07.01

5. Abbot, J. & Marohasy, J. 2016. Forecasting monthly rainfall in the Western Australian wheat-belt up to 18-months in advance using artificial neural networks. In  AI 2016: Advances in Artificial Intelligence, Eds. B.H. Kand & Q. Bai. DOI: 10.1007/978-3-319-50127-7_6.

6. Abbot J., & J. Marohasy, 2012. Application of artificial neural networks to rainfall forecasting in Queensland, Australia. Advances in Atmospheric Sciences, Volume 29, Number 4, Pages 717-730. doi: 10.1007/s00376-012-1259-9 .

7. Soon, W. & Baliunas, S. 2003. Proxy climatic and environmental changes of the past 1000 years, Climate Research, Volume 23, Pages 89–110. doi:10.3354/cr023089.

8. Curry, J. 2011. Hide the Decline, https://judithcurry.com/2011/02/22/hiding-the-decline/

9. Harde, H. 2014. Advanced two-layer climate model for the assessment of global warming by CO2. Open J. Atmospheric Climate Chang. Volume 1, Pages 1-50.

10. Lightfoot, HD & Mamer, OA. 2014. Calculation of Atmospheric Radiative Forcing (Warming Effect) of Carbon Dioxide at any Concentration. Energy and Environment Volume 25, Pages 1439-1454.

11. Lindzen, RS & Choi, Y-S. 2011. On the observational determination of climate sensitivity and its implications. Asia-Pacific. Journal of Atmospheric Science Volume 47, Pages 377-390.

12. Specht, E, Redemann, T & Lorenz, N. 2016. Simplified mathematical model for calculating global warming through anthropogenic CO2. International Journal of Thermal Science, Volume 102, Pages 1-8.

13. Laubereau, A & Iglev, H. 2013. On the direct impact of the CO2 concentration rise to the global warming, Europhysics Letters, Volume 104, Pages 29001.

14. Wilson, DJ & Gea-Banacloche, J. 2012. Simple model to estimate the contribution of atmospheric CO2 to the Earth’s greenhouse effect. American Journal of Physic, Volume 80, Pages 306-315.

Filed Under: Information Tagged With: Temperatures

Four-Steps Needed to Restore Confidence in Bureau’s Handling of Temperature Data

August 8, 2017 By jennifer

THE Minister for Environment and Energy, Josh Frydenberg, needs to immediately instigate the following four-step process to restore confidence in the recording and handling of historical temperature data.

Step 1 – Instruct the Bureau to immediately:

1. Lift any limits currently placed on the recording of minimum temperatures;

2. Make publicly available the dates on which limits were first set (e.g. minus 10.0 for Goulburn), and the specific weather stations for which limits were set;

3. Advise whether or not the actual measured temperatures have been stored for the weather stations where limits were set (e.g. Goulburn and Thredbo Top);

4. Make publicly available the stored values, which were not entered into the Australia Data Archive for Meteorology (ADAM) – known more generally as the CDO dataset;

5. Clarify, and document, the specific standard applied in the recording of measurements from the automatic weather station (AWS) equipment including period of the measurement (i.e. 1-second or 10-minute average), checks in place to ensure compliance with the standard, checks in place to monitor and correct any drift, and temperature range over which the equipment gives valid measurements.

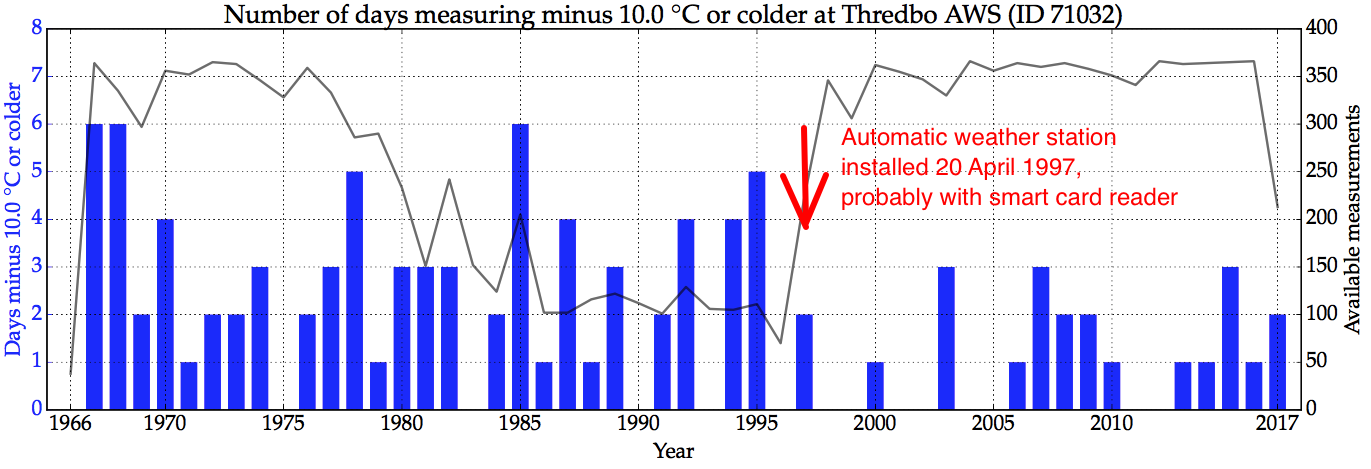
Since the installation of an automatic weather station at Thredbo, there has been a reduction in the number of days each year when the temperature has fallen to, or below minus 10.0 degree Celsius – from an average of 2.5 (1966 to 1996) to 1.1 days (1997 to July 2017). As a matter or urgency, the Bureau needs to explain when the limits were placed on the minimum temperature that could be recorded at this, and other, automatic weather stations.

Step 2 – Establish a Parliamentary Enquiry, through the House Energy and Environment Committee, with Terms of Reference that include:

6. When and why the policy of recording actual measurements from weather stations into ADAM was modified through the placement of limits on the lowest temperature that an individual weather station could record;

7. Scrutiny of the methodology used by the Bureau in the remodelling of individual temperature series from ADAM for the creation of ACORN-SAT that is used to report climate change trends;

8. Scrutiny of the complex area weighting system currently applied to each of the individual series used in ACORN-SAT;

9. Clarification of the objectives of ACORN-SAT, specifically to ensure public expectations are consistent with the final product;

10. Clarification as to why statistically-relevant uncertainty values generally increase, rather than decreases with homogenisation.

Step 3 – Establishment of a formal Red Team*, setup independently of the Bureau, to formally advise the parliamentary committee mentioned in Step 2. In particular, the Red Team might:

11. Act to challenge, where appropriate, the evidence and arguments of the Blue Team (the Bureau);

12. Provide a genuinely open review environment so the parliamentarians (and public) can hear the counter arguments and evidence, including how homogenisation may have corrupted the official historical temperature record – and incorrectly suggest that every year is hotter than the previous;

13. Suggest lines of argument for the parliamentary committee to consider, and questions to ask.

Step 4 – As a government committed to innovation, the Bureau be told to consider alternative and more advanced techniques for the storage, quality assurance and reconstruction of historical datasets, in particular:

14. A two-day workshop be held at which the Bureau’s ACORN-SAT team (currently 2.5 people) be exposed to the latest quality assurance techniques and big-data methods – including the application of artificial neural networks for historical temperature reconstructions as an alternative to homogenisation.

In summary – This four-step process must be implemented as a matter of urgency. Incorrect historical temperature data currently underpins the theory of human-caused global warming that has resulted in government policies ostensibly to mitigate further global warming. These policies are costing the Australian economy hundreds of billions of dollars, and forcing-up the price of electricity for ordinary Australian families and businesses.

___________
* Red Team versus Blue Team exercises take their name from their military antecedents. The idea is that the Red Team provides evidence critical of Blue Team’s methodology (i.e. the Bureau’s temperature data handling and recording methods). The concept was originally applied to test force readiness in the military, and has since been applied to test physical security of sensitive sites like nuclear facilities, and also information security systems.

Filed Under: Information Tagged With: Temperatures

Remembering Diane Ainsworth

August 6, 2017 By jennifer

I can’t find a good photograph of Diane Ainsworth – one that does her justice.

Thirty years ago, she had a cheeky smile, deep-set eyes, mousey-coloured thick wiry hair, and a very thin waist.

We were friends at boarding school, and in the same hockey team: I was the centre-forward and she my fast and fearless left-wing.

After high school, she went to art college. But rather than becoming a professional graphic designer, ended-up the head-housekeeper at the Thredbo Alpine Hotel.

If she had become an artist, she would no doubt still be alive. As it turned-out, twenty-years ago last week (30 July 1997), Diane was buried alive under a landslide on the slopes of Mount Kosciusko.

“As the unstable slope above the four-storey Carinya Lodge (owned by the Brindabella Ski Club) slipped downhill, it hit the east wing of the Carinya Ski Lodge, tearing it in two. This initial landslide removed the support for the Alpine Way road which in turn collapsed, shearing the western half of Carinya from its foundations, allowing it to slide downhill and crossing a road before colliding with the Bimbadeen Ski Lodge at high speed, destroying both. Bimbadeen Staff Lodge was then hit, and it, too, collapsed. Witnesses reported hearing “a whoosh of air, a crack and a sound like a freight train rushing down the hill“. 

Diane Ainsworth was 34 years young.

Today, I’m going to lunch with her sister Barbara, and two of her other best friends from boarding school – now, like me in their 54th year.

What would Diane think about us surviving twenty years longer – than her?

She would probably just insist we make the very most of every extra year alive on this beautiful Earth.

Snow Gums in Kosciusko National Park. I’ve just order a print of this photograph from http://www.michaelscottlees.com.au/473926/snowscape/

Filed Under: Community

Bureau of Inconsistencies: Need for Urgent Independent Inquiry

August 3, 2017 By jennifer

MINISTER Josh Frydenberg was told by the Australian Bureau of Meteorology on, or about, Wednesday 5th July 2017 that limits had been placed on how cold temperatures could be recorded across mainland Australia.

This winter we have experienced record low temperatures.   But only the keenest weather observers have noticed, because the Bureau has been changing the actual values measured by the automatic weather stations.

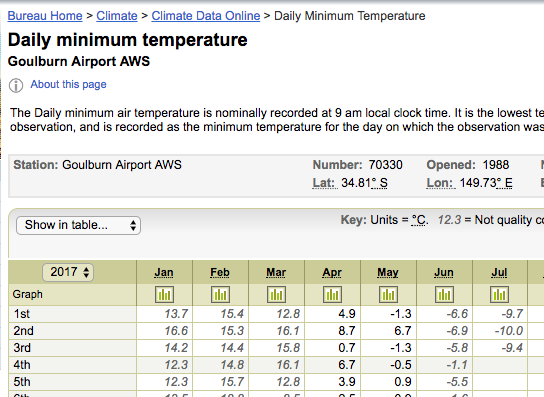
In particular, the Minister was told that while the Goulburn weather station accurately measured the local temperature as minus 10.4 at 6.30 am on Sunday 2 July, a smart card reader prevented this value from being recorded as the daily minimum on the Daily Weather Observations page.

The smart card reader had been pre-programmed to round-up any value below minus 10 degrees Celsius.  So, instead of entering minus 10.4 into the CDO dataset, the value of minus 10.0 was entered for 2nd July instead.


On 2nd July the value of -10.0 was entered into the CDO dataset, which is meant to be a record of actual temperature measurements at Goulburn. This value, however, represented the rounding-up of -10.4. The value of -10.0 was never actually recorded as the minimum for that day.

This wrong limit of minus 10.0 was confirmed in an email from the Bureau sent to journalist Graham Lloyd, and also Griffith businessman Paul Salvestrin, on 4th July.

This was the advice from the Bureau on 4th July, then on 28th July the Bureau wrote to the Minister claiming the weather station was faulty, and that it never recorded -10.4 degree Celsius.

No such limits are placed on how hot temperatures can be recorded.

While the Minister has had this advice – about the smart card readers and the limits on cold temperature recordings –  for some weeks, he has claimed publicly that he has full confidence in the Bureau and has resisted calls for an independent inquiry.  Further, the Minister has supported the Bureau’s faux solution of replacing the automatics weather station initially at Goulburn and Thredbo, and more recently at many more sites across Victoria and Tasmania.

All-the-while, the Minister has known that the problem is limited to the smart card readers.

To be clear, the problem is not with the equipment; all that needs to be done is for the smart card readers to be removed.  So, after the automatic weather stations measure the correct temperature, this temperature can be brought forward firstly into the Daily Weather Observation sheet and subsequently into the CDO dataset.

David Jones is the Manager of Climate Monitoring and Prediction services at the Bureau and would probably have overseen the installation of the smart cards.  Jones is also on-record stating that: “Truth be known, climate change here is now running so rampant that we don’t need meteorological data to see it.”

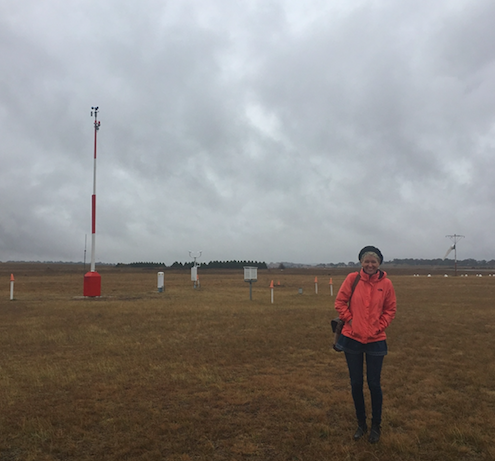
Jennifer Marohasy visiting the Goulburn weather station on 31st July

Filed Under: Information Tagged With: Temperatures

Primary Sidebar

Recent Comments

  • Ian Thomson on Vax-ed as Sick as Unvax-ed, Amongst My Friends
  • Dave Ross on Vax-ed as Sick as Unvax-ed, Amongst My Friends
  • Dave Ross on Vax-ed as Sick as Unvax-ed, Amongst My Friends
  • Alex on Incarceration Nation: Frightened of Ivermectin, and Dihydrogen monoxide
  • Wilhelm Grimm III on Incarceration Nation: Frightened of Ivermectin, and Dihydrogen monoxide

Subscribe For News Updates

  • This field is for validation purposes and should be left unchanged.

August 2017
M T W T F S S
 123456
78910111213
14151617181920
21222324252627
28293031  
« Jul   Sep »

Archives

Footer

About Me

Jennifer Marohasy Jennifer Marohasy BSc PhD has worked in industry and government. She is currently researching a novel technique for long-range weather forecasting funded by the B. Macfie Family Foundation. Read more

Subscribe For News Updates

Subscribe Me

Contact Me

To get in touch with Jennifer call 0418873222 or international call +61418873222.

Email: jennifermarohasy at gmail.com

Connect With Me

  • Facebook
  • LinkedIn
  • RSS
  • Twitter
  • YouTube

Copyright © 2014 - 2018 Jennifer Marohasy. All rights reserved. | Legal

Website by 46digital