
The wild, wet weather across southern Australia this spring is a consequence of an unusually strong temperature gradient, especially evident in the following chart as warm water to the north of Australia (especially in the Timor and Arafura Seas), and the cold waters off the southwest of Australia.
Former head of Australia’s National Climate Centre, Bill Kininmonth, recently emailed me:
The warm water has increased the supply of moisture feeding into the airflow over Australia. The moisture increases by nearly 7 percent with each degree C temperature rise. The cold water to the south and west of Australia tightens the temperature gradient and increases the potential for storm development (technically it is called increasing baroclinic instability). It is normal to have a period of tightening temperature gradient during spring time – the nearby ocean and land of southern Australia are cold after winter but the approach of summer is warming ocean and water of north Australia. Because of this annual tightening of the gradient, spring is the wettest period with often strong storms over southeast Australia. This year has been particularly wet and stormy because of the pattern of sea surface temperature anomalies. It is not climate change.
As the oceans have a critical influence on land temperatures, this same pattern is evident in the surface temperature data for Western Australia. While Perth has had its coldest September on record, it’s actually been very warm in the north of the state.
A colleague has plotted the following fascinating chart which shows a running yearly average of mean temperatures from 180 sites as recorded by the WA Agriculture Department.
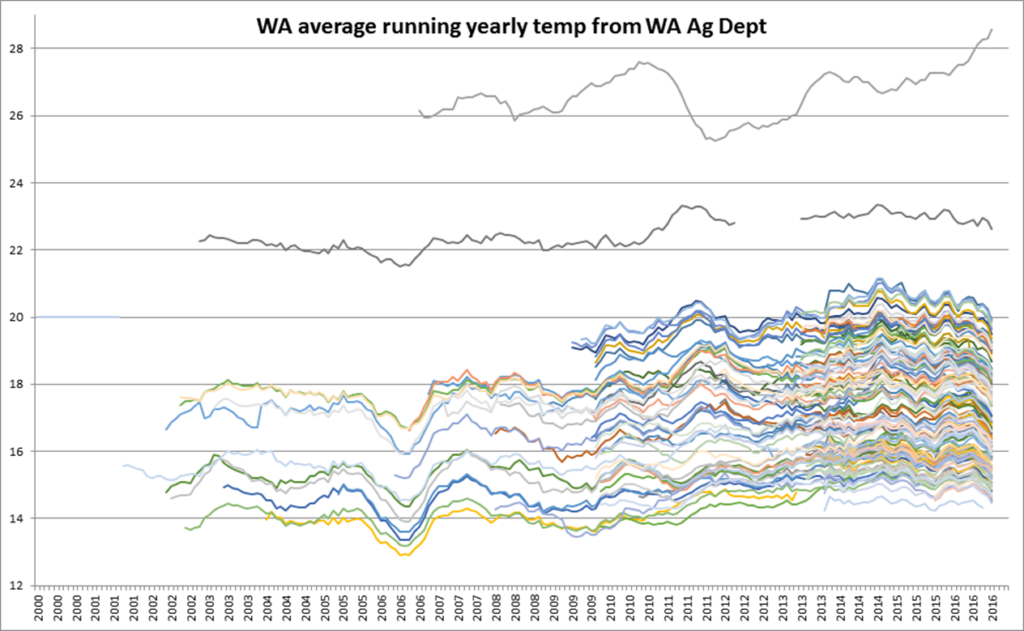
The top line is Kununurra, in the far north, showing temperatures are still rising. The next line is Carnarvon. The great mass of lines are the southwest corner of WA from just north of Geraldton to east of Esperance and these show temperatures are all falling. The coldest lines are at elevated places like Mt Barker. The brown line starting around 2008, and at 16.7C, is South Perth.
There is a remarkable consistency about the southwest corner where the coolest 12 months ended in mid-2006 and the average then climbed around 2.5C to a peak in late 2014 and has dropped by a little over 1C since then.
So what happens next?
The water to the far northwest is very warm as can be seen by the rise in Kununurra surface temperatures, and the orange in the NOAA sea surface temperature map. The Leeuwin current that brings the warm water down the coast is normally weakest in the summer months and strongest over the autumn and winter.
 Jennifer Marohasy BSc PhD has worked in industry and government. She is currently researching a novel technique for long-range weather forecasting funded by the B. Macfie Family Foundation.