IN the very first report from the United Nation’s Intergovernmental Panel on Climate Change (IPCC) the Medieval Warm Period was evident as a period, about as warm as the present, occurring from AD 950 to 1250. In subsequent IPCC reports there is no such warm period in this historical record. Instead there is a graph, shaped like an ice-hockey stick, which suggests temperatures were flat until the 20th Century, when sudden and sustained warming occurs.

The change, from the presence of a clear warm period about 1000 years ago to none at all in more recent reports, is justified by the IPCC on the basis that while it may have been warmer in Europe when the Vikings founded settlements on Greenland, and England was exporting wine to France, this warming was not global. The warming, according to the IPCC, was restricted to the North Atlantic region. Which begs the question, how important is regional variability when we are discussing global warming?
Furthermore, no-one lives in a world climate. It’s what happens locally and regionally that is most important to individual communities. We should expect that an El Nino event in the Pacific Ocean, for example, is going to affect the western United States very differently from eastern Australia. Indeed, such events are often associated with wetter conditions in southwest USA, and hotter, drier conditions in eastern Australia.
The focus on mean global temperatures, rather than regional variability, has been a consequence of the politicization of climate science and the desire to use the authority of science to force political change. Many of those opposed to this political agenda, often labelled sceptics or deniers, have focused on temperature series that show little or no global warming, while the mainstream climate science community has gone to ever more extreme lengths to make particular temperature time series conform to their theory of anthropogenic global warming.
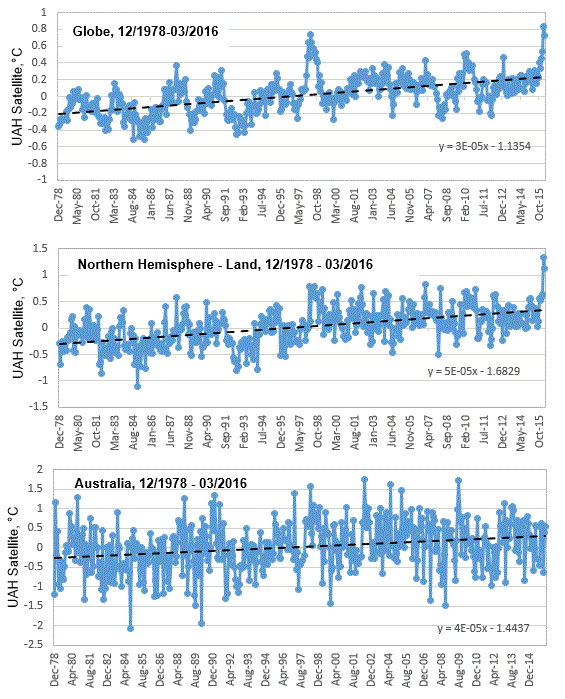
Some so-called sceptics had been focusing on the satellite record over recent years, because that component of this record based on the mean global temperature, showed no increase since the El Nino event of 1997/98, Chart 1a. However, more recently, and largely as a consequence of the relatively warm and wet winter in the northern hemisphere, there has been another spike in the global mean temperature based on this satellite record.
This signifies the end of “the pause” in the mean global temperature for the UAH satellite record. Though, interestingly, some have simply changed their geographic focus, much as the IPCC did with the Medieval Warm Period. In particular, some so-called sceptics now emphasis the geographic variability in the satellite record, in particular, that southern hemisphere temperatures showing no recent spike.

The satellite record as compiled by scientists John Christy and Roy Spencer, at the University of Alabama (UAH), Huntsville, includes monthly updates for the entire globe, for the northern and southern hemispheres, the south and north poles, the tropics, the United States of America, and also for Australia. The UAH satellite record also separates out ‘land’ and ‘ocean’. So, for the northern hemisphere, as an example, it is possible to understand temperature trends for the land versus ocean components of this record. When we consider the land component of the UAH satellite record for the northern hemisphere, the recent spike in temperatures is particularly pronounced, Chart 1b. Meanwhile, for Australia, there is no such recent spike in temperatures. Rather temperatures appear to cycle within an approximate 4 degree Celsius band, Chart 1c.
Patterns in the historical temperature record, and geographic variability in temperature trends, potentially gives us insight into the drivers of climate change. Many, however, would argue that as the satellite temperature record only goes back 38 years to 1978, that this is too short a period for discerning correlations with sunspots, and other extraterrestrial phenomena. In fact, consistency between the UAH satellite record for Australia, and records from individual weather station in Australia over this same period (December 1978 – March 2016), potentially gives us the opportunity to infer what temperatures would have been like at least back to when these weather stations were first installed. There is, for example, a reliable thermometer temperature record for Richmond in north eastern Australia back to 1893. Considering just the trends, not the absolute temperatures, the thermometer record for this location shows a remarkably good correlation with the satellite record for all of Australia for the period December 1978 to March 2016, Chart 2.
![The monthly thermometer record for Richmond, NE Australia, compared with the UAH satellite record for all of Australia. [Note, chart 1 was a plot of anomalies, this is a plot of actual temperatures.]](https://jennifermarohasy.com.dev.internet-thinking.com.au/wp-content/uploads/2016/04/UAH-Richmond-Monthly-toMarch2016.gif)
The pattern in the unadjusted thermometer record for Richmond, and the shorter satellite records for all of Australia, the northern hemisphere and the globe, are not consistent with carbon dioxide as a significant driver of temperature change.
Additional Information:
For more information on the UAH satellite record compared with other global data bases consider reading a recent post by Bob Tisdale at WUWT: https://wattsupwiththat.com/2016/03/12/february-2016-global-surface-landocean-and-lower-troposphere-temperature-anomaly-update/
For more information on the temperature record for Richmond, and why this unadjusted series is so unique and important consider reading a recent post focused on Darwin, but also considering other sites in northern Australia, here: https://jennifermarohasy.com.dev.internet-thinking.com.au/2016/02/12910/
I have commented in more detail on the ‘end of the pause’ and the likely reason for the recent surge in the global mean temperature, as measured by satellites, in a recent popular article at On Line Opinion here: http://www.onlineopinion.com.au/view.asp?article=18111

 Jennifer Marohasy BSc PhD has worked in industry and government. She is currently researching a novel technique for long-range weather forecasting funded by the B. Macfie Family Foundation.