
A CENTRAL thesis of global warming is that temperatures will keep going up, and up. They did from about 1960 to 2002 at many places around Australia, but not at all of them. At Ruthergen, a wine-growing region of north-eastern Victoria, temperatures have been fairly steady since a Stevenson screen was erected and temperatures first recorded back in November 1912. 
The Bureau of Meteorology includes Rutherglen in a network of stations that it uses to report on regional and national temperatures. But it doesn’t report on the temperature values as recorded at Rutherglen. It first remodels them. Through this process the mean annual minium temperature trend is changed from cooling of 0.35 degree celsius per century to warming of 1.73 degree celsius per century. That’s a pretty large change in both magnitude and direction.
Since this was first reported in The Australian by Graham Lloyd there have been accusations that people like myself are into conspiracy theories, and more. But we really would just like some answers.
No one is more curious than Bill Johnston. He is disappointed that Andy Pitman and other Australian climate experts seem to be avoiding discussion of the temperature data for Rutherglen. Out of curiosity, and also in an attempt to generate some scientific interest amongst his collegues, Dr Johnston has undertaken the following analysis. It’s a bit technical. But hopefully not too technical for the experts.
Rutherglen – A brief overview by Bill Johnston
I examined the data graphically using a CuSum curve (cumulated deviations from the grand mean). There were 4 turning points, in 1923, 1957, 1964 and 1975. Two of those could have been independently-documented climate shifts (~1923 and ~1975).
I analysed the annual minimum temperature data, down-loaded from BoM using shift-detection software (CPA from variation.com) and sequential t-tests (STARS) (see: http://www.beringclimate.noaa.gov/regimes/rodionov_var.pdf) allowing for autocorrelation; and assuming all data were in-range (Huber’s H = 5).
CPA, which is based on bootstrapping, is not so good, when there are numerous changepoints. However, it detected shifts in 1924 and 1937 (P = 99% and 82% respectively). I did not follow-through fine-tuning the methodology, as I’d normally do to ensure no additional steps.
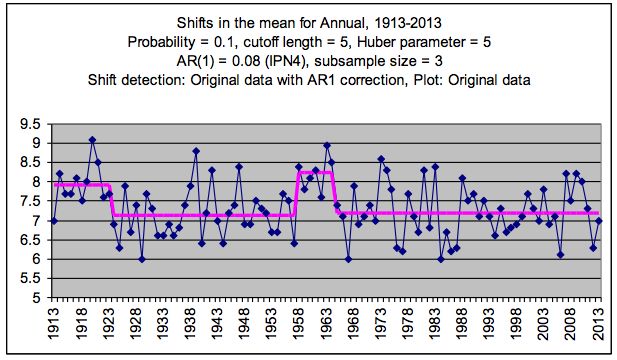
STARS detected regime changes in 1924 (P = 0.0007), 1958 (P = 6.07E-06) and 1965 P = 3.85E-06). This was inconsistent with the published metadata. The ACORN catalogue mentions no station moves. The steps were not documented climate-change years.
STARS settings are indicated on the graphic, so anyone can obtain the STARS Excel add-in, and data and re-do the analysis and check my interpretation. (Years indicated are start-years for the new regime.)
Of the step-changes, the 1965 shift was the most influential. Ignoring the intervening ‘hump’ the difference in mean level between 1957 and 1965 was 0.06 degree C.
Because it occurs in the middle of the dataset, such a step change could be trend-determining. If the hump alone was deducted, by shifting the data down by the difference, the 1965 shift may not be detectable. Trend however, would be little altered, and would still be no different to zero-trend.
The hump could have been a data-fill; a temporary move or a change in screen-aspect or instruments; but that is all a guess.
The shift down in 1924 of 0.77 degree C is consistent with a possible station move. However, based on Metadata, no such move happened, which was the point made by Jennifer Marohasy, which in-turn was based on the best information available from the BoM ACORN catalogue.
If we go back to BoM’s climate data on line, there was a post office record (082038; 1903-1925) as well as a viticulture research record (082085; 1903-1927). I’ve not compared these, but at an annual scale, they should behave in parallel (same trend, different intercepts).
(A graphical way of checking is to difference the datasets, and cumulatively sum the result, to see if the CuSum of the difference goes ‘off-line”. (Add a to b, then the answer, to c and so on – it takes 2 calculation columns, one for the difference, the other for the CuSum, and data needs to be closed-up on missing pairs). I think visual comparisons; using line-graphs are difficult to interpret. (Also some people have trouble with discerning colours.) Comparing regression lines may also introduce the possibility of spurious trends in either or both of the datasets being compared.
It so happens that in my research collaboration days, our team met time-about in the historic and interesting viticulture laboratory, which became a meeting room within the Rutherglen Research complex.
It seems likely that, in order to produce the long ACORN record; between 1924 and 1927, the viticulture record was merged with the Rutherglen Research record, and that BoM ignored or did not detect that particular stitch.
It could also have been an inadvertent error; the sort of thing that happens when someplace morphs into something else. (It could have been done locally for example.) (I don’t know when Rutherglen became an agricultural research centre.)
Irrespective of all the argy-bargy, the important points are:
1. The truth is in the data, not necessarily the metadata.
2. Without leaving Excel, small (less than 1 degree C) enduring shifts in the mean level of a data-stream, typical of undocumented changes, can be detected. However, for any time-series iterative testing using contrasting tests, and interpretive skill is required (at the 95% level there is a 5% chance of NOT detecting a shift that is real).
3. Most importantly, in the case of Rutherglen (and Deniliquin; RAAF Amberley; Longreach; Nobbys Head, Moruya PS and elsewhere) when abrupt-shifts are allowed for (deducted sign-intact), it is often the case residual trends are not different to zero-trend. (It can also be the case that the data are useless; Eucla may be in that category!)
In other words, for many places, naïve mean-squares trends may be spurious. They are due to shifts either in the measurements or in the climate.
In Rutherglen’s case, trend between 1924 and 1957 (34 years), and between 1958 and 2013 (49 years) were no different to (bootstrapped) zero trend (P <0.05). (Least squares trends were 0.007 and –0.003 oC/yr.) This further supports the view that we have a non-trending data stream, containing a small step. According to CPA and STARS there were no significant (P <0.05) changes in variability. With all step-changes removed, there was no trend. There are four important lessons. 1. Graphical and statistical evaluation on a site-by-site basis is essential before any inter-station comparisons, or inter-station homogenizations are undertaken. This is formally called exploratory data analysis (EDA). My endless analysis of data leads me to conclude that many series are not fit-for-purpose; or that it is simply not possible to detect valid trends against background noise. (Valid trends are trends ex-steps. For least-squares regression to be valid, data MUST be homogeneous.) 2. There can be changes within data that are undocumented (like Rutherglen and Amberley); likewise there can be documented changes that don’t result in data inhomogeneties (Eucla possibly being a case in point). 3. It is inappropriate for the Bureau having made a mistake in respect of supporting comments made by Professor David Karoly, who has a long history of being biased; to pull in heavy artillery from another, potentially equally-biased UNSW group, in an attempt to reclaim the high-ground. 4. There is an answer. I’ve put forward a transparent approach. Having said that I’m quite willing to be proved wrong at the statistical confidence level of P =0.05. The situation has become a bit absurd.
The Bureau needs to show unambiguously ‘true’ or ‘real’ uncontestable positive trends in minimum temperature data that don’t rely on their homogenisation procedures.
It is really that simple.
If BoM cannot do that, they have lost the statistical debate and need to fess-up or develop yet another trend-setting dataset.
Cheers,
Dr Bill Johnston
Former NSW Natural Resources Research Scientist
Note that I am a data analyst, not an expert mathematical statistician. I would not be regarded as an expert in the sense of arguing a statistical case with BoM, for example. That does not invalidate my analysis; it is simply a disclaimer. And if you want disclaimers, look no further than most BoM reports.

 Jennifer Marohasy BSc PhD has worked in industry and government. She is currently researching a novel technique for long-range weather forecasting funded by the B. Macfie Family Foundation.